Journal of Environmental Protection
Vol. 4 No. 8A2 (2013) , Article ID: 36156 , 13 pages DOI:10.4236/jep.2013.48A2007
The Spatial Variability and Temporal Dynamics of Soil Properties as Affected by Visitors’ Pressure in an Urban Park
![]()
Laboratory of Geomorphology and Soil, Department of Geography and Environment, Bar-Ilan University, Ramat Gan, Israel.
Email: helena.zhevelev@biu.ac.il
Copyright © 2013 Helena M. Zhevelev et al. This is an open access article distributed under the Creative Commons Attribution License, which permits unrestricted use, distribution, and reproduction in any medium, provided the original work is properly cited.
Received June 2nd, 2013; revised July 8th, 2013; accepted August 3rd, 2013
Keywords: Urban Park; Urban Soil; Visitors’ Pressure; Soil Spatial Variability; Seasonal Dynamics
ABSTRACT
Soil properties and their tempo-spatial heterogeneity, affected by visitors’ pressure, season and soil depth, were studied in an urban park in Tel-Aviv. Soil was sampled twice yearly in wet and dry seasons. In each season soil was sampled from areas exposed to differing levels of visitors’ pressure (VP), and designated “no VP (Control)”, “High VP” and “Low VP”. The soil samples were taken from two depths. For each soil sample, moisture, organic matter and soluble-ion contents, pH, and electrical conductivity were determined. It was found that different properties were differently affected by VP, seasonal dynamics and soil depth: organic matter content, penetration depth and sodium concentration were the most sensitive to VP; Soil moisture did not respond to VP, but sharply reflected seasonal changes; Calcium and organic matter contents were significantly affected by the soil depth. The sensitivity of soil properties to VP increased from March to July, and the upper soil layer was more sensitive to seasonal dynamics and VP than the deeper layer. Some soil properties exhibited “spotty” patterns; others a “frontal” one. Organic matter content was completely controlled by VP at both depths and in both seasons, and could be used as an indicator of soil status in recreation areas. Visitors’ activities included trampling and other anthropogenic factors that enhanced the spatial changes and seasonal dynamics of soil properties. Based on these measurements the intensity of soil degradation and dynamics was evaluated and used to describe the soil status in an urban park.
1. Introduction
Parks are one of the most important elements of sustainable development and optimization of urban environments [1], and first and foremost are intended for inner-city recreation [2]. Thus, “human-caused impact” [3], which significantly altered the urban ecosystem [4], and urban soil genesis [5] in the park area are supplemented by visitors’ pressure (VP). This means that, in addition to natural factors, soil in urban parks is affected by the mutual feedbacks between urbanization and VP. These two factors might affect the soil in the same direction, thus enhancing their effects, or in opposite directions, in which case they might cancel one each other.
Urbanization affects the organic matter content and quality of soil [6,7], which may be decreased [8] or enriched [9,10] even more than in natural soils [11]. VP, in most cases, sharply decreased organic matter content [12- 14] or did not show a clear trend [15].
In urban areas, the water regime changes that result from a lowered groundwater table, asphalt cover and urban climate, lead to decrease of soil moisture content [9]. The effect of VP decreased soil moisture as well, especially for sandy soil [16,17].
Urban soil alkalinity tends to increase because of dust deposits that are enriched in calcium and magnesium carbonates, and in anti-frost reagents, such as sodium chlorides [11,18]. However, other researchers have attributed a decrease of soil alkalinity to acidified precipitation [9,19]. Under visitors’ pressure pH increased as a result of decreases of litter biomass, organic matter and vegetation cover [12,17].
Urbanization leads to eutrophication, which increases the nutrient contents of soil [19], but, conversely, VP decreased the availability of soil nutrients [20].
Compaction of the soil surface increased because of the effects of both urbanization [9,11,21] and visitors’ pressure [13,22,23]. Studies of the mechanisms of compacted soil degradation in urban parks [21] and in non-urban areas [20] highlighted VP as a major causal factor in changes to physical and chemical properties of soil.
In addition to the feedbacks between urbanization and VP, such factors as spatial heterogeneity and temporal dynamics determine the status of soil in urban parks. High heterogeneity of urban soil on the city scale was attributed to the existence of various land-use units [e.g., 6,24-26]. References [15,22,23] found that VP affected the variability of soil properties.
Studies of soil heterogeneity in urban parks were very rare [14,27], and the soil dynamics in urban parks has virtually not been studied on a seasonal scale. We hypothesized that the level of visitors’ pressure affects not only soil properties, but also their spatial and temporal dynamics.
The objective of the present study was to investigate the effects of season, visitors’ pressure and soil depth on the spatial variability of soil properties.
2. Study Area
The research was conducted in a municipal park in southern Tel-Aviv (Israel). Tel-Aviv, with a population of approximately 358,800 people occupying a 51.76 km2 area of municipal jurisdiction, is located on the Mediterranean coastal area, on sandy calcareous soils with a predominance of Typic Xerochrept (locally known as “Hamra”). This soil is characterized by low organic matter content (<1%), slightly acidic to neutral pH (7 - 8), and low CEC (up to 4 meq per 100 g soil), with predominance of sand (>90%) and negligible contents of clay (≤5%) and silt (<4%) [28].
The climate is Mediterranean, with mean annual precipitation of 530 mm, and average monthly temperatures range from 30.2˚C (August) to 9.6˚C (January).
This municipal park (Begin park) was established in 1970 on an area of about 50 ha (500 dunam). It provides various installations for children’s games, barbecues, and weekday and weekend outdoors recreation, for citizens from nearby neighborhoods and from other districts of the city.
3. Methods
For the present study the park was divided into three areas, according to the level of visitors’ pressure (VP): a “Control” area at the periphery of the park, practically free of VP; and areas with “Low” and “High” VP. The level of VP was assessed according to field evidence of trampling, such as loss of vegetation cover and loss of litter [14].
Soil sampling was carried out twice yearly: in March (wet season) and in July (dry season). In each season 67 points were randomly chosen: 14 each in “Control” and “High”, and 39 in “Low”. At each point soil samples were taken from two layers: 0 - 2 cm and 5 - 10 cm.
In all soil samples the following properties were determined: soil moisture, by gravimetric methods; soil organic matter content, by the wet combustion dichromate method [29]; pH, EC, and of soluble ion concentrations were determined in a 1:1 water extraction. Concentrations of Ca2+ and Mg2+ were determined with an atomic absorption spectrophotometer; Na+ and K+ concentrations were measured with a flame photometer; Cl− and  concentrations by titration with AgNO3 and H2SO4, respectively. Soil penetration depth was measured by driving a stick into the soil by dropping a 235 g weight 50 cm vertically onto its top [30].
Differences between means were subjected to Duncan’s Multiple Range Test at α = 0.05 significance level, and to Fisher’s comparison of variances test at α = 0.05. The significance of correlations between different characteristics was determined according to the Pearson coefficient.
4. Results
4.1. The Temporal and Spatial Dynamics of Averages
The averages of the various soil properties, as measured in the three areas of differing VP (“Control”, “Low” and “High”), in March and July, for two soil depths, are presented in Figure 1 and Table 1.
It was found that penetration depth decreased significantly as VP increased. In both months organic matter content increased significantly with increasing VP, and decreased significantly with increasing depth. There were no season-related changes in organic matter any level of VP at either depth.
Soil moisture was not consistently related to increasing VP. In March, soil moisture was significantly ~10% higher than in July, and this was true for both depths and for all levels of VP. In July soil moisture was higher at the lower depth.
Values of pH remained within a narrow range of ~7.5 - 7.8, with no relationships to VP, depth, or season.
At both depths and in both seasons EC significantly increased with VP, and significantly decreased with increasing depth (except in one case). The highest EC was found in July.
The Ca concentration did not change consistently with increasing VP: in both seasons and at all levels of VP, the Ca content at the shallower depth was significantly higher than at the deeper one. In July the Ca content at both depths was significantly higher in the “Control” and “Low” areas than in the “High” area.

Figure 1. Averages of soil properties at different levels of visitors’ pressure for each depth and season. C = “Control”, L = “Low”, H = “High”; d = depth of soil (1 or 2 = 0 - 2 and 5 - 10 cm, respectively); t = time (1 = March, 2 = July); EC= electrical conductivity (dS/m); OM = soil organic matter (%); SM = soil moisture (%); PD = penetration depth (cm); Ca, Mg, Na, K, Cl contents are expressed in meq/kg.
In the shallowersoil depth concentrations of all other soluble ions (Na, K, Mg, Cl) increased significantly with increasing VP, in both seasons. In the deeper soil depth, a similar trend was found for Na, Cl and K. In July the contents of all ions except K were significantly higher at the shallower depth than at the deeper one; at the shallower depth the highest contents of soluble ions, except K were found in July.
Table 1 shows that significant differences between averages of “Control” and “High” level of VP were found in 74% of cases (14 out of 19) at the shallower depth and in 50% of cases (9 out of 18) at the deeper depth.

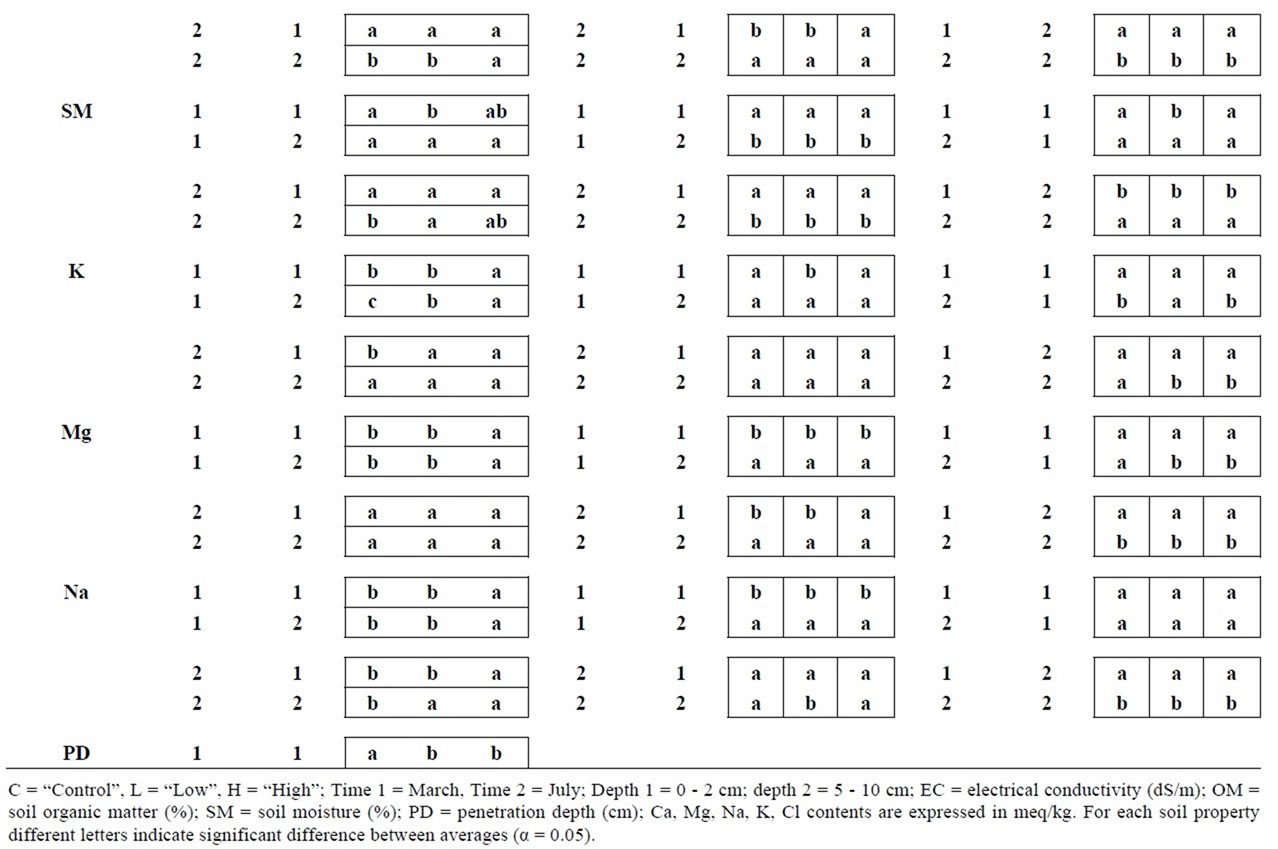
Table 1. Averages of soil properties for different visitors’ pressure (a); seasons (b); and soil depth (c).
At the shallower depth average values of soil properties in March and in July were significantly different in 55% of cases (5 out of 9), whereas at the deeper depth this applied in only 11% of cases (1 out of 9).
Differences between the depths, at all levels of VP, were found in 22% (2 out of 9) and in 78% (7 out of 9) of cases in March and July, respectively.
4.2. Variability of Soil Properties
At both depths and in both seasons, in most cases (24 out of 37) the variance of soil properties significantly increased as VP increased. In the remaining cases (13 out of 37) the variance did not change significantly (Table 2). The between-seasons differences in variances at each depth were inconsistent for all levels of VP (Table 3).
Only the variance of soil moisture decreased significantly from March to July at both soil depths and at all levels of VP. Conversely, for Cl, the variance increased significantly from March to July.
The coefficients of variation (CV) of the soil properties were spread over a wide range (from ~2 to ~255%) and in most cases (30 out of 37) increased with increasing VP (Figure 2, Table 4). The highest CVs were found for K, Cl and Na contents, and for EC.
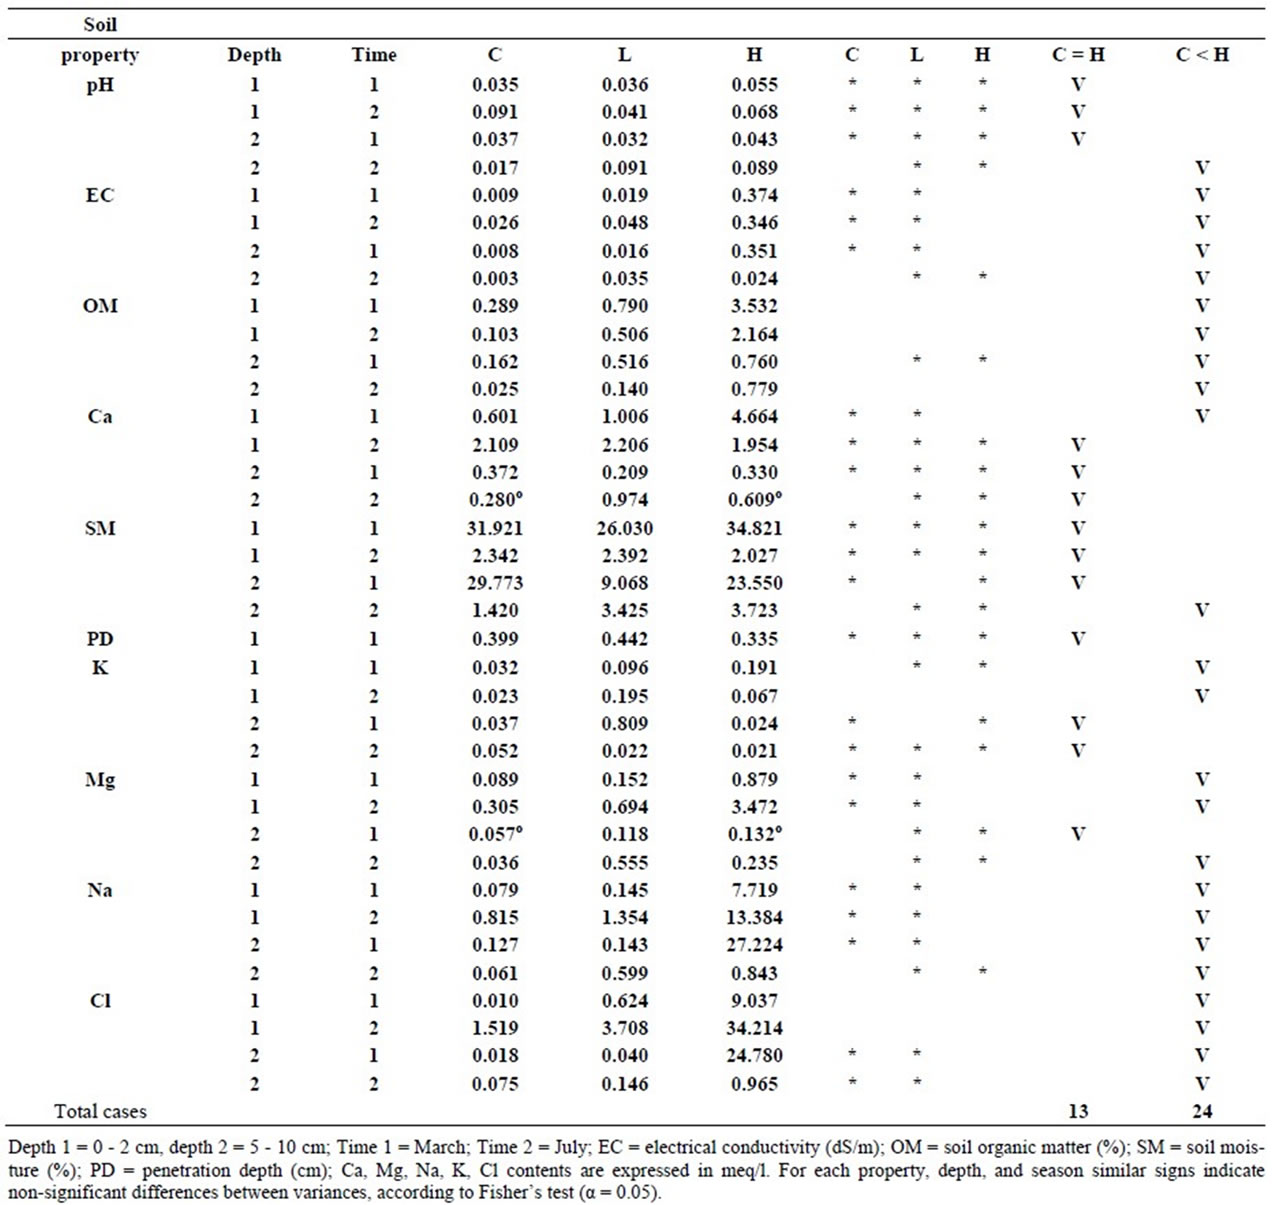
Table 2. Variances of soil properties for the three levels of visitors’ pressure (C = control, L = low, H = high) in each season and at each depth.

Table 3. Change in variance of soil properties between the seasons for the same depth and visitors’ pressure level.

Figure 2. The ratio between coefficients of variation of various soil properties under high visitors’ pressure level (CVHigh) and those under control (CVCont) at each depth and in each season. d = depth of soil (1 or 2 = 0 - 2 and 5 - 10 cm, respectively); t = time (1 = March, 2 = July); EC = electrical conductivity (dS/m); OM = soil organic matter (%); SM = soil moisture (%); PD = penetration depth (cm); Ca, Mg, Na, K, Cl contents are expressed in meq/kg.
The greatest increase of CV with increasing VP was found for Cl (8.6- to 9.4-fold) (Figure 2); those for EC, Na (at deeper depth in March) and organic matter (at deeper depth in July) increased ~2.7- to 3.7-fold, as VP increased. Conversely, for K the lowest CVs were found in “High” (except in one case), where it was lower than that in “Control” by a factor of ~2 - 3.
The lowest CVs were found for pH (1.66% - 4.03%), and they did not change with depth, season or VP.
5. Discussion
5.1. The Effect of Visitors’ Pressure on the Averages of Soil Properties
Studied soil properties were divided into two groups according to their sensitivity to VP: a) noticeably affected (penetration depth, organic matter content and most of the soluble ions); and b) negligibly affected (soil moisture, pH and Ca) (Figure 1, Table 1, a).
Penetration depth, as expected, was significantly increased as a result of VP [17,31]. Furthermore, the fact that penetration depth in “Low” was significantly lower than that in “Control” but similar to that in “High” means that the soil surface in most of the park area was overcompacted.
Soil organic matter content is a very sensitive indicator of VP [12,16]. For urban soil, it was shown that trampling decreased organic matter content by a factor of 2.5 3 - 11). The opposite trend, i.e., soil organic matterincreasing with increasing VP, that was found in our present study resulted from anthropogenic factors such as food remains, cats’ excrement and, elemental carbon from ashes/charcoal of grills or barbecues [24,25,32]. These factors also accounted for the higher soil organic matter in “Low” than in “Control” areas.
The increases in concentrations of soluble ions (Na, K, Mg, Cl) in the shallower soil depth as VP increased is attributed to a similar complex of anthropogenic factors to that which controlled organic matter content. Additionally, more-compacted soil was characterized by accumulation of soluble ions at the surface, transported by capillary rising of soil water in this compacted soil, because of evaporation.
The EC showed the same tendency as soluble ion concentrations [3], and also increased significantly as VP increased.
In the present study soil moisture, pH and Ca were not affected consistently by VP, but some previous studies found that soil moisture decreased as VP increased [15-17]. The same phenomenon was described for parks with sandy soil covered with litter and rich in organic matter [17,31]. The finding of lack of consistency of changes in SM with changing VP in the present study matches the findings of [22,23], who found that VP did
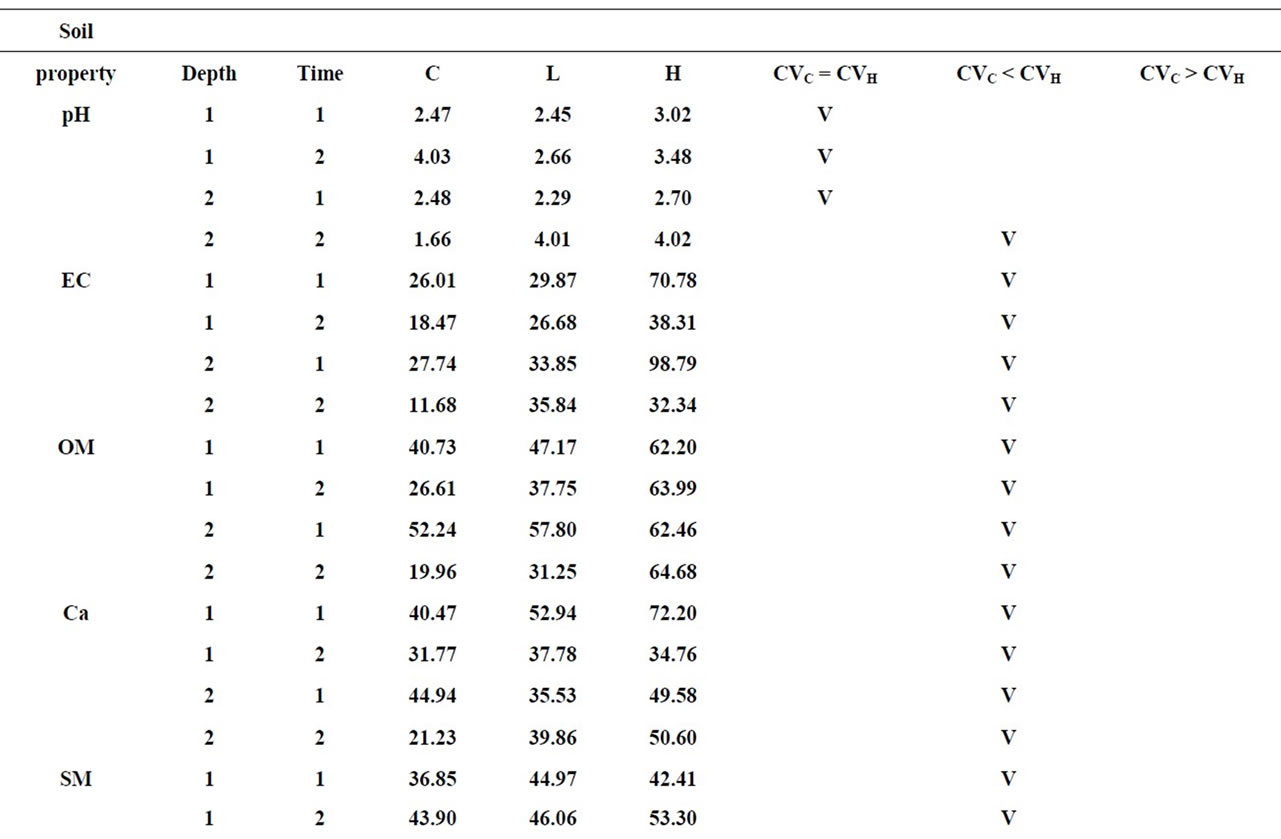
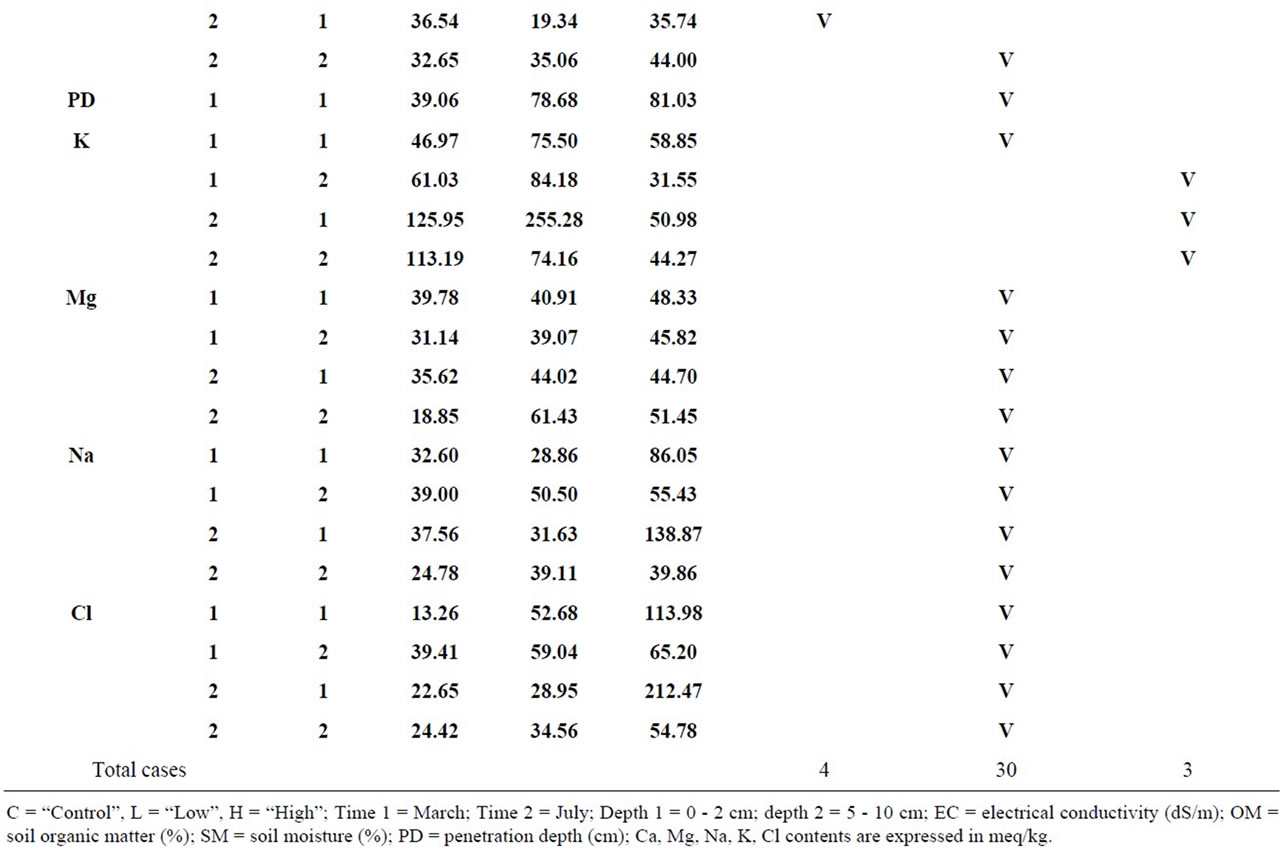
Table 4. Coefficients of variation of soil properties for each visitors’ pressure level, depth and season.
not affect soil moisture at all. This can be attributed to the sandy texture, absence of litter biomass, and low organic matter content in the studied park; all these lead to low water-holding capability in the soil [20].
We found no differences in pH among areas of differing VP, with negligible deviation (~0.3 units of pH). In contrast, previous studies found that pH increased with increasing VP [12,17]. We attributed this phenomenon mainly to control by urban dust and building materials— rich in CaCO3—which alkalinized the soil [19], and to the fact that in all areas of the park and are subjected to the same soil washing.
Urbanization leads to accumulation of Ca in the soil [19]. Whereas in the “Control” and “Low” areas Ca in the topsoil increased from March to July, it did not change in the “High” area. This is attributed to leaching of the compacted soil of the “High” area being less than that in the other areas, so that Ca did not change between the seasons in the former. The hot temperature in the summer enhanced the evaporation, resulting in increased Ca and “smoothing” the difference in Ca between areas subjected to differing VP.
The effect of VP diminished with depth because the soil at the shallower depth directly receives the trampling pressure whereas that at the lower depth is more protected. This is consistent with [33].
5.2. Seasonal Dynamics of Soil Properties
As a result of evaporation, EC and the contents of Na, Mg, Ca and Cl increased in July, in most cases significantly, and soil moisture decreased, especially at the shallower depth, for all VP levels (Figure 1, Table 1, b). Similar results were obtained in studies conducted in rural areas [34,35].
The organic matter content was completely controlled by VP at both depths and in both seasons; it did not change with season in the urban park, because of the low rates of mineralization and litter decomposition in sandy soils.
The predominance of the effect of urbanization, i.e., additional construction materials, rich in CaCO3, neutralized the seasonal changes of pH.
The seasonal changes were more pronounced at the shallower than at the deeper depth. The trends of seasonal changes of the above soil properties in the studied urban park also were found in non-urban areas [33,35]. This highlights the high significance of seasonal conditions that affect the soil water regime that, in turn, generates soil regulation and development of the Mediterranean soils in both urban and rural areas.
5.3. Changes of Soil Properties with Depth
The organic matter and Ca contents decreased significantly with depth, in both seasons and for all VP levels (Figure 1, Table 1, c). For organic matter this resulted from a combination of the natural decrease of organic matter with increasing depth and the anthropogenic additions to the soil surface. The anthropogenic effect was especially strong in the “Low” and “High” areas and enhanced the differentiation in organic matter between the soil depths. Anthropogenic additions explain the high Ca in the deeper soil layer.
The capillary rise of ions in the dry season led to their accumulation at the surface and enhanced the between depths differentiation in Na, Mg, Cl contents. In the wet season leaching occurs at both depths, therefore the differences between the depths became smaller.
The soil moisture content increased with increasing depth only in summer, because the upper soil layer was subject to direct exposure to and evaporative loss of moisture, whereas the deeper layer was protected by the upper layer. Even low and similar averages of soil moisture content were significantly different between the depths for all types of VP in July.
An inconsistent trend of pH with depth was found in urban soil by [10,24], which is consistent with the present finding of negligible and inconsistent differences of pH between two depths.
5.4. Variability of Soil Properties
Whereas most previous studies addressed the trampling effect of VP on average (Avg) and variance (Var) of soil properties [15,17,31], our present study also examined the effects of trampling and other visitor activities on the soil.
The changes of Var with VP for all soil properties (Table 2) indicated the existence of two groups: the first group (comprising organic matter, EC, Na, Cl and Mg contents) was characterized by increasing of Var with increasing VP; and a second one (comprising soil moisture, Ca, pH and penetration depth), in which Var was not affected or inconsistently affected by VP.
The increase of Var with increasing VP level is explained by the analysis of percentiles, which reflect the data population structure (Figure 3). In the first group the inter-decile interval increased as VP level increased from “Control” to “High”, mainly as a result of the increase of the high values (high deciles). A similar, but less distinct trend was found for the deeper soil depth. Reference [27] also found that the maximum values of soil properties such as organic matter content, soil moisture, litter biomass and penetration depth changed more sharply than the minimum ones, which means that maximum values were found to be more sensitive to VP than minimum ones. In the previous studies [15,17,31] increased trampling was accompanied by decreases of

Figure 3. Deciles of soil properties for different levels of visitors’ pressure at depth 1 for each season. C = “Control”, L = “Low”, H = “High”; t = time (1 = March, 2 = July). EC = electrical conductivity (dS/m); OM = soil organic matter (%); SM = soil moisture (%); PD = penetration depth (cm); Ca, Mg, Na, K, Cl contents are expressed in meq/kg.
both averages and inter-decile intervals. In the present study, the averages and Var of the first group increased with increasing VP as a result of other anthropogenic factors (see paragraph 5.1) in addition to trampling. The rates of change of soil properties (decrease or increase) with VP were sharper for high values than for low ones, under both of the above opposite trends, which indicates that higher values were more affected by VP than lower ones. Furthermore, the “faster” increase of the highest deciles than of the lower ones is evidence of the anthropogenic contributions in separate spots (points) that characterized the spatial distribution of the first group of soil properties.
The stability of averages and Var of the second group of properties coincides with the smaller variability of inter-decile intervals (Figure 3), that highlighted the “frontal”/homogeneous mechanism which was responseble for the spatial organization of these properties.
Generally, CV increased with increasing VP for both seasons and at both depths (Table 4, Figure 3), as found also [27]: the CV of Cl increased by up to about eightfold, and those of Na and EC by up to about 3.7-fold. These increases were associated with the anthropogenic sources of these ions and their irregular, “spotty” spatial distribution.
The homogeneous spatial distribution of the input of urban dust in this area can account for the low and similar CVs of pH and Ca in areas with differing VP levels.
5.5. The Evaluation of Sensitivity
The evaluation of sensitivity of soil properties to VP, season and soil depth is summarized in Table 5. We used a five-grade scale to characterize the degree of dependence between factors (VP, season and depth) and average values of properties. We found the influence of VP was strongest for organic matter, penetration depth and sodium content. The seasons (March and July) were the most significant factor for soil moisture. The depth affected soil properties, especially the organic matter and calcium contents.
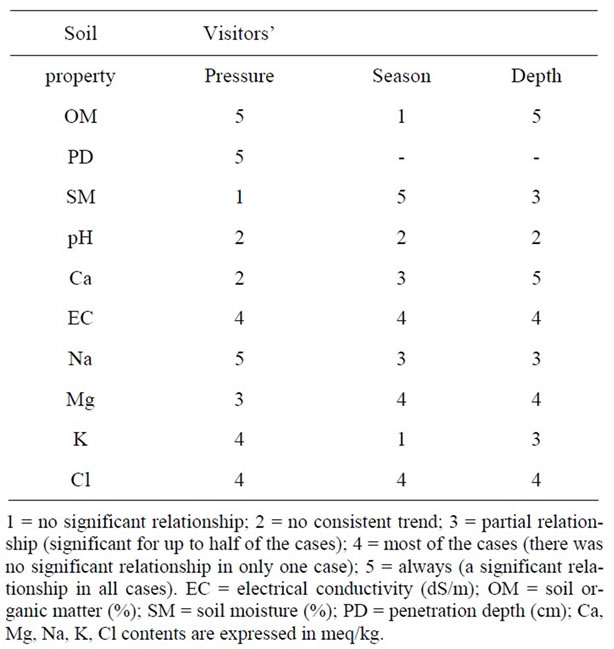
Table 5. Evaluation of factors (visitors’ pressure, season and soil depth) affecting the averages of soil properties.
5.6. Integrated Analysis of Soil Properties
5.6.1. Evaluation of Soil Degradation
Degradation of soil status under VP was evaluated from the differences between the average values of each property under “High” and “Control” VP levels in each season, relative to its average value in “Control” in March:


where: RD = Relative Degradation; Avg = average; Pi = soil property; H = “High” level of VP; C = “Control”; m = March; j = July.
The relations between the degradation of all soil properties together in March and that in July (Figure 4(a)) showed a highly significant positive correlation. The inclination of the regression curve towards the July Y-axis shows that soil degradation in July was 2.44 times greater than that in March.
From the practical point of view our findings highlight the importance of restricting recreational activity in urban parks in Mediterranean areas in summer.
5.6.2. Evaluation of Dynamics Intensity
The dynamics intensity (DI) was evaluated for different levels of VP for all the studied soil properties separately as:


in which: DIC , DIH and DIL represent the dynamic intensity of “Control”, “High” and “Low” levels of VP, respectively; Avg PiCj and Avg PiCm = average of specific soil property (Pi) in “Control” (C), in July (j) and March (m), respectively; Avg PiHj and Avg PiHm = average of specific soil property (Pi), in areas of “High” VP level (H) in July (j) and March (m) respectively; Avg PiLj and Avg PiLm = average of specific soil property (Pi) in areas of “Low” VP level (L) in July (j) and March (m), respecttively.
The dynamic intensity, for all studied soil properties together increased with increasing VP and showed a high linear positive correlation (Figure 4(b)), which not only expressed a high dependence between the soil status and VP, but also showed that increasing VP was accompanied by increasing temporal changes.
6. Conclusions
The urban soil was affected by both natural and anthropogenic factors simultaneously, as reflected in the effects
 (a)
(a)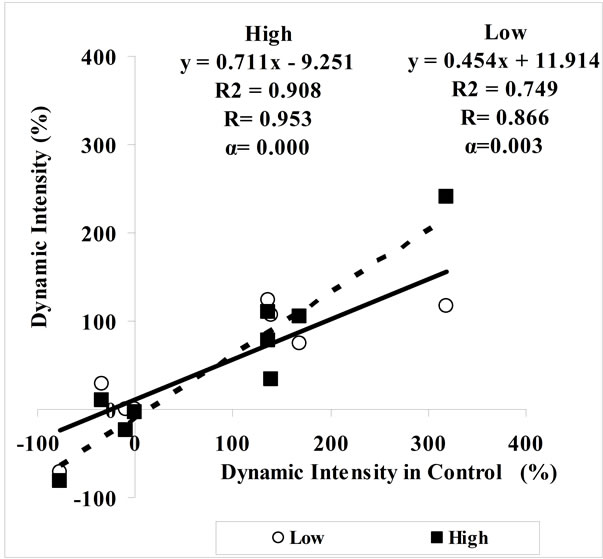 (b)
(b)
Figure 4. Relative degradation (a) and dynamic intensity (b) at “Low” and “High” levels of visitors’ pressure.
of visitors’ pressure, season, and depth, on the development of soil status in the urban park. The effect of visitors’ pressure was characterized by changes in the average values of soil properties and in their temporal and spatial heterogeneity.
A strong influence of visitors’ pressure was found on organic matter content, penetration depth and Na. The soil moisture showed the greatest dependence on seasonal dynamics, and the effect of depth was highly expressed in organic matter and Ca contents.
Since, the organic matter content at both depths and in both seasons was completely controlled by visitors’ pressure, it can be used as an indicator of soil status in recreation areas.
Some soil properties (organic matter, Na, K, Mg, Cl) exhibited a “spotty” pattern, whereas others (Ca, soil moisture, penetration depth) exhibited a “frontal” one as a result of the type of spatial distribution of the dominant anthropogenic additions.
The soil at the shallower depth was more sensitive to visitors’ pressure and seasonal changes than the deeper layer, and the differences in soil properties between the depths were greater in the dry season (July) than in the wet one (March).
Our study showed an increase in the intensity and spatial heterogeneity of soil properties as a result of visitors’ pressure activities, e.g., trampling, food remnants, cats’ excrement and, ashes/charcoal. In other studies trampling was the dominant element of visitors’ pressure, and it led to an opposite trend.
Evaluation of the intensity of soil degradation and dynamics highlighted the great importance of anthropogenic pressure, which influenced the soil status in this urban park.
The soil degradation under visitors’ pressure was more strongly expressed in the dry season, and the temporal changes of the soil increased with increasing visitors’ pressure.
Thus, increased disturbance by visitors’ pressure leads to increases in spatial heterogeneity and in seasonal changes of soil properties.
From the practical point of view our findings highlight the importance of restricting recreational activities in urban parks in Mediterranean areas in the summer.
REFERENCES
- A. Chiesura, “The Role of Urban Parks for the Sustainable City,” Landscape and Urban Planning, Vol. 68, No. 1, 2004, pp. 129-138. doi:10.1016/j.landurbplan.2003.08.003
- C. Y. Jim and W. Y. Chen, “Recreation-Amenity Use and Contingent Valuation of Urban Green Spaces in Guangzhou, China,” Landscape and Urban Planning, Vol. 75, No. 1-2, 2006, pp. 81-96. doi:10.1016/j.landurbplan.2004.08.008
- H. Sukopp, “Human-Caused Impact on Preserved Vegetation,” Landscape and Urban Planning, Vol. 68, No. 4, 2004, pp. 347-355. doi:10.1016/S0169-2046(03)00152-X
- M. J. McDonnell and S. T. A. Pickett, “Ecosystem Structure and Function along Urban-Rural Gradients: An Unexploited Opportunity for Ecology,” Ecology, Vol. 71, No. 4, 1990, pp. 1232-1237. doi:10.2307/1938259
- W. R. Effland and R. V. Pouyat, “The Genesis, Classification, and Mapping of Soil in Urban Areas,” Urban Ecosystems, Vol. 1, No. 4, 1997, pp. 217-228. doi:10.1023/A:1018535813797
- R. Pouyat, P. Groffman, I. Yesilonis and L. Hernandez, “Soil Carbon Pools and Fluxes in Urban Ecosystems,” Environmental Pollution, Vol. 116, No. 1, 2002, pp. S107- S118. doi:10.1016/S0269-7491(01)00263-9
- B. C. Scharenbroch, J. E. Lloyd and J. L. Johnson-Maynard, “Distinguishing Urban Soils With Physical, Chemical and Biological Properties,” Pedobiologia, Vol. 49, No. 1, 2005, pp. 283-296. doi:10.1016/j.pedobi.2004.12.002
- W.-X., Zhu and M. M. Carriero, “Chemoautotrophic Nitrification in Acidic Forest Soils along an Urban to Rural Transect,” Soil Biology and Biochemistry, Vol. 31, No. 8, 1999, pp. 1091-1100. doi:10.1016/S0038-0717(99)00025-5
- H. P. Blume, “Characteristics of Urban Soils,” Publication of German National Committee of UNESCO Program “Man and Biosphere”, Vol. 30, Berlin, 1989, pp. 23-46.
- U. Schleus, W. Qinglan and H. P. Blume, “Variability of Soils in Urban and Periurban Areas in Northen Germany,” Catena, Vol. 33, No. 3-4, 1998, pp. 255-270. doi:10.1016/S0341-8162(98)00070-8
- E. M. Zheveleva, M. E. Ignatjeva and D. N. Kavtaradze, “Soil and the Problem of Urban Plant Community Formation in the ‘Ecopolis’, Town Poushchino, Moscow Region,” Publication of German National Committee of UNESCO Program “Man and Biosphere”, Vol. 30, Berlin, 1989, pp. 47-57.
- M. Andres-Abellan, J. B. Del Alamo, T. Landete-Castillejos, F. R. Lopez-Serrano, F. A. Garcia-Morote and A. Del Cerro-Barja, “Impact of Visitors on Soil and Vegetation of the Recreational Area ‘Nachimiento Del Rio Mundo’ (Castilla-La Mancha, Spain),” Environmental Monitoring and Assessment, Vol. 101, 2005, pp. 55-67.
- C. Y. Jim, “Trampling Impacts of Recreationists on Picnic Sites in a Hong Kong Country Park,” Environmental Conservation, Vol. 14, No. 2, 1987, pp. 117-127. doi:10.1017/S0376892900011462
- C. Y. Jim, “Soil Characteristics and Management in Urban Park in Hong Kong,” Environmental Management, Vol. 22, No. 5, 1998, pp. 683-695. doi:10.1007/s002679900139
- P. Kutiel and H. Zhevelev, “Recreational Use Impact on Soil and Vegetation at Picnic Sites in Aleppo Pine Forest on Mt. Carmel. Israel,” Israel Journal of Plant Sciences, Vol. 49, No. 1, 2001, pp. 49-56. doi:10.1560/G2L1-8U80-5XNQ-G38C
- A. D. Dotzenko, N. T. Papamichos and D. S. Romine, “Effect of Recreational Use on Soil Moisture Conditions in Rocky Mountain National Park,” Journal of Soil Water Conservation, Vol. 22, 1967, pp. 196-197.
- P. Kutiel, H. Zhevelev and H. Lavee, “Coastal Dune Ecosystems: Management for Conservation Objective. III. Soil Response to Three Vegetation Types to Recreational Use,” Journal of Mediterranean Ecology, Vol. 1, 2000, pp. 171-179.
- E. I. Alexandrovskaya and A. L. Alexandrovskiy, “History of the Cultural Layer in Moscow and Accumulation of Anthropogenic Substances in it,” Catena, Vol. 41, No. 1-3, 2000, pp 249-259. doi:10.1016/S0341-8162(00)00107-7
- H. Sukopp, H. P. Blume and W. Kunick, “The Soil, Flora and Vegetation of Berlin’s Waste Lands,” In: I. C. Laurie, Ed., Nature in Cities, Chichester, New York, 1979, pp. 115-131.
- F. R. Kuss, “A Review of Major Factors Influencing Plant Responses to Recreation Impacts,” Environmental Management, Vol. 10, No. 5, 1986, pp. 637-650. doi:10.1007/BF01866768
- C. Y. Jim, “Soil Compaction as a Constraint to Tree Growth in Tropical and Subtropical Urban Habitats,” Environmental Conservation, Vol. 20, No. 1, 1993, pp. 35- 49. doi:10.1017/S0376892900037206
- M. J. Liddle and P. Greig-Smith, “A Survey of Tracks and Paths in a Sand Dune Ecosystem. I. Soils,” Journal of Applied Ecology, Vol. 12, No. 3, 1975, pp. 893-908. doi:10.2307/2402097
- J. L. Marion and D. N. Cole, “Spatial and Temporal Variation in Soil and Vegetation Impacts on Campsites,” Ecological Applications, Vol. 6, No. 2, 1996, pp. 520-530. doi:10.2307/2269388
- L. Beyer, P. Kahle, H. Kretschmer and Q. Wu, “Soil Organic Matter Composition of Man-Impacted Urban Sites in North Germany,” Journal of Plant Nutrition and Soil Science, Vol. 164, No. 4, 2001, pp. 359-364.
- K. Lorenz and E. Kandeler, “Biochemical Characterization of Urban Soil Profiles from Stuttgart, Germany,” Soil Biology and Biochemistry, Vol. 37, No. 7, 2005, pp. 1373- 1385. doi:10.1016/j.soilbio.2004.12.009
- Y.-G. Zhao, G.-L. Zhang, H. Zepp and J.-L. Yang, “Establishing a Spatial Grouping Base for Surface Soil Properties Along Urban-Rural Gradient—A Case Study in Nanjing, China,” Catena, Vol. 69, No. 1, 2007, pp. 74-81. doi:10.1016/j.catena.2006.04.017
- H. M. Zhevelev and P. Sarah, “The Effect of Visitors’ Pressure on the Spatial Variability of Sandy Soil in an Urban Park in Tel-Aviv,” Environmental Monitoring and Assessment, Vol. 142, No. 1-3, 2008, pp. 35-46. doi:10.1007/s10661-007-9906-9
- H. Koyumdjisky, J. Dan, S. Soriano and S. Nisim, “Selected Soils Profiles from Israeli Soils. ARO,” The Volcani Centre, Bet Dagan, 1988.
- D. L. Rowell, “Soil Science: Methods and Application,” Longman Scientific and Technical, New York, 1994.
- L. O. Karpachevsky, A. D. Voronin, E. A. Demitriev, M. N. Stroganova and S. A. Shoba, “Soil and Biogeocenological Research in Forest Ecosystems,” Moscow State University, Moscow, 1980.
- P. Sarah and H. M. Zhevelev, “Effect of Visitors’ Pressure on Soil and Vegetation in Several Different MicroEnvironments in Urban Parks,” Landscape and Urban Planning, 83, Vol. 83, No. 4, 2007, pp. 284-293. doi:10.1016/j.landurbplan.2007.05.001
- K. Lorenz, C. M. Preston and E. Kandeler, “Soil Organic Matter in Urban Soils: Estimation of Elemental Carbon by Thermal Oxidation and Characterization of Organic Matter by Solid-State 13C Nuclear Magnetic Resonance (NMR) Spectroscopy,” Geoderma, Vol. 130, No. 3-4, 2006, pp. 312-323. doi:10.1016/j.geoderma.2005.02.004
- S. Zwikel, H. Lavee and P. Sarah, “Temporal Evolution of Salts in Mediterranean Soils Transect Under Different Climatic Condition,” Catena, Vol. 70, No. 3, 2007, pp. 282-295. doi:10.1016/j.catena.2006.09.004
- P. Sarah, “Soluble Salts Dynamics in the Soil under Different Climatic Conditions,” Catena, Vol. 43, No. 4, 2001, pp. 307-321. doi:10.1016/S0341-8162(00)00130-2
- D. R. Bhuju and M. Ohsawa, “Effects of Nature Trails on Ground Vegetation and Understory Colonization of a Patchy Remnant Forest in an Urban Domain,” Biological Conservation, Vol. 85, No. 1-2, 1998, pp. 123-135. doi:10.1016/S0006-3207(97)00148-1