Journal of Environmental Protection
Vol.4 No.5(2013), Article ID:31418,8 pages DOI:10.4236/jep.2013.45053
Effectiveness of Air Sparging Technology in Remediation of Gaza Coastal Aquifer from Gasoline Products
![]()
Environmental Engineering Department, Islamic University of Gaza, Gaza, Palestine.
Email: *sghabayen@iugaza.edu.ps
Copyright © 2013 Said Ghabayen et al. This is an open access article distributed under the Creative Commons Attribution License, which permits unrestricted use, distribution, and reproduction in any medium, provided the original work is properly cited.
Received February 15th, 2013; revised March 16th, 2013; accepted April 14th, 2013
Keywords: Hydrocarbons; Air Sparging; Gaza Aquifer; Monitoring; Total Organic Carbon
ABSTRACT
Groundwater contamination becomes a great concern in many countries. One of the most important pollutants is hydrocarbons. Sources of Hydrocarbons pollutants in Gaza can be a result of accidental spills of petroleum products on the surface and uncontrolled disposal of wastewater. One of the common technologies for groundwater aquifer remediation from hydrocarbons is known as air sparging. In this study, a 120 cm × 100 cm × 80 cm laboratory scale aquifer model was implemented in order to investigate the effectiveness of air sparging technology in removal of petroleum products from contaminated site. Four pilot scale wells were installed at different depths and different spatial distribution. The central well was used for injecting air and the surrounding three wells were used for monitoring. The contaminated water and soil were tested for total organic carbon, lead, dissolved Oxygen and pH; one time before the start of treatment and four times through the treatment process. Total organic carbon in water and soil before air injection were 980 ppm and 0.08775 ppm, respectively. After air injection for three weeks (six hours daily) at flow rate range from 15 to 20 L/min and at pressure range from 300 to 400 kPa, the concentration of pollutant was decreased to 4.0 ppm and 0.0 ppm in water and soil, respectively. Based on the results, it was clearly demonstrated that air sparging is a simple, effective and affordable technology that can be applied for Gaza aquifer remediation in case of gasoline spill accidents.
1. Introduction
In the last decades, world has experienced various types of environmental pollution. Part of them had been generated from the use of natural resources such as petroleum. Hydrocarbons compounds are the main component of petroleum products. They are organic compounds contain one or more aromatic rings of hydrogen and carbons, which can appear in every aspect of our lives. Petroleum products comprise 80% of world’s energy consumption.
Hydrocarbons compounds come into the environment spatially water system either accidently through spills from pipeline, refineries and storage tanks or actively such as uncontrolled disposal of wastewater and Industrial discharge into water system [1].
The remediation of groundwater from petroleum hydrocarbons is possible by several remediation technologies, such as soil vapor extraction, pump and treat, air sparging and other techniques.
Air sparging becomes one of the most implemented and popular removal technologies since it was implemented for the first time in Germany in 1985. Air sparging is a relatively simple and effective in situ treatment technology based on injection clean pressurized air or potentially other gases to remove volatile organic carbon (VOC) and semi volatile organic carbon (SVOC) in addition to biodegradable contaminants from the saturated zone [2]. The treatment is based on converting solvents and gasoline from the dissolved phase to the vapor phase through air stripping. The dissolved VOCs or SVOCs absorbed by soil particles tend to volatilize and migrate to the vadose zone. Then a soil vapor extraction (SVE) system can be used to recover the volatilized contaminants from the vadose zone before it can migrate to enclosed spaces [3].
It consists at least of one air injection well connected to compressor and vapor extraction system may be installed [4]. Its technique relies on two processes: volatilization of contaminants into gas phase and dissolution of oxygen that increase biodegradation of contaminants [5] to provide detail understanding for techniques and to identify any factors to be addressed in full-scale design usually pilot scales are used. From this point, a small scale simulation for air sparging remediation technology was built.
Most studies reported that air sparging basic concept involves injection of air through wells into aquifer in order to volatiles contaminant that immigrates upward into unsaturated zone [6-8]. Also when air is injected, oxygen can be dissolved that can increase biodegradation of contaminants [5]. It was agreed that air sparging is an efficient and economical method for groundwater contamination from hydrocarbons [9]. For air sparging pilot design user must consider air permeability and preferential flow pathways, region of influence and operation parameter (flow rate and pressure).
Several physical and numerical models were experienced under specific condition. Ji et al. [6] and Lundegard and Andersen [10] have studied fluids behavior during sparging. Laboratory test using Plexiglas tank filled with glass beads (0.2 to 4.0 mm in size) was performed by Ji et al. [6] to understand air flow behavior. Through high quality photography show that flow plum is affected by grain size as for large grain size air travels as discrete and for small one air travels as discrete. Lundegard and Andersen [10] show through their multiphase numerical model which involves movement of air, water, and liquid hydrocarbon at different injection scenarios (pressure, flow rate, depth) that flow behavior past through three stages 1) expansion stage 2) collapse stage and 3) steady state. Plummer et al. [11] worked on which is more efficient; vertical or horizontal injection well. His study was conducted using lexan tank and two types of soil (sand and glass) were tested for both vertical and horizontal wells. He proved that horizontal well is more efficient than vertical as it result in more uniform air distribution.
Three-dimensional laboratory test was conducted by Hein et al. [12] at cylindrical reactor. Semer et al. [13] performed another laboratory study. They all tried to investigate the effect of air flow and pressure changing on the radii of influence. Hein et al. [12] found that the influenced area slightly increase with increasing injection flow rate. Semer et al. [13] reported that pressure and flow rates have limiting value where further increase in one of them will not affect radii of influence, but additional channels will be created.
To study how changes in air injection rate and pulsing can affect removal rate, Johnson et al. [7] conducted two-dimensional aquifer packed with 1 diameter glass peads at two injection rate (1.25 and 10 L/min). They proved that by increasing in flow rate tend to increase air flow channels, which can lead to increase volatilization rate and improve the removal efficiency.
Although flow of fluids was studied by Ji et al. [6] and Lundegard and Andersen [10] air flow behavior was investigated by Mortensen et al. [5] at different air injection using different size of silica soil in laboratory column using MTBE tracer, which was simulated using T2VOC model. Result suggested that air was uniformly distribution in fine sand and discrete in coarser. They found the simulation was successful for fine sand but it was over predicted for coarser sand.
Another numerical model was developed to analyze specific air sparging parameter by Reddy and Adams [14], which reported that the radius of influence is presented by boundary of air flow and vertical expansion. Also they found that although areal extent of influence is represented in cone shape laboratory test indicate that it is parabolic shape.
Hu et al. [15] enhanced what Reddy and Adams [14] report but in another way. Series of physical modeling were tested for various media sizes under different injection pressure to investigate their effect on the size and shape of zone of influence (ZOI). It was performed in Plexiglas tank using different sizes of transparent Silica glass beads, air pressure was gradually increased until air bubbles appeared in samples. Using image of digital videos it was observed that ZOI expanded by increasing pressure which can be expressed by two aspects horizontal expansion and angle of the ZOI boundary. In addition, a linear relationship between pressure and flow rate was found; however, theoretical value of minimum injected pressure is higher than the measured value, while theoretical maximum injection pressure is much lower than the measured value.
2. Materials and Methods
2.1. Study Area
Gaza Strip is a part of Palestine about 365 km2, located on the south eastern coast of Mediterranean Sea, bordered on the south by Sinai desert, on the east by Naqab desert. Gaza Strip is located in the transitional zone between the arid desert climate of the Sinai in Egypt and the temperate and semi-humid Mediterranean climate along the coast. The Gaza Strip is one of the most densely populated areas in the world. For administrative purposes, the area has been divided into five regions: North, Gaza, Middle, Khan Younis and Rafah. Approximately 85% of the population of the Gaza Strip drink from municipal groundwater wells and 15%, mostly in agricultural areas, use private wells to supply their drinking water. The soil in the Gaza Strip is composed mainly of three types: sands, clay and loess. The sandy soil is found along the coastline extending from south to outside the northern border of the Strip, at the form of sand dunes. The thickness of sand fluctuates from two meters to about 50 meters due to the hilly shape of the dunes. Clay soil is found in the north eastern part of the Gaza Strip. Loess soil is found around Wadis, where the approximate thickness reaches about 25 to 30 m [16].
Sources of Hydrocarbons pollutants in Gaza can be a result of accidental spills of petroleum products on the surface and uncontrolled disposal of wastewater. Figure 1 shows a map for Gaza and the potential pollution sources locations.
2.2. Experimental Setup
Laboratory scale experiment was performed to quantify the efficiency and the effectiveness of air sparging technology and to identify any factors to be addressed in full-scale design as shown in Figure 2.
For the current experiment, the air sparging pilot system similar to that used by Johnson et al. [7] except this system is larger and it was used to study the removal efficiency of air sparging at constant flow rate and pressure. In addition, the system assumes some constant condition such as: the soil has uniform porosity; the saturated soil is homogenous; the saturated soil has uniform distribution of sparge air; the time consumed for hydrocarbon removal depends on injected air flow rate; the zone at which bubbles is appeared is defined as radius of influence; and the groundwater flow rate in the saturated zone is assumed to be 15 L/min (roughly calculated from the Gaza groundwater aquifer conditions).
In addition, the model assumes that hydrocarbon removal occur during immigration of volatile contaminant upward into unsaturated zone as another ways for hydrocarbon removal due to adsorption or biodegradation.
Three-dimensional physical experimental model was performed using a laboratory scale. The sparging tank used in the current study was constructed primarily from plastic with the dimensions of 120 cm wide, 100 cm high and 80 cm deep. In order to simulate the dynamic groundwater conditions, water was allowed to flow through inlet and outlet at similar Darcy flow as in the aquifer. The tank consists of two zones similar to that used by Plummer et al. [11]: 1) saturated zone with 70 cm high, referred to as the bottom section was filled with sandy soil (brought from a well drilling site) and 2) unsaturated zone with 20 cm high, referred to as the top section.
Air sparging experiment was conducted using sand media with physical and hydraulic sand properties as shown in Table 1.
Clayey packed material, 2 mm thickness, was used around the internal walls of the tank and to prevent unpreferred air paths between the aquifer material and the tank walls.
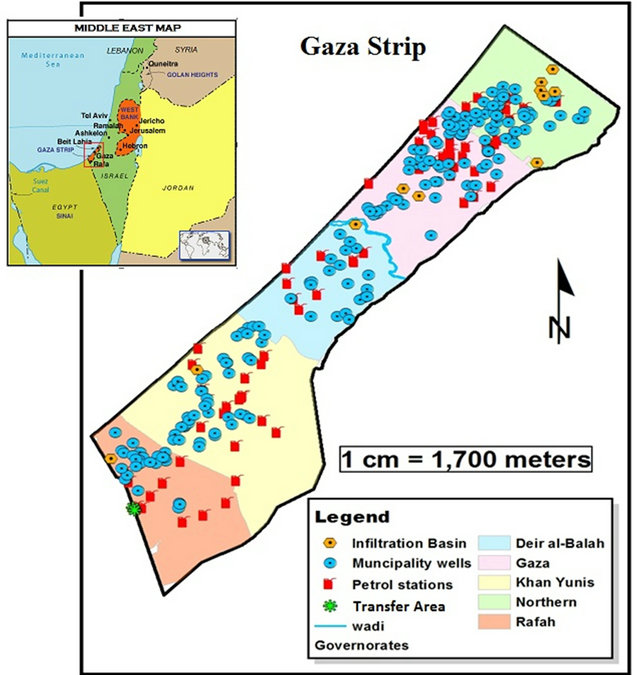
Figure 1. Sources of hydrocarbons’ pollution and location map of the Gaza Strip.
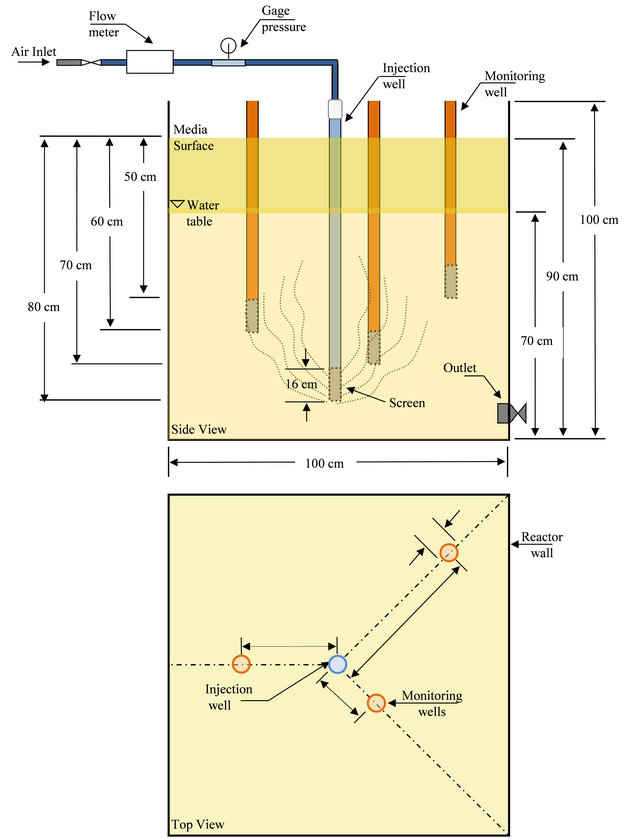
Figure 2. Experiment geometry and details.
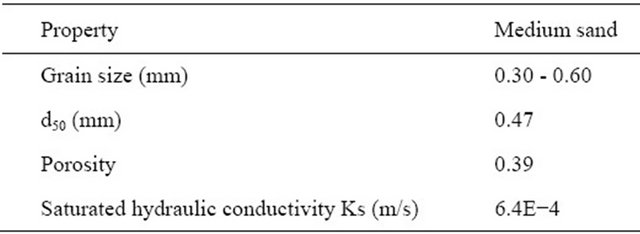
Table 1. Physical and hydraulic properties of used sand.
2.2.1. Air Injection Well
Vertical sparge well was constructed from 2.5 cm diameter Poly Vinyl Chloride (PVC) pipe. The lower 16 cm was perforated with holes of 4 mm diameter, which were warped with stainless steel mesh (well screen.). Gravel pack was used around the screen to prevent clogging. It was installed at the center of reactor 62 cm below the surface of target treatment zone.
2.2.2. Monitoring Network
The monitoring network in the experiment consists of: 1) groundwater monitoring wells, a typically three monitoring wells consist of 2.5 cm diameter PVC casing with the well screen in the saturated zone surrounded by gravel back used as filter during water pumping. The wells were installed spaced at an angle of 120˚ from each other, at a radial distance 40, 30 and 20 cm from the injection well; and 2) multilevel soil monitoring point, three points were chosen at different depths from the top of soil surface 30, 40 and 50 cm, respectively.
2.2.3. Air Compressor
An air compressor required to transfer air through sparging system was selected according to expected pressure and flow rate. The compressed air for sparge well was supplied from 0.5 HP (800 kPa) compressor.
2.3. Experimental Procedure and Protocol
Experiment was designed to simulate in situ removal of contaminants by air sparging. Air sparging system was operated at three intervals in a pulsed mode, six hours per day, each interval takes one weak. The experiment was conducted for one chemical pollutant (Gasoline). Chemical and physical properties of gazoline are described in Table 2.
The experimental protocol was included the following steps:
• The water table was raised to the top surface of the soil with gasoline concentration of 0.98 g/l.
• The fluid was allowed to settle until the water table stabilized.
• Water table was maintained at constant level, 20 cm below the top surface of the soil.
• Water tank 60 L was connected to the pilot inlet, filled with synthesized polluted sample with the same gasoline concentration as the water in the main tank, in order to apply constant hydraulic head and to simulate movement of groundwater flow.
• Air was initially injected at range of flow rate from 15 to 20 L/min and the actual delivery pressure in the pilot was used in range from 300 to 400 kPa according to the radius of influence (ROI), which was estimated through observation of air bubbles in the unsaturated zone. Initial entry air pressures ranged from 400 to 450 kPa, which represent pressure needed for diffusion of air flow. The injection pressure then generally decreased to about 370 kPa, as a steady flow condition is approached. Pressure should not exceed safe level since high pressure can damage air sparging channels and cause fracturing in the formation.
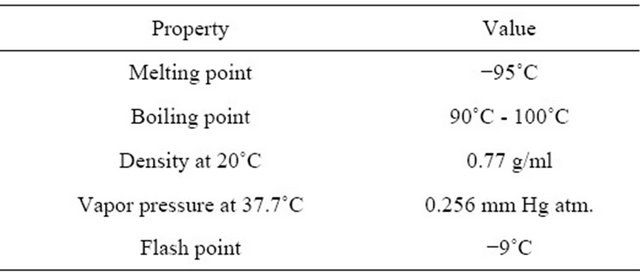
Table 2. Chemical and physical properties of used gasoline.
• Water and soil sampling are continued until the end of experiment.
Since ROI is affected by flow rate and pressure, flow rate and pressure were adjusted until the required ROI was reached. When air flow was 15 L/min and pressure was 200 kPa, ROI was 20 cm; and when the pressure was increased to 300 kPa, the ROI reached at 40 cm. Finally when it was operated at 370 kPa, the measured ROI was 45cm, but the greatest bubbling activity was confined to a region with a radius of 20 cm (as also achieved by Semer et al. [13]. The procedure for adjusting flow rate and the amount of pollutant was also explained by Johnson’s two-dimensional laboratory scale experiment. Pulsing rate was 6 hours on, 18 hours off. Total organic carbon, lead, pH and DO were monitored for both water and soil.
3. Results and Discussion
The analysis results showed that the total organic carbon in soil samples regardless of depth increased after one week of operation and then decreased in the third week to reach zero in the last week, which mean cumulative removal efficiency is about 100% as shown in Table 3.
Total organic carbon (TOC) concentration in water samples was found to decrease slowly as the monitoring well become farther from injection well. This decrease is attributed to time needed to meet maximum removal rate. Therefore, if the removal efficiency was compared at the same time step, it was found that it has reached 74% at the nearest well, 43% at the second farthest well and 18% at the farthest well as illustrated in Table 4.
It was noticed that for both water and soil samples, when TOC decreases pH increases. However, TOC and pH are almost constant at different depths for both soil and water (Figure 3).
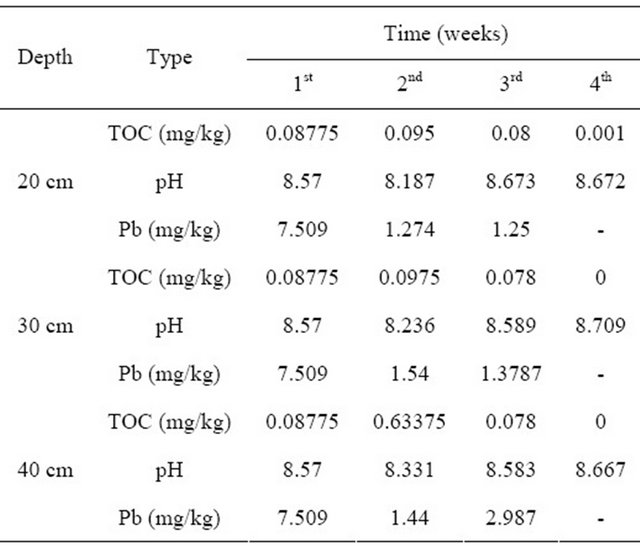
Table 3. Results of soil samples chemical analysis through remediation stages.
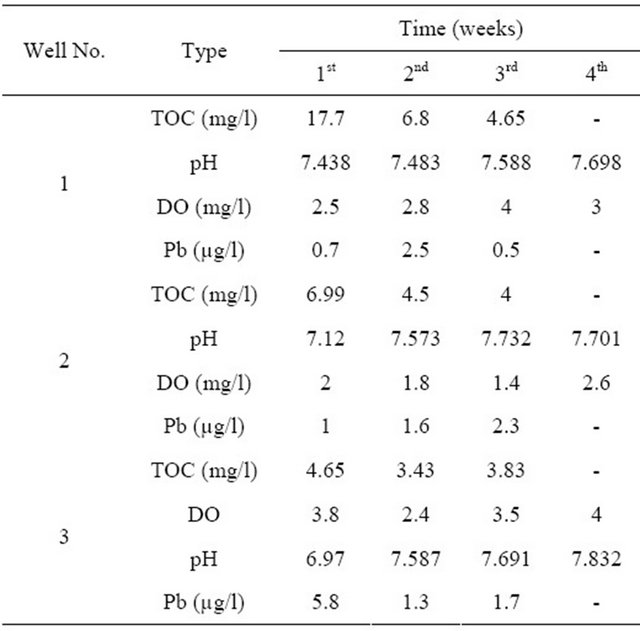
Table 4. Results of water samples chemical analysis through remediation stages.
Regarding the DO in water samples, it was found that there was slight general increase with time with little exception in the fourth week. This might be due to the continuous supply of Oxygen to the system and the decrease in TOC concentration.
As for the lead concentration in water, it did not show any smooth trend of increase or decrease mainly due to the fact that the air sparging process do not remove lead and that other processes might be involved. In soil, the lead concentration was found to decrease with time and almost no change with depth. Some of the results for lead may not be logical. The reason for that could be the interruption of other processes in soil and water or error in measurements. In any case interpreting lead concentration was out of the scope of this experiment and was only used as indication of the hydrocarbons sources particularly when it comes from leaded fuel.
The TOC in water samples was logical as it should decrease with time except +10% errors in the last reading for the third well that might have happened during sampling or testing of the water sample as shown in Figure 4.
As earlier stated regarding DO concentration, Figure 5 shows some logical results in first well, however for the second and third wells it shows some disturbance at the beginning of the treatment process. Some of the errors might have resulted during the sampling in the first week as the water pump has caused too much turbulence.
The lead concentration in soil samples were decreased with increasing pH value that’s because of increasing hydroxide ions and lead may precipitate and move with pollutant to the lower layers of soil as shown in Figures 6 and 7.
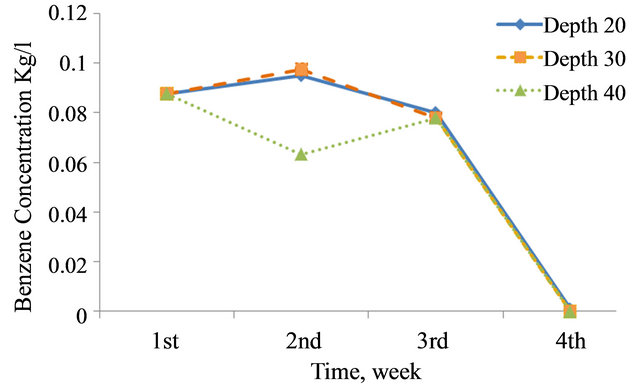
Figure 3. Total organic carbon concentration in soil at different depths.
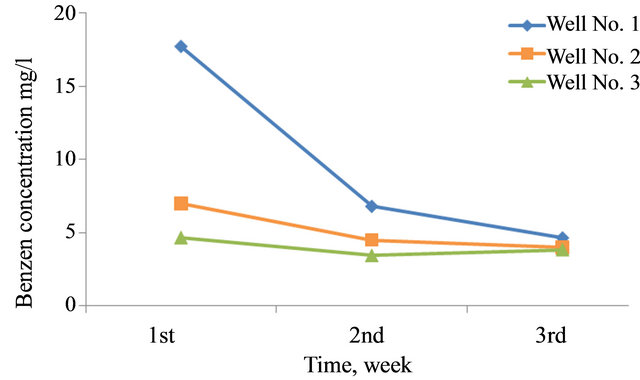
Figure 4. Total organic carbon concentration in water for three wells.
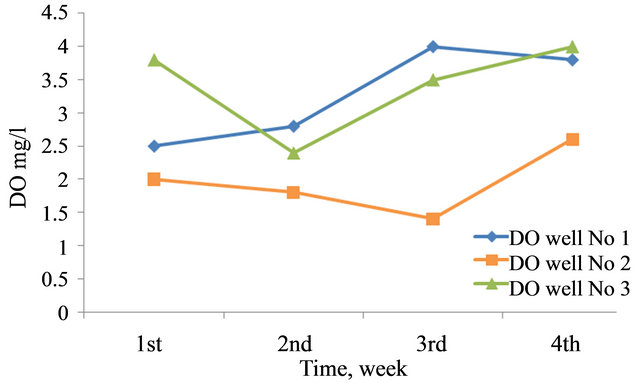
Figure 5. Dissolved oxygen in water for three wells.
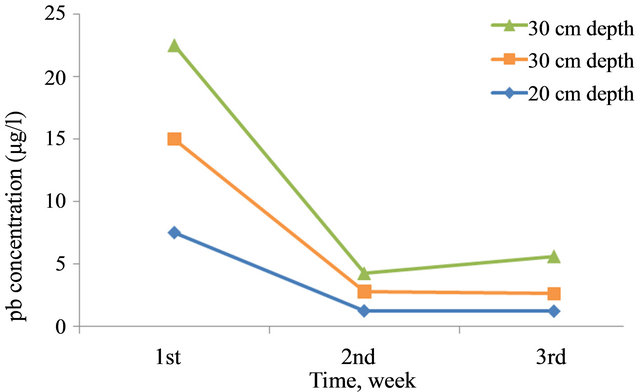
Figure 6. Lead concentration in soil at different depths.
The pH in the Egyptian Gasoline that is used in Gaza and in this experiment was 8.3, which means that the used Gasoline reacted as basic which should result in the decrease of pH with time for both soil and water. Figures 8 and 9 did not show similar logical trend also could be due to the disturbance and turbulence.
4. Conclusions
The main pollution sources of hydrocarbon in Gaza Strip are accidental spill of petroleum products (one case was unofficially reported), uncontrolled disposal of waste
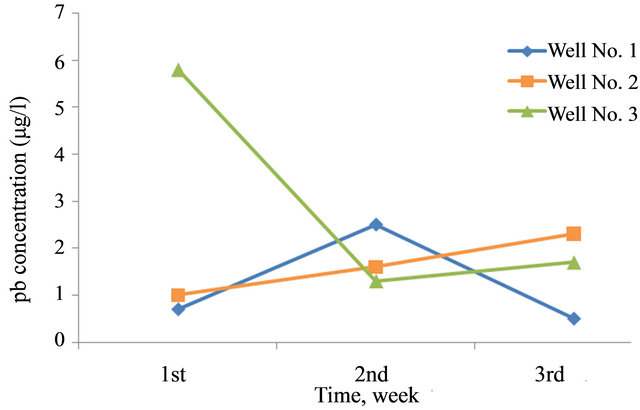
Figure 7. Lead concentration in water for three wells.
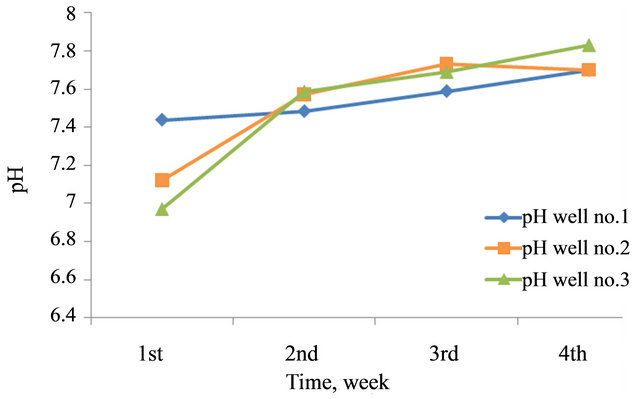
Figure 8. pH in water samples for three wells.
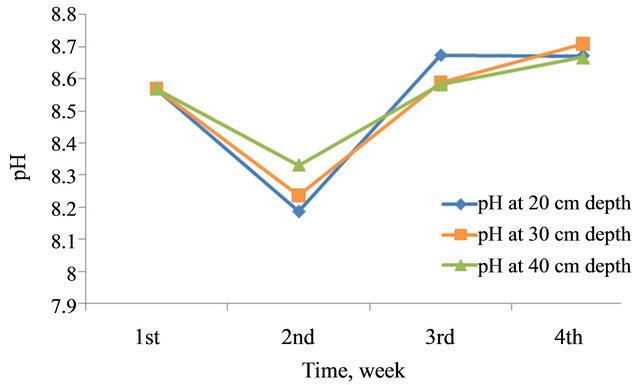
Figure 9. pH in water samples at different depths.
water, unmonitored petroleum transfer sites. Air sparging technology was found to be suitable for Gaza based on the hydraulics and physical properties of Gaza shallow groundwater aquifer. Laboratory scale experiments were used to determine the optimal operational parameters of the air sparging process including the radius of influence, the air flow rate and the air pressure. Properties of contaminant are important in determination the amount of air required and the operation time where air injection rate should be chosen, which maximizes the effect of the dominant removal mechanism at the site. There is an inverse relationship between TOC and DO, because the treatment operation consume huge amount of oxygen.
The laboratory scale model dimensions are 120 cm long, 80 cm wide and 100 cm high. Four pilot scale wells were installed at different depths and different spatial distribution. The central well was used for injecting air and the surrounding three wells were used for monitoring. The contaminated water and soil were tested for TOC, Pb, DO, and pH; one time before the start of treatment and four times through the treatment process.
The concentration of pollutant in water and soil before air injection was 980 ppm and 0.08775 ppm, respectively. After air injection for three weeks (six hours daily) at rang of flow rate from 15 to 20 L/min and at pressure range from 300 to 400 kPa, the concentration of pollutant decreases to 4.0 ppm and 0.0 ppm in water and soil, respectively.
REFERENCES
- Y. Shevah and M. Waldman, “In-Situ and Onsite Treatment of Groundwater,” Pure and Applied Chemistry, Vol. 67, No. 8-9, 1995, pp. 1549-1561. doi:10.1351/pac199567081549
- E. K. Nyer and S. S. Suthersan, “Air Sparging: Savior of Groundwater Remediation or Just Blowing Bubbles in the Bath Tub,” Groundwater Monitoring & Remediation, Vol. 13, No. 4, 1993, pp. 87-91. doi:10.1111/j.1745-6592.1993.tb00453.x
- K. P. Chao, S. K. Ong and M. C. Huang, “Mass Transfer of VOCs in Laboratory-Scale Air Sparging Tank,” Journal of Hazardous Materials, Vol. 152, No. 3, 2008, pp. 1098-1107. doi:10.1016/j.jhazmat.2007.07.087
- K. W. Rutherford and P. C. Johnson, “Effects of Process Control Changes on Aquifer Oxygenation Rates during in Situ Air Sparging in Homogeneous Aquifers,” Groundwater Monitoring & Remediation, Vol. 16, No. 4, 1996, pp. 132-141. doi:10.1111/j.1745-6592.1996.tb01180.x
- A. P. Mortensen, K. H. Jensen, T. O. Sonnenborg and E. Arvin, “Laboratory and Numerical Investigations of Air Sparging Using MTBE as a Tracer,” Groundwater Monitoring & Remediation, Vol. 20, No. 4, 2000, pp. 87-95.
- W. Ji, A. Dahmani, D. P. Ahlfeld, J. D. Lin and E. Hill, “Laboratory Study of Air Sparging: Air Flow Visualization,” Groundwater Monitoring & Remediation, Vol. 13, No. 4, 1993, pp. 115-126. doi:10.1111/j.1745-6592.1993.tb00455.x
- P. C. Johnson, A. Das and C. Bruce, “Effect of Flow Rate Changes and Pulsing on the Treatment of Source Zones by in Situ Air Sparging,” Environmental Science & Technology, Vol. 33, No. 10, 1999, pp. 1726-1731. doi:10.1021/es9807688
- J. W. Peterson, P. A. Lepczyk and K. L. Lake, “Effect of Sediment Size on Area of Influence during Groundwater Remediation by Air Sparging: A Laboratory Approach,” Environmental Geology, Vol. 38, No. 1, 1999, pp. 1-6.
- K. R. Reddy, S. Kosgi and J. Zhou, “A Review of in Situ Air Sparging for the Remediation of VOC Contaminated Saturated Soils and Groundwater,” Hazardous Waste and Hazardous Materials, Vol. 12, No. 2, 1995, pp. 97-118. doi:10.1089/hwm.1995.12.97
- P. D. Lundegard and G. Andersen, “Multiphase Numerical Simulation of Air Spaging Performance,” Groundwater, Vol. 34, No. 3, 1996, pp. 451-460. doi:10.1111/j.1745-6584.1996.tb02026.x
- C. R. Plummer, J. D. Nelson and G. S. Zumwalt, “Horizontal and Vertical Well Comparison for in Situ Air sparging,” Groundwater Monitoring & Remediation, Vol. 17, No. 1, 1997, pp. 91-96. doi:10.1111/j.1745-6592.1997.tb01188.x
- G. L. Hein, J. S. Gierke, N. J. Hutzler and R. W. Falta, “Three-Dimensional Experimental Testing of a TwoPhase Flow-Modeling Approach for Air Sparging,” Ground- water Monitoring & Remediation, Vol. 17, No. 3, 1997, pp. 222-230.
- R. Semer, J. A. Adams and K. R. Reddy, “An Experimental Investigation of Air Flow Patterns in Saturated Soils during Air Sparging,” Geotechnical and Geological Engineering, Vol. 16, No. 1, 1998, pp. 59-75. doi:10.1023/A:1008884213834
- K. R. Reddy and J. Adams, “Conceptual Modeling of Air Sparging for Ground Water Remediation,” Proceedings of the 9th International Symposium on Environmental Geotechnology and Global Sustainable Development, Hong Kong, June 2008.
- L. Hu, X. Wu, Y. Liu, J. N. Meegoda and S. Gao, “Physical Modeling of Air Flow during Air Sparging Remediation,” Environmental Science & Technology, Vol. 44, No. 10, 2010, pp. 3883-3888. doi:10.1021/es903853v
- W. A. Jury, W. R. Gardner and W. H. Gardner, “Soil Physics,” 5th Edition, John Wiley & Sons Inc., Hoboken, 1991.