Journal of Environmental Protection
Vol. 3 No. 10 (2012) , Article ID: 23864 , 6 pages DOI:10.4236/jep.2012.310151
A Revised Fair Plan to Safeguard Earth’s Climate
![]()
Climate Research Group, Department of Atmospheric Sciences, University of Illinois at Urbana-Champaign, Urbana, USA.
Email: schlesin@atmos.uiuc.edu
Received July 18th, 2012; revised August 19th, 2012; accepted September 23rd, 2012
Keywords: Climate Change; Global Warming; Greenhouse-Gas Emissions; Mitigation
ABSTRACT
In our original study we crafted trajectories for developed and developing countries that phased-out greenhouse gas emissions during 2015-2065 such that the maximum global warming does not exceed the 2˚C threshold adopted by the UN Framework Convention on Climate Change, and the cumulative emissions for developed and developing countries are identical. Here we examine the effects of increasing the start year from 2015 to 2030 in 5-year intervals, and the phase-out period from 50 to 100 years in 10-year intervals. We find that phase-out during 2020-2100 is optimal. This phase-out increases the year of peak emission from 2015 to 2030 for developed countries and from 2042 to 2053 for developing countries. It also increases the time from peak emissions to zero emissions from 50 to 70 years for developed countries and from 23 to 47 years for developing countries. Both outcomes should facilitate agreement of the Revised Fair Plan by the UNFCCC.
1. Introduction
“The ultimate objective of” the United Nations Framework Convention on Climate Change (UNFCCC) is “stabilization of greenhouse gases at a level that would prevent dangerous anthropogenic interference with the climate system” [1]. The European Council confirmed that, “with the view to achieving the ultimate objective of the UNFCCC, the global annual mean surface temperature increase should not exceed 2˚C above pre-industrial levels” [2]. At its sixteenth Conference of the Parties, the UNFCCC recognized “those deep cuts in global greenhouse gas emissions are required according to science” “to hold the increase in global average temperature below 2˚C above pre-industrial levels” [3]. In our original Fair Plan study (FP1) [4] we crafted trajectories for developed and developing countries that phased-out greenhouse gas emissions during 2015-2065 such that the maximum global warming did not exceed the 2˚C UNFCCC threshold and the cumulative emissions for developed (Annex B, AB) and developing (non-Annex B, nAB) countries were identical. The method for doing this is described in detail in FP1.
In FP1 we took the starting year and period for the phase-out of greenhouse gas (GHG) emissions to be 2015 and 50 years, respectively. Here we examine the effect of: 1) delaying the starting year until 2020, 2025 and 2030 (Section 2); and 2) increasing the phase-out period from 50 years to 100 years in 10-year increments (Section 3). In Section 4 we examine the optimum phaseout trajectory that begins in 2020 and completes in 2100. Our results are discussed in Section 5.
2. Start Year for the Phase-Out of Greenhouse Gas Emissions
Figure 1 presents the GHG emissions intensity for AB and nAB countries relative to the reference RCP-8.5 case (see FP1) for starting years of 2015—as in FP1, 2020, 2025 and 2030, and Figure 2 shows the corresponding
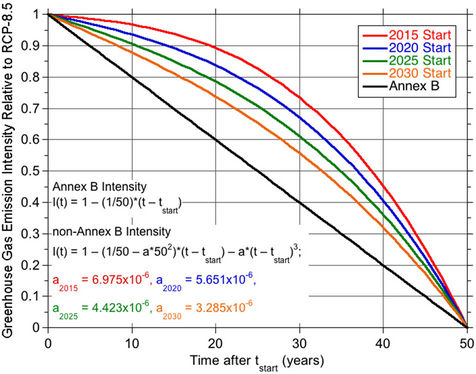
Figure 1. The GHG emissions intensity for Annex B (black) and non-Annex B (non-black) countries relative to the reference case RCP-8.5 for the 50-year phase-outs of 2015- 2065, 2020-2070, 2025-2075 and 2030-2080.
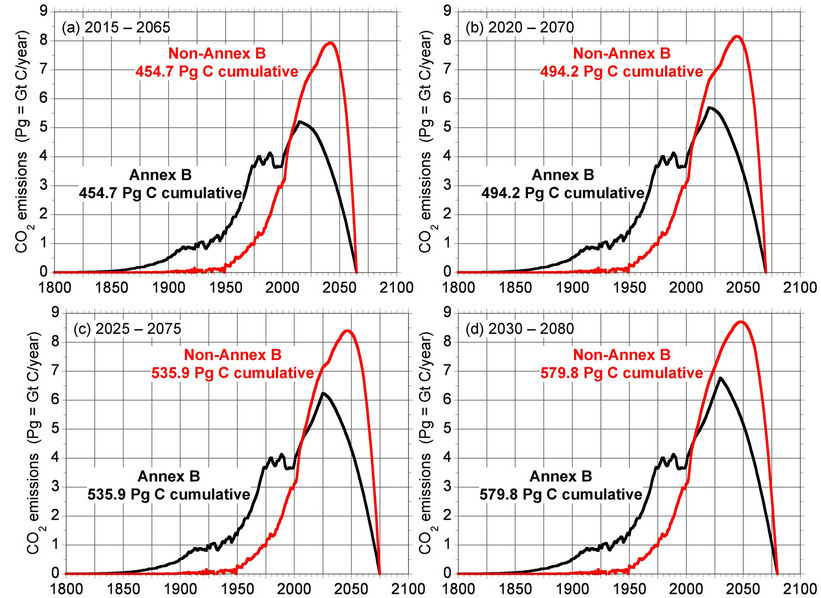
Figure 2. The CO2 emissions trajectories for Annex B (black) and non-Annex B (red) countries corresponding to the intensities shown in Figure 1 for the 50-year phase-outs of 2015-2065, 2020-2070, 2025-2075 and 2030-2080.
GHG emissions trajectories. Figure 1 shows that as the starting year is delayed from 2015 to 2030, the emissions intensity for non-AB countries flattens out and approaches the emissions intensity for AB countries. Because of this, as the starting year of the Plan is delayed from 2015 to 2030, the emissions-intensity trajectory for developing countries must become more aggressive in the early years of the Plan, while becoming less aggressive during its final years. This argues for starting earlier rather than later.
Figure 2 shows that as the starting year of the Plan is delayed from 2015 to 2030, the maximum GHG emissions for both AB and non-AB countries increase and occur later in the 21st century. The cumulative GHG emissions also increase as the starting year of the plan is delayed from 2015 to 2030, this as shown graphically in Figure 3. Here it is seen that the cumulative GHG emissions increase essentially linearly from 455 GtC for the 2015 start year to 580 GtC for the 2030 start year, an increase of 125 GtC, that is, almost 28%.
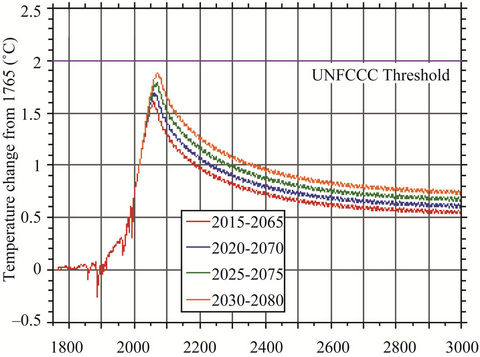
The corresponding changes in global-mean near-surface temperatures for the climate sensitivities required to reproduce the observed global warming for the HadCRU, GISS and NOAA temperature datasets (see FP1) are presented in Figure 4. Here is it seen that the maximum global temperatures increase as the starting year of the Plan is delayed from 2015 to 2030, and occur later in the 21st century. The maximum global temperature change from pre-industrial time is below the 2˚C UNFCCC maximum-warming threshold for the climate sensitivities for the HadCRU and GISS temperature datasets—1.61˚C and 1.45˚C, respectively—for all three starting years. However, the maximum global temperature change is above the 2˚C UNFCCC maximum-warming threshold for the climate sensitivity for the NOAA temperature dataset—1.98˚C—for the 2025 and 2030 starting years.
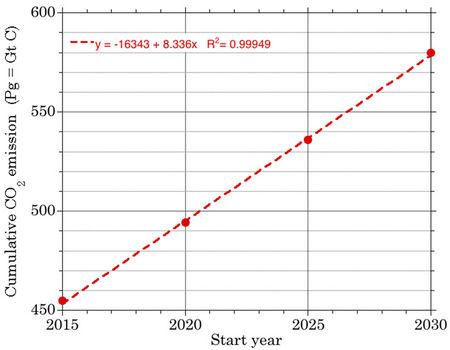
Figure 3. Cumulative CO2 emissions (GtC) versus starting year for the 50-year phase-outs of 2015-2065, 2020-2070, 2025-2075 and 2030-2080.
 (a)
(a)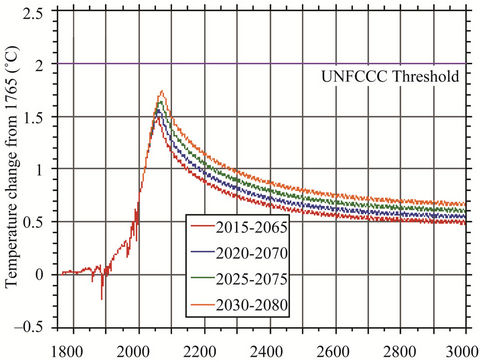 (b)
(b) (c)
(c)
Figure 4. Changes in global-mean near-surface temperature relative to pre-industrial for the climate sensitivities required to reproduce the observed global warming for the HadCRU (a), GISS (b) and NOAA (c) temperature datasets. Temperature changes are shown for the 50-year phase-outs of 2015-2065 (red), 2020-2070 (blue), 2025-2075 (green) and 2030-2080 (orange).(a) HadCRU;(b) GISS;(c) NOAA
Because the climate sensitivities for the three temperature datasets are on the low side of the range given in the IPCC Fourth Assessment Report, the fact that the maximum warming for the climate sensitivity of the NOAA dataset exceeds the 2˚C UNFCCC threshold for starting years 2025 and 2030 indicates that the starting year for emissions reduction should not be later than 2020. In fact, at the 17th Conference of the Parties of the UNFCCC, 2020 was chosen as the starting year for the beginning of legally binding emissions reduction [5]. Accordingly, in the next section we adopt 2020 as the starting year for emissions reduction and explore the effect of increasing the phase-out period for these reductions from the 50 years of our FP1 paper to 100 years in 10-year increments.
3. Period for the Phase-Out of Greenhouse Gas Emissions
Figure 5 presents the GHG emissions intensity for AB and non-AB countries relative to the reference RCP-8.5 case for phase-out periods of 50, 60, 70, 80, 90 and 100 years, each for a starting year of 2020. It can be seen that as the phase-out period increases, the emissions-intensity curve for the non-AB countries flattens out and approaches the straight line of the emissions-intensity curve for the AB countries. The two curves are almost indistinguishable for the phase-out period of 90 years. For the phase-out period of 100 years, the emissions-intensity curve for the non-AB countries lies below the emissions-intensity curve for the AB countries. This occurs because by the end of the 100-year phase-out period, the reference-case emissions for the non-AB countries greatly exceeds the reference-case emissions for the AB
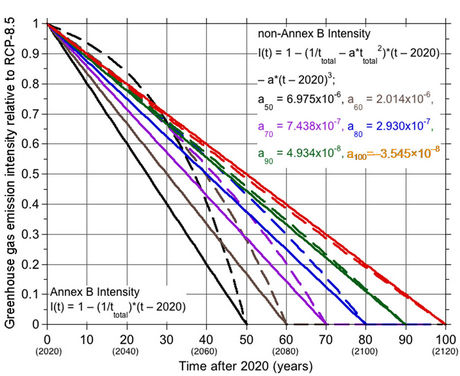
Figure 5. The GHG emissions intensity for Annex B (solid) and non-Annex B (dashed) countries relative to the reference case RCP-8.5 for phase-out periods of 50 years (black), 60 years (brown), 70 years (purple), 80 years (blue), 90 years (green) and 100 years (red).
countries. (Note in Figure 2(b) of FP1 that the maximum annual emissions for nAB exceeds that of AB, even for the FP1 mitigation scenario) This argues for a short phaseout period rather than a long phase-out period.
How long a phase-out period can be chosen and still meet the UNFCCC 2˚C maximum-warming threshold? We can estimate this from the dependence of the cumulative CO2 emissions on phase-out period shown in Figure 6 and the dependence of the maximum global warming on cumulative emissions shown in Figure 7, the latter for the HadCRU results for the 50-year phaseout beginning in 2015, 2020, 2025 and 2030. Figure 6 shows that the dependence of the cumulative emissions on phase-out period is essentially linear. This linear dependence occurs because the change in annual emissions is only a small fraction of the level of annual emissions. Figure 7 shows that the dependence of the maximum global warming on cumulative emissions is also essentially linear. From the linear fit shown in Figure 7 it is
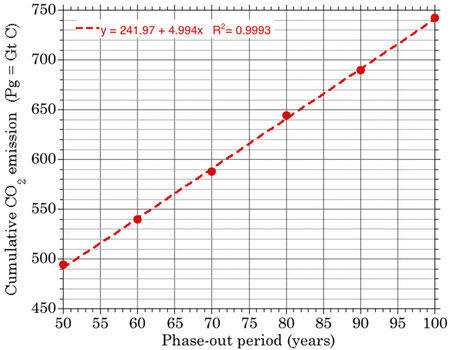
Figure 6. Cumulative CO2 emissions (GtC) versus phaseout period for the 2020 starting year.
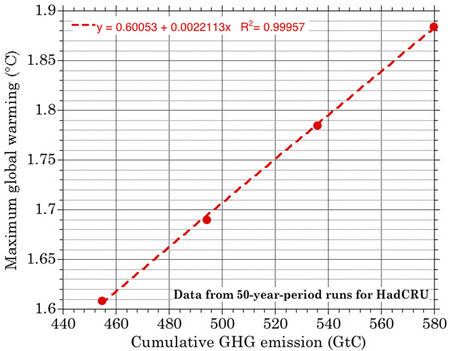
Figure 7. Maximum global warming versus cumulative CO2 emission for the climate sensitivity based on the HadCRU temperature observations (Figures 3 and 4(a)).
estimated that the 2˚C maximum warming would occur for cumulative emissions of 633 GtC, and from the linear fit shown in Figure 6 it is estimated that this cumulative emissions would occur for a phase-out period of 78.3 years. Accordingly, we choose a phase-out period of 80 years, that is, from 2020 to 2100.
4. Eighty-Year Phase-Out Period: 2020 to 2100
Figure 8 presents the emissions trajectories for AB and nAB for both the 80-year and 50-year phase-out periods, the latter from FP1. It can be seen that the increase in phase-out period from 50 to 80 years increases: 1) the cumulative emissions from 454.7 to 644.1 GtC; 2) the peak emission from 5.21 GtC/year to 5.92 GtC/year for AB, and from 7.93 GtC/year to 7.94 GtC/year for nAB; and 3) the year of peak emission from 2015 to 2030 for AB, and from 2042 to 2053 for nAB. Thus the number of years from peak emission to zero emission increases from 50 years to 70 years for AB, and from 23 years to 47 years for nAB. Accordingly, the increase in phase-out period from 50 to 80 years allows an increase in peak emission for AB, and an increase in the duration of increasing emission for both AB and nAB. It also allows a much more gradual phaseout of emissions for both AB and nAB. But, does the increase in phase-out period from 50 to 80 years allow prevention of the maximum global warming from exceeding the UNFCCC threshold of 2˚C?
Figure 9 presents the trajectory of global warming for the 80-year phase-out period for the three climate sensitivities corresponding to the HadCRU, GISS and NOAA temperature observations. It can be seen therefrom that the UNFCCC 2˚C threshold is not exceeded for the climate sensitivities of the HadCRU and GISS observations, but is, slightly, for the climate sensitivity of the NOAA ob-
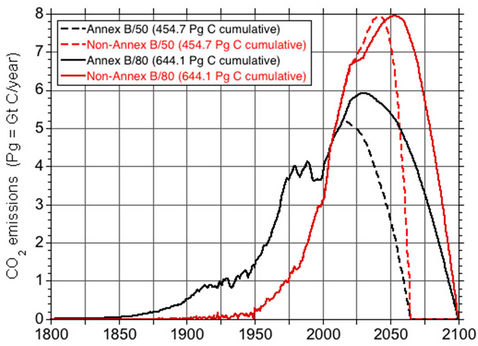
Figure 8. The CO2 emissions trajectories for Annex B (black) and non-Annex B (red) countries for the 80-year phase-out period (solid) in comparison with the 50-year phase out period (dashed), both starting in 2020.
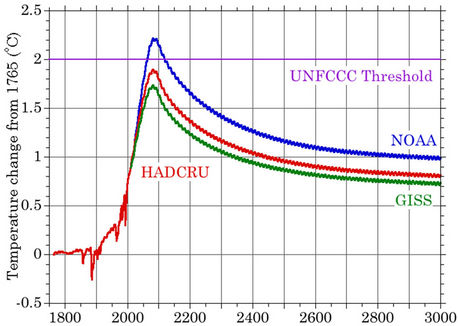
Figure 9. Changes in global-mean near-surface temperature relative to pre-industrial for the climate sensitivities required to reproduce the observed global warming for the HadCRU (red), GISS (green) and NOAA (blue) temperature datasets. Temperature changes are for the 80-year phaseout, 2020 to 2100.
servations. This indicates that the 80-year phase-out period is very close to being the optimal phase-out period. If the phase-out period were longer than 80 years, the 2˚C threshold would not be met. While if the phase-out period were shorter than 80 years, the time from peak emissions to zero emissions would be shortened, thereby making it more difficult for the elimination of emissions to be achieved.
5. Discussion
In our original Fair Plan paper (FP1) we crafted mitigated GHG emission scenarios for Annex B (AB, developed) countries and non-Annex B (nAB, developing) countries that keep the maximum global warming below the 2˚C threshold set by the UN Framework Convention on Climate Change (UNFCCC) to “prevent dangerous anthropogenic interference with the climate system” and equalize the cumulative GHG emissions by AB and nAB countries. These mitigated GHG emission scenarios began in 2015 and ended in 2065 when the emissions ceased altogether. In this sequel we have examined the effects of changing the starting date of the GHG emission phase-out from 2015 to 2030 in 5-year increments. We have also investigated the effects of increasing the phaseout period from 50 years to 100 years in 10-year intervals.
We have found that as the starting year is delayed from 2015 to 2030: 1) the emissions intensity for non-AB countries flattens out and approaches the emissions intensity for AB countries; 2) the emissions-intensity trajectory for developing countries becomes more aggressive in the early years of the Plan; and 3) the maximum global temperatures increase and occur later in the 21st century.
The maximum global temperature change is below the 2˚C UNFCCC threshold for the climate sensitivities for the HadCRU and GISS temperature datasets for all three starting years. However, the maximum global temperature is above the 2˚C UNFCCC threshold for the climate sensitivity for the NOAA temperature dataset for the 2025 and 2030 starting years. Because the climate sensitivities for the three temperature datasets are on the low side of the range given in the IPCC Fourth Assessment Report, the fact that the maximum warming for the climate sensitivity of the NOAA dataset exceeds the 2˚C UNFCCC threshold for starting years 2025 and 2030 indicates that the starting year for emissions reduction should not be later than 2020.
We have found that as the phase-out period increases from 50 to 100 years, the emissions-intensity curve for the non-AB countries flattens out and approaches the straight line of the emissions-intensity curve for the AB countries. The two curves are almost indistinguishable for the phase-out period of 90 years. For a phase-out period of 100 years, the emissions-intensity curve for the non-AB countries lies below the emissions-intensity curve for the AB countries. This argues for a phase-out period not longer than 80 years.
For the 80-year phase-out period, the UNFCCC 2˚C threshold is not exceeded for the climate sensitivities of the HadCRU and GISS observations, but is, slightly, for the climate sensitivity of the NOAA observations. This indicates that the 80-year phase-out period is very close to being the optimal phase-out period.
For the Revised Fair Plan, the year of maximum emissions is increased from 2015 to 2030 for the developed countries, and from 2042 to 2053 for the developing countries. Thus for the Revised Fair Plan, the number of years from peak emission to zero emission is increased from 50 to 70 years for the developed countries and from 23 to 47 years for the developing countries.
Accordingly, starting the emissions reduction in 2020 rather than 2015 (FP1) and increasing the phase-out period from 50 years (FP1) to 80 years—2020 to 2100— allows the world to keep global warming below, or only slightly above, the threshold of 2˚C required by the UNFCCC to “prevent dangerous anthropogenic interference with the climate system”, while equalizing the cumulative emissions of greenhouse gases by the developed and developing countries. In so doing the time to peak emission is increased by 15 years for the developed countries and 11 years for the developing countries, and the time from peak emissions to zero emissions is increased by 20 years for developed countries and 24 years for the developing countries. Both of these outcomes should facilitate agreement on the revised Fair Plan by the UN Framework Convention on Climate Change, either at its Conference of the Parties 18 in Doha, Qatar, in 2012 or soon thereafter.
6. Acknowledgements
This work is funded by the United States National Science Foundation through grant ATM-0806155. Any opinions, findings, and conclusions or recommendations expressed in this material are those of the authors and do not necessarily reflect the views of the National Science Foundation.
REFERENCES
- United Nations, “United Nations Framework Convention on Climate Change,” 1992. http://unfccc.int/resource/docs/convkp/conveng.pdf
- Council of the European Union, “Presidency Conclusions,” 2005. http://register.consilium.europa.eu/pdf/en/05/st07/st07619-re01.en05.pdf
- United Nations, “Report of the Conference of the Parties on Its Sixteenth Session. Addendum Part Two: Action taken by the Conference of the Parties at Its Sixteenth Session,” 2010. http://unfccc.int/meetings/cancun_nov_2010/meeting/6266/php/view/reports.php
- M. E. Schlesinger, M. J. Ring and E. F. Cross, “A Fair Plan for Safeguarding Earth’s Climate,” Journal of Environmental Protection, Vol. 3, No. 6, 2012, pp. 455-461. doi:10.4236/jep.2012.36055.
- United Nations, “Report of the Conference of the Parties on its Seventeenth Session. Addendum Part Two: Action taken by the Conference of the Parties at its seventeenth session,” 2011. http://unfccc.int/documentation/documents/advanced_search/items/6911.php?priref=600006773