Journal of Environmental Protection
Vol. 3 No. 6 (2012) , Article ID: 20062 , 10 pages DOI:10.4236/jep.2012.36061
Nutrient-Induced Growth of Coliform and HPC Bacteria in Drinking-Water Pipes
![]()
1Department of Earth Science, University of Ghana, Accra, Ghana; 2Science and Technology Policy Research Institute, CSIR, Accra, Ghana; 3Graduate School of Nuclear and Allied Sciences, University of Ghana, Accra, Ghana.
Email: *pasakyi@ug.edu.gh
Received March 27th, 2012; revised April 19th, 2012; accepted May 22nd, 2012
Keywords: Coliform; HPC Bacteria; Nutrient; Drinking-Water Pipes; Biofilm; Bacterial Growth
ABSTRACT
We conducted a study on a model drinking water distribution system to evaluate the impact of nutrient in the form of sodium acetate on the growth and survival of coliform and heterotrophic plate count (HPC) bacteria for a maximum of 21 days residence time of water in pipes. Our results show that, besides the nutrient added and the absence of any additional source of contamination and additional supply of nutrient, there was significant growth of the above mentioned bacteria in the pipes and bottles for a couple of days, after which the bacterial population began to decrease. The results indicate that the bacteria used the nutrient to grow and multiply until the nutrient was totally consumed and became depleted in the bulk water phase, after which the bacterial population reached a near stationary level and subsequently declined. This suggests the death of some of the bacteria and their dead cells were used by other bacteria for growth and survival. Using a detection limit of 3.3 CFU/100 mL for the coliforms, the study shows that after sometime, no bacteria were found in the water phase of the pipe, however, the biofilm in the pipes still harbored some of the bacteria. The results have revealed that the bacteria also have the tendency to move from the water phase to the biofilm since the latter provides a more suitable environment for bacteria to thrive on and grow, thus prolonging their survival in the system.
1. Introduction
Unpolluted safe drinking water has been one of the primary requirements for healthy and sustainable human life. Understanding the sources of water quality degradation during distribution has become a priority for water producers, because research has suggested that such degradation increases the rate of gastrointestinal illness [1]. Among the indicators of the presence of diseasecausing bacteria in water are the coliform group of bacteria and heterotrophic plate count (HPC) bacteria.
Members of the coliform group are described as all aerobic and facultative anaerobic, Gram-negative, nonspore-forming, rod-shaped bacteria that ferment lactose with gas and acid formation within 24 - 48 hours at 35˚C - 37˚C [2], or develop a red colony with a metallic sheen within 24 hours at 35˚C on an Endo-type medium containing lactose [3]. Thermotolerant coliforms are a group of organisms that are capable of fermenting lactose at incubation temperatures of 44˚C - 45˚C. This group comprises the genus Escherichia coli (E. coli) and to a lesser extent, species of Klebsiella, Enterobacter and Citrobacter. E. coli is the most common coliform found in the intestines of humans and warm-blooded animals, and its presence might be principally associated with fecal contamination [3], since it is specifically of fecal origin, and its presence in water or soil may be indication of fecal pollution. The unique characteristics of coliforms, which make them useful as indicators of fecal contamination, include their presence at higher levels in samples than the suspected pathogen, and their more resistance to disinfectants than the pathogens themselves. Singh and McFeters [4] also reported that fecal coliform bacteria such as E. coli are usually long term inhabitants of aquatic ecosystems as they originate from mammalian intestines. Consequently, these organisms serve as “indicator bacteria” of recent fecal contamination and may suggest the presence of potentially harmful pathogens in the water.
Because it is impractical to monitor drinking water for every possible microbial pathogen such as bacteria, fungi, yeast and protozoa, a more logical approach is the detection of organisms such as the coliform group that are normally present in the feces of humans and other warmblooded animals and often associated with the bacteria [5]. Consequently, the use of normal intestinal organisms as indicators of fecal pollution rather than the pathogens themselves is universally accepted for monitoring and assessing the microbial safety of water supplies [2]. Thus, the routine monitoring of the bacteriological quality of drinking water relies on the extensive use of indicator organisms such as E. coli, coliforms and HPC bacteria [6]. For instance, E. coli strains give symptoms of waterborne diseases such as dysentery with fever, urinary tract infection, severe bloody and watery diarrhea, abdominal cramps, nausea, vomiting and possible hemolytic uremic syndrome that may lead to kidney failure [2,7].
HPC bacteria are naturally present in all aqueous environments, and they undergo multiplication cycles in drinking water, especially in closed containers or in tap water when chlorine levels are dissipated [8], and are therefore considered a useful indicator of water quality [9]. They are able to grow and produce visible colonies on the media used and under the prescribed conditions of temperature and time of incubation. Colony counts are usually determined after incubation at 22˚C and 37˚C to assess the relative proportions of naturally occurring water bacteria unrelated to fecal pollution and of bacteria derived from humans and warm-blooded animals respectively [2].
The main objective of this study, therefore, was to investigate the factors that promote the growth and survival of pathogenic E. coli, total coliforms and HPC bacteria in drinking water distribution system. The study focused on the impact of bacterial nutrients and biofilm on these bacteria in drinking water pipes. The research employed a laboratory-based experimental model of drinking water distribution system contaminated with traces of the abovementioned bacteria to determine the survival of the micro-organisms.
2. Materials and Methodology
2.1. Preliminary Investigation of the State of the Pipes Used
The study was carried out at the Institute of Environment and Resources, Technical University of Denmark. Three previously used galvanized pipes were used for the experiment, and were initially stored in a room with a temperature range of 15˚C - 20˚C. The laboratory work commenced by testing the state of the three pipes to be used for the investigation. This was carried out to determine the existence and/or concentrations of coliforms, E. coli and HPC bacteria in the various pipes.
The drinking water used in this study was tap water extracted from an aquifer and treated at the Lyngby Water Works. The water sample, with a pH of about 8 was collected at the Microbiological Laboratory of the abovementioned institute. To start with, the water was sterilized in an autoclave at 121˚C for 15 minutes. Afterwards, the pipes were fully filled with the cool, sterilized water and kept at room temperature for 24 hours. Triplicates of 50 mL were filtered for coliform quantification and the same procedure repeated for E. coli. No coliforms and E. coli were found in the pipes with a detection limit of 0.7 CFU/100 mL (Table 1), indicating the absence of coliform and E. coli in the pipes prior to the commencement of the actual experiment. In the case of the HPC bacteria, triplicates of 100 mL were spread on R2A agar plates, which were subsequently incubated at 25˚C for 7 days. The results obtained indicated an initial HPC bacteria concentrations between 3.4 × 10² CFU/mL and 4.5 × 10² CFU/mL in each of the pipes (Table 2).
2.2. Source of Contaminating Bacteria
The contaminant used to spike the drinking water in the pipes was non-chlorinated, secondary effluent obtained from the Lyngby Taabæk Kommune Wastewater Treatment Plant, also located in Lyngby, Denmark. Because of the anticipated high concentration of bacteria in the treated wastewater, the sample was diluted 10 times (1 mL of the wastewater and 9 mL of drinking water). The treated wastewater was used because naturally contaminated (i.e., coliform-, E. coliand HPC-positive) drinking water samples were not available. The wastewater samples were collected in sterile 250 mL blue cap bottles on the day of each experiment. To ensure that the temperature of the surroundings, which was different from the effluent temperature, did not affect the bacteria in the water, the sampled wastewater was refrigerated until it was ready for use.
2.3. Determination of the Effect of Nutrients on the Growth and Survival of E. coli, Coliform and HPC Bacteria
After the tap water had been left to run for 5 - 10 minutes

Table 1. Summarized results of initial coliform and E. coli concentrations in the pipes used.

Table 2. Initial HPC bacteria concentration in the pipes.
to ensure homogeneity, a 2000 mL blue cap bottle was filled with the tap water to obtain a volume of 1854 mL, including 60 mL diluted treated wastewater containing both total coliform (TC) and E. coli as well as HPC bacteria. The prepared sample was then well mixed and divided into 3 equal portions, each having a volume of 618 mL. 10 mL of tap water was added to the first portion in a 1000 mL bottle, well mixed and subdivided into two equal parts for pipe 1 and glass control bottle 1. Thus, each volume of 314 mL contained 10 mL of diluted treated wastewater, which in turn contained 1 mL undiluted treated wastewater.
Sodium acetate (CH3COONa) was added to the remaining pipes and bottles to serve as nutrient for the bacteria. Each of pipe 2 and control bottle 2 contained 314 mL including 10 mL of diluted treated wastewater, containing 1 mL undiluted treated wastewater. The volume of 314 mL also included 5 mL of 0.0021 g CH3COONa/L equivalent to 10 μg ac-C eq/L, which served as nutrient for pipe 2 and bottle 2. In the case of pipe 3 and its control bottle 3, the procedure was the same as in pipe 2 except that in this case 0.00523 g of CH3COONa/L was used to obtain a concentration of 25 μg ac-C eq/L in both the pipe and the bottle.
The glass bottles, which had no biofilm on their inner walls, were added to distinguish between the impact or otherwise of biofilm on the bacteria. All the pipes and their respective bottles were then incubated at 37˚C [2] for maximum 21 days. Both ends of each pipe indicating inlet and outlet were tightly capped to ensure no leakages and contamination from external sources. Each cap had an opening of <50 mm used as the injection point with 10 mL sterile syringes attached to both ends. During the water retention period, water samples were drawn at selected intervals. Dilution factors ranged from 1 - 103 for total coliforms and 1 - 10–1 for E. coli.
The 21-day water retention period was chosen because studies have shown that these bacteria may survive for days and weeks in water and sediment. According to Brandt et al. [10], long retention time of water in the distribution system can reduce the water’s disinfectant residual and allows the deposition and accumulation of sediment. Thus, stagnant water can occur in dead-end pipes, fire protection storage tanks or finished water storage facilities that are over-sized or have periods of limited use, and therefore, provides an opportunity for suspended particulates to settle into pipe sediments, for biofilm to develop, and for biologically mediated corrosion to accelerate. Consequently, each pipe arrangement was assumed to represent a typical situation in Ghana, where water supply is irregular in many places, for which reason water could be stagnant in a distribution system for at least seven days before additional water is released from storage through the distribution system to various supply points. To ensure that the pipe was always filled with water, any volume of water sample drawn from the pipe through the outlet was replaced with an equal volume of drinking water at the inlet.
2.4. Enumeration of Bacteria
Total and fecal coliforms were enumerated by the total coliform membrane filtration technique [11], using membrane lauryl sulphate agar (MLS-agar) medium [12]. Detailed description is given in Rompre et al. [3]. Triplicates of each sample were analyzed to determine how consistent the results were. Details of the filtration process and precautionary measures employed are described in Miljøstyrelsen [12]. Subsequent to the filtration process was incubation at temperatures of 37˚C ± 1˚C and 44˚C ± 1˚C for 21 ± 3 hours, for coliform and E. coli detection respectively [3]. After the incubation period, the yellow colonies formed on each plate were counted and the total number of the coliform bacteria in 100 mL of the water sample filtered was calculated using Equation (1). Plates with more than 100 colonies were rejected [12];
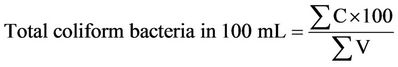 (1)
(1)
where
 is the amount of yellow colonies counted.
 total volume of the sample that has been filtered.
To confirm the presence of E. coli, the following procedure was followed; from the yellow colonies incubated at 44˚C ± 1˚C, 4 - 5 of the colonies were transferred to LTL Bouillon tubes by a sterile needle with each colony into each tube. The tubes were again incubated for 24 hours after which 0.3 mL of Kovacs Indol was added to each tube. A positive E. coli test was signified by the presence of both red ring in the upper layer of the bouillon and an air bubble in the Durham tube. The total number of the E. coli bacteria in 100 mL of the filtered water sample was calculated using Equation (2) [12].
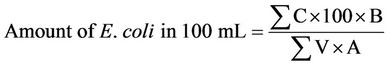 (2)
(2)
where
 and
and  are same as in Equation (1).
A is the number of colonies which have been filtered, and B is the number of the colonies which have been sub-cultivated to verification.
In the enumeration of HPC bacteria, a Finn pipette was used to transfer 0.1 mL of the sample onto the R2A Agar plate in the LAF bench. Metallic pins with triangular head were used to uniformly spread the sample on the plate. The metallic pins were continuously sterilized by a gas flame, after which they were allowed to cool before they were used for the spreading. Each diluted sample was prepared in triplicate. The plates were then incubated at 25˚C for seven days [13] with the plates always turned upside down. After seven incubation days the colonies on the agar plates were counted, using a Stuart scientific colony counter, for the number of HPC bacteria colonies formed.
In calculating the mean total CFU/mL, figures that appeared odd and inconsistent, and thus making comparison impossible were rejected. This was done to avoid the situation where such values might increase the error of the mean. It was also observed that the higher digit numbers produced the more accurate results. Plates with colonies numbering over 300 that were too many and indistinctive, and in most cases clustered together, which made counting impossible were rejected [14].
The mean total colony forming units per milliliter and the corresponding error (s) were calculated using the following relations [14]:
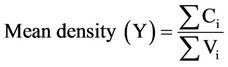 (3)
(3)
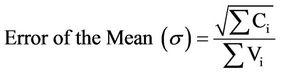 (4)
(4)
where Ci = individual colonies, and Vi = volume of original sample.
2.5. Bacterial Quantification in Biofilm
To determine the concentration of bacteria in the biofilm, the pipe was agitated with 14 mL of drinking water in the respective pipes. This small volume was used because the emphasis was on the biofilm and not the bulk water phase. It was assumed that most, if not all, of the bacteria present would be released into this volume of water. For each pipe, diluted solutions were prepared from the 14 mL water. The enumeration procedure for total coliform, E. coli and HPC bacteria were the same as those described for the water phase above.
3. Results and Discussions
3.1. Heterotrophic Plate Count (HPC) Bacteria
The results of the study are presented in Tables 3-6. For the HPC bacteria, the errors of the mean values (s) range from 3.0% - 9.8% (except two means values whose errors are above 20%), which fall within the range indi-
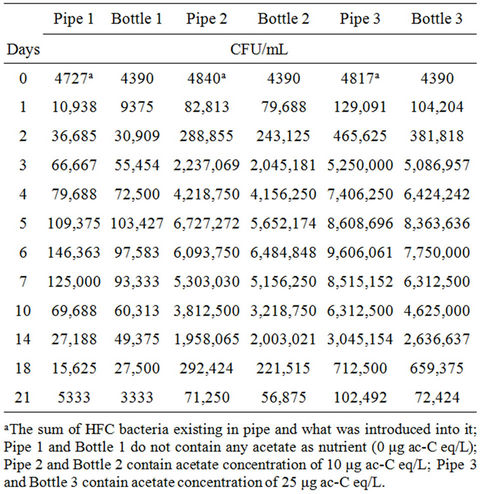
Table 3. Average concentrations of HPC bacteria in response to various acetate concentrations in pipes and bottles at 37˚C for maximum 21 days retention time of water.
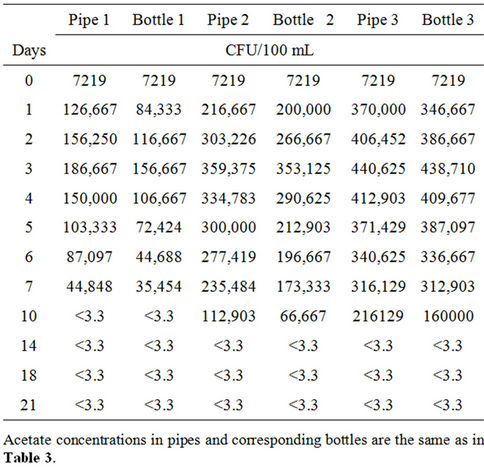
Table 4. Average concentrations of total coliform in response to various acetate concentrations in pipes and bottles at 37˚C for maximum 21 days retention time of water.
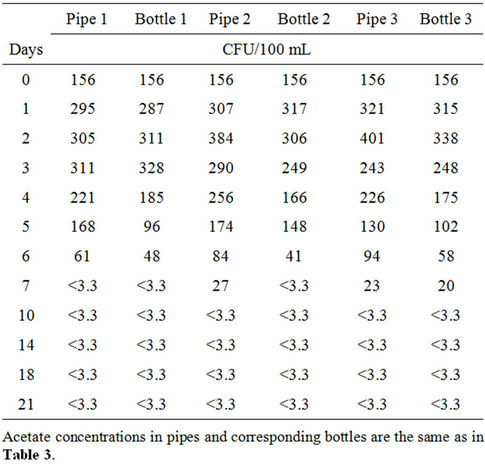
Table 5. Average concentrations of E. coli in response to various acetate concentrations in pipes and bottles at 37˚C for maximum 21 days retention time of water.
cated by Niemelä [14]. The results obtained show a general increase in bacterial concentration after the introduction of the nutrient. In pipe 1, the bacteria increased 2.5 fold after 24-hour residence time (Table 3).
On reaching its peak after six days (Figure 1(a)), the bacteria had multiplied 33 times compared to the dose initially introduced. There was a gradual decrease in bacterial population afterwards, until it dropped to about 1.2 times the initial concentration. Similarly, concentrations of 10 μg ac-C eq/L (pipe 2) and 25 μg ac-C eq/L (pipe 3) respectively resulted in HPC bacterial growth by 19 and 29 times the initial concentration after 24- hour residence time in the pipes. There was a continuous growth thereafter until maximum concentrations of 6.7 × 10⁶ CFU/mL and 9.6 × 10⁶ CFU/mL were attained (Table 3), respectively representing 1.5 × 10³ and 2.2 × 10³ times the initial concentration. It is interesting to note that on reaching their respective peaks, bacteria in pipes 2 and 3 with acetate concentrations of 10 μg ac-C eq/L and 25 μg ac-C eq/L respectively, had grown 46 and 65 times more than those in pipe 1 with no nutrients.
The results show that increased nutrient concentration corresponds to higher growth rate and subsequent increase in bacterial levels. In all the cases, the HPC bacteria growth reached its peak on days 5 and 6, by which time all the acetate might have been consumed. The maximum yield (Ymax) obtained in pipes with acetate concentrations of 10 μg ac-C eq/L and 25 μg ac-C eq/L were 6.7 × 10¹⁴ CFU/g ac-C and 3.8 × 10¹⁴ CFU/g ac-C respectively.
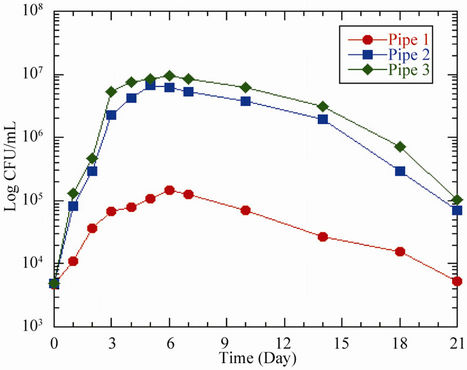 (a)
(a)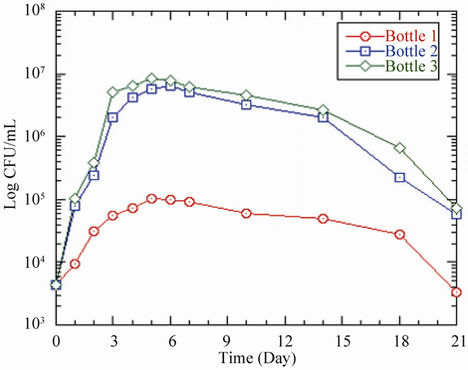 (b)
(b)
Figure 1. Response of HPC bacteria to different acetate concentrations in (a) pipes and (b) bottles at 37˚C. Pipe 1/Bottle 1 (0 μg ac-C eq/L), Pipe 2/Bottle 2 (10 μg ac-C eq/L) and Pipe 3/Bottle 3 (25 μg ac-C eq/L).
The HPC bacteria in the control bottles responded somewhat the same way as those in the pipes (Figure 1(b)). After 24 hours residence time, the bacteria increased from 4390 CFU/mL to 9.4 × 10⁴ CFU/mL, 8.0 × 10⁵ CFU/mL and 1.0 × 10⁶ CFU/mL for acetate concentrations of 0 μg ac-C eq/L, 10 μg ac-C eq/L and 25 μg ac-C eq/L respectively. The maximum growth of 1.0 × 10⁵ CFU/mL, 6.5 × 10⁶ CFU/mL and 8.4 × 10⁶ CFU/mL respectively was attained on days 5 and 6, representing growth factors of 23, 1.5 × 10³ and 1.9 × 10³ respectively (Table 3).
The acetate concentrations in bottles 2 and 3 produced maximum yields (Ymax) of 6.5 × 10¹⁴ CFU/g ac-C and 3.4 × 10¹⁴ CFU/g ac-C respectively. According to Boe-Hansen [15], the yield of indigenous bacteria is within the range of 4.1 × 10¹² CFU/g ac-C and 1.32 × 10¹³ CFU/g ac-C. Compared to what is reported in literature [15], our values are slightly higher by a factor of about 102. However, bacteria growth in the pipes was comparatively higher than the bottled samples by an average factor of 1.2. The observed difference in growth might have been caused by the biofilm in the pipes. The growth in pipe 1 could be attributed to the use of existing substrate in the pipe by bacteria as source of energy, whereas the observed growth in pipes 2 and 3 could be ascribed to the bacteria’s ability to use the available nutrients to build more cells and as source of energy for growth [16]. The biofilm may provide additional organic and inorganic compounds for the bacteria to grow and later be released to the water phase. The growth in bottle 1 could be attributed to two factors, namely; 1) higher water temperature [17,18] and 2) release of dead cells into the water that were hydrolyzed and used by other bacteria for growth. In all the scenarios described above, the decline in the curves shows a decrease in the growth rate of the bacteria after a certain time. The conditions in the bottles were such that, there were no biofilms to accommodate the bacteria and that the decline could be caused by the possible death of those bacteria that could not survive. In the case of the pipes, the depletion of the nutrient in the water phase might have caused the bacteria to migrate to the biofilm.
3.2. Total Coliforms
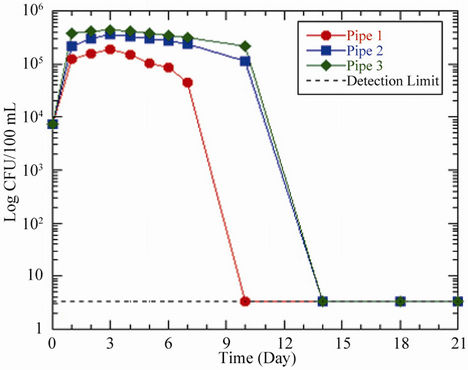
The initial coliform concentration in each pipe or bottle was 7.2 × 10³ CFU/100 mL. From 0 to 24 hours, the coliform bacteria in the pipes increased to 1.3 × 10⁵ CFU/100 mL, 2.2 × 10⁵ CFU/100 mL and 3.7 × 10⁵ CFU/100 mL respectively for acetate concentrations of 0 μg ac-C eq/L, 10 μg ac-C eq/L and 25 μg ac-C eq/L, and then increased at different rates until attaining maximum growths of 1.9 × 10⁵ CFU/100 mL, 3.6 × 10⁵ CFU/100 mL and 4.4 × 10⁵ CFU/100 mL respectively on day 3 (Table 4, Figure 2(a)). At their peak growths, the coliform bacteria had grown by factors of 26, 50 and 61 respectively, compared to the initial concentration. Maximum coliform yields were respectively 3.6 × 10¹¹ CFU/g ac-C and 1.8 × 10¹¹ CFU/g ac-C for 10 μg ac-C eq/L and 25 μg ac-C eq/L. This was followed by a decline in coliform levels.
The bottles also showed similar trends like the pipes, with a steady increase from an initial coliform concentration of 7.2 × 10³ CFU/100 mL to peak levels of 1.6 × 10⁵ CFU/100 mL, 3.5 × 10⁵ CFU/100 mL, and 4.4 × 10⁵ CFU/100 mL respectively for 0 mg ac-C eq/L, 10 μg ac-C eq/L and 25 μg ac-C eq/L (Table 4 and Figure 2(b)). These growth patterns resulted in maximum yields of 3.5 × 10¹¹ CFU/g ac-C and 1.8 × 10¹¹ CFU/g ac-C in bottles 2 and 3 respectively. After attaining the maximum growth on day 3, there was a continuous decline in the growth.
In both pipes and bottles, the decline in coliform concentration continued until no coliform was detected in
 (a)
(a)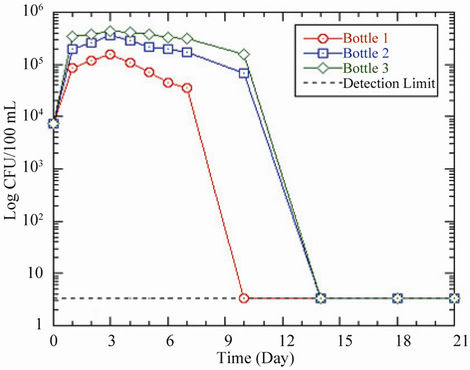 (b)
(b)
Figure 2. Changes in coliform concentration as a function of residence time in (a) pipes and (b) bottles at 37˚C. Acetate concentrations in pipes and bottles are the same as in Figure 1.
the water phase from day 10 for pipe 1/bottle 1, and day 14 for pipe 2/bottle 2 and pipe 3/bottle 3 (Table 4 and Figure 2). However, in situations where the bacteria concentration fell below the detection limit of 3.3 CFU/100 mL, the latter was used in the graphical representation.
A comparison of the pipes and bottles revealed a slightly higher growth in the pipes than in the bottles by an average factor of 1.2. Similarly, the decrease in coliform levels was more pronounced in the bottles than the pipes. These observed trends were probably due to the presence of biofilm which initially enhanced the growth and subsequently sustained it in the pipes. The observed bacterial growth in pipe 1, which did not contain any acetate, could be explained by the higher water temperature [11,17,18], until the bacteria could no longer withstand this effect and then began to die, resulting in the declining pattern of the growth. The growth patterns of total coliform in pipes 2 and 3 were most likely influenced by the combined effects of temperature and nutrient. The higher acetate concentration probably facilitated the growth of coliform bacteria in both the pipes and the bottles. The results support the findings by LeChevallier [19] and LeChevallier et al. [20] who reported that acetate is utilized by coliform bacteria to produce new cellular material and as energy source for survival and growth. However, the bacteria are able to grow in the biofilm even if nutrient concentration is low [21].
3.3. E. coli
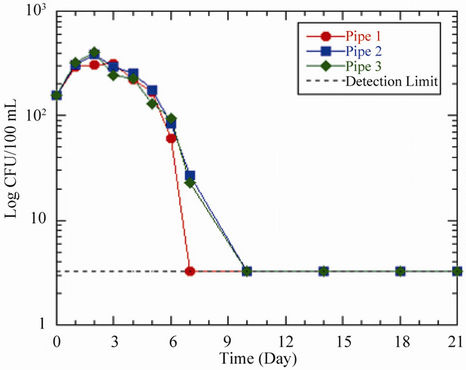
Prior to the analysis, the initial E. coli concentration in each pipe and bottle was 156 CFU/100 mL. In situations where enumeration did not yield any positive E. coli, a detection limit of 3.3 CFU/100 mL was used to plot the curves. After 2 - 3 days residence time, the results showed an increase in E. coli concentration in the pipes from 156 CFU/100 mL to maximum concentrations of 311 CFU/100 mL, 384 CFU/100 mL and 401 CFU/100 mL respectively for acetate concentrations of 0 μg ac-C eq/L, 10 μg ac-C eq/L and 25 μg ac-C eq/L (Table 5 and Figure 3(a)). The corresponding maximum yields of 3.1 × 10⁸ CFU/g ac-C and 1.3 × 10⁸ CFU/g ac-C for pipes 2 and 3, respectively were obtained. In all the scenarios, the bacteria showed an average increment of 2 times the initial number before reaching their respective peaks. Just like the other figures already discussed, maximum growth was followed by a decline in growth at different rates until no E. coli was detected in the water phase on day 7 and beyond except for pipes 2 and 3, which recorded coliform concentrations on day 7.
The growths of E. coli in the bottles were comparable to those in the pipes. Bottles with concentrations of 10 μg ac-C eq/L and 25 μg ac-C eq/L recorded an average peak growth of 249 CFU/100 mL on day 3, representing maximum yields of 2.5 × 10⁸ CFU/g ac-C and 9.9 × 10⁷ CFU/ g ac-C respectively. In pipe 1/bottle 1 and pipe 3/bottle 3, the peak growths in the bottles were 17 CFU/100 mL and 5 CFU/100 mL respectively more than those in the pipes (Table 5). This could be explained by the fact that the HPC bacteria present in the pipes were probably competing with the E. coli for the available substrate. This is because the concentrations of HPC bacteria were higher than that of E. coli from days 1 - 3 (Figures 3(a), (b)), indicating that the conditions favored the former than the latter in the pipes whilst the reverse occurred in the bottles.
Once the bacteria had attained their respective maximum growths and the nutrient was most likely totally consumed, there was a decline in the concentrations of the bacteria, probably due to starvation which subsequently led to the death of bacteria that could not survive the stress. However, the decline in bacteria concentration was
 (a)
(a) (b)
(b)
Figure 3. Changes in E. coli concentration as a function of residence time in (a) pipes and (b) bottles at 37˚C. Acetate concentrations in pipes and bottles are the same as in Figure 1.
more pronounced in the pipes/bottles with acetate concentration of 0 μg ac-C eq/L, and to a lesser extent 10 μg ac-C eq/L than in 25 μg ac-C eq/L (Figures 3(a), (b)). This indicates that the latter scenario had considerable amount of acetate present for the bacteria to thrive on and thus prolonged their survival in the pipe. Comparatively, the growth rates in the pipes were higher than those in the control bottles, except for the peak values for acetate concentrations of 0 μg ac-C eq/L and 10 μg ac-C eq/L (Table 5) where the reverse was observed.
3.4. Bacteria Survival in Biofilm Compared to the Water Phase
In drinking-water distribution system, bacteria are known to move to the biofilms [21,22], which are dominated by microbial cells and their excretions [23], and therefore appear to be more nutritive environments for such bacteria. In this study, samples taken and analyzed on the last day of the experiment revealed a significantly higher bacterial count in the biofilm as compared to the bulk phase. For acetate concentrations of 0 g ac-C eq/L, 10 g ac-C eq/L and 25 g ac-C eq/L, there were respectively 10, 7 and 12 times more HPC bacteria in the biofilm than in the water phase. Thus, after 21 days, there was an average of 10 times more HPC bacteria in the biofilm compared to the water phase. Similarly, coliform bacteria were higher in the biofilm than the water phase by factors of 172, 192 and 231 respectively. In contrast, E. coli bacteria were not detected in both the biofilm and the water phase (Table 6). According to Rompre et al. [3] and Reynolds [24], high HPC bacteria growth is likely to interfere in the analysis of E. coli, resulting in false low numbers, and this could explain why E. coli was not detected in both the water phase and the biofilm since the HPC might have overshadowed the presence of the E. coli.
Total HPC bacterial count in the biofilm ranged between 1.2 × 10⁴ CFU/cm2 and 2.7 × 10⁵ CFU/cm2. The lower end of the range is consistent with that of LeChevallier [19] who showed that HPC densities associated with a variety of pipe surfaces range between
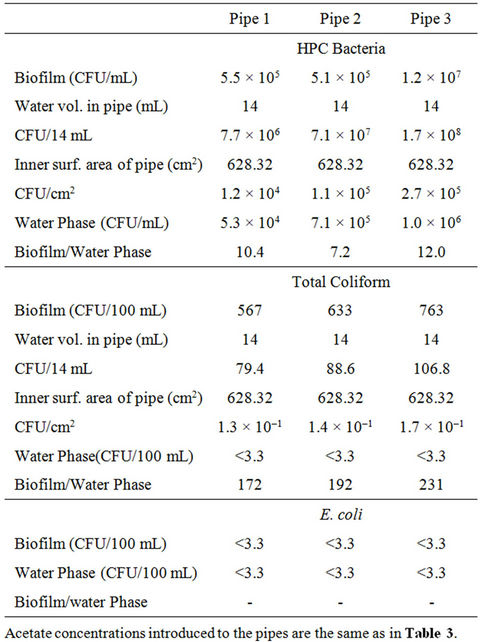
Table 6. Nutrient effect on the survival of bacteria in the water phase and biofilm in pipes at 37˚C on day 21.
1.0 × 10⁴ bacteria/cm2 and 4.7 × 10⁴ bacteria/cm2. Coliform bacterial count ranged from 1.3 × 10⁻¹ bacteria/cm2 to 1.7 × 10⁻¹ bacteria/cm2 (Table 6).
The presence of organic material and algae in the biofilm probably enhanced the growth of these bacteria [11], indicating that there was preferential bacteria growth in the biofilm [21]. The high numbers of background heterotrophic bacteria were probably responsible for the decreasing coliform recovery by membrane filter [3,9,25]. These authors indicated that high numbers of HPC bacteria might also interact in the analysis of coliform bacteria and could possibly be responsible for the non-detection of E. coli in both the water phase and the biofilm.
The results of this experimental study corroborate that of LeChevallier [19] who discovered significant bacterial growth in distribution systems occurring at assimilable organic carbon (AOC) levels between 10 μg ac-C eq/L and 50 μg ac-C eq/L. Boe-Hansen [15] also reported considerable microbial growth observed at AOC concentrations less than 10 μg ac-C eq/L. According to Szewzyk et al. [23], a potential source of degradable organic carbon in drinking-water systems is the use of inappropriate materials such as galvanized pipes, tubes and fittings and the release of organic or inorganic compounds that support the growth of heterotrophic bacteria or fungi. The growth could also be due to the possibility of the biofilms releasing indicator organisms and heterotrophic bacteria into the water phase in the pipes [26]. As was discovered in the present study, Szewzyk et al. [23] reported that the depletion of the nutrient in the water phase in pipes causes bacteria to migrate to the biofilm, which is dominated by organic and inorganic compounds, making it ideal habitats for the bacteria to survive and even grow. However, the death of bacteria in the pipes could also be ascribed to environmental stress such as starvation which eventually caused the bacteria concentration to decline [15].
Generally, for all the bacteria under investigation, significant growth was recorded in pipe 1 and bottle 1 even though no nutrient was introduced to them. This observation can be attributed to the temperature [20] and the presence of substrate in the pipes. Thus, the biofilm provides additional nutrients and favorable conditions for the bacteria, thereby enhancing the growth rate in the pipe compared to the bottle, which has no biofilm. In both cases, bacteria that were not able to survive the temperature and starvation perhaps died and their cells were probably used as nutrients for surviving bacteria to live on. Furthermore, the transfer of cells from the water phase to the inner surface of the pipe causes equilibrium to be reached between the amount of bacteria in the water phase and on the surfaces. The end result is a detachment process influenced by biological factors such as cell motility within the biofilm, synthesis and release of extracellular polymeric substances (EPS) degrading enzymes, cell growth rate, grazing activity and cell death/ lysis [15]. The detached bacteria from the surface are detected in the water phase as suspended bacteria, thereby increasing the bacterial population. This observation is buttressed by the findings of Camper et al. [13].
Unlike the conditions under which this experiment was conducted, if the sources and mechanisms that introduce these bacteria into drinking water pipes in real time situations are not contained, the bacteria will continue to thrive in the system, even in the water phase. As a result, there may not be a decline in bacterial population with time, contrary to what was observed in this study. It is therefore strongly recommended that drinking water providers put the necessary measures in place to ensure that cross connections are continually checked to prevent contamination from surrounding soil and water bodies. Furthermore, the mechanisms that facilitate the entry of disease-causing viruses, bacteria and protozoa into distribution systems, such as poor maintenance practices, long retention times, and the presence of nutrients should be strictly monitored and regularly checked to avert any contamination and regrowth of coliform and HPC bacteria in the systems.
4. Conclusion
The main objective of this study was to investigate the impact of nutrient on coliform and HPC bacteria in drinking water pipes. The study has demonstrated the ability of nutrients, in the form of sodium acetate to sustain bacterial growth in drinking water pipes. Our results show that nutrients were used up by bacteria for cell building and growth. This led to an increase in bacterial population that could be detrimental to the quality of the drinking water. Once the nutrient was totally consumed and became depleted in the bulk phase, the bacterial population reached a near stationary level and subsequently declined. The results further demonstrate the migration of bacteria from the water phase to the biofilm since the latter provided a more suitable environment and safe haven for the bacteria to thrive on, thus promoting their growth and prolonging their survival in the system. Consequently, degradation of water quality is likely to last for a much longer time than anticipated. It can also be concluded from this study that the absence of E. coli and coliform bacteria in water does not preclude the existence of these bacteria in drinking water distribution networks.
5. Acknowledgements
The authors are thankful to Hans-Jørgen Albrechtsen for his constructive criticism and thought-provoking suggestions which helped improve the contents of this paper.
REFERENCES
- P. Payment, J. Siemiatycki, L. Richardson, G. Renaud, E. Franco and M. Prevost, “A Prospective Epidemiological Study of Gastrointestinal Health Effects Due to the Consumption of Drinking Water,” International Journal of Environmental Health Research, Vol. 7, No. 1, 1997, pp. 5-31. doi:10.1080/09603129773977
- World Health Organization, “Guidelines for DrinkingWater Quality. Health Criteria and Other Supporting Information,” International Programme on Chemical Safety, Vol. 2, 1996.
- A. Rompre, P. Servais, J. Baudart, M.-R. de-Roubin and P. Laurent, “Detection and Enumeration of Coliforms in Drinking Water: Current Methods and Emerging Approaches,” Journal of Microbiological Methods, Vol. 49, 2002, pp. 31-54. doi:10.1016/S0167-7012(01)00351-7
- A. Singh and G. A. McFeters, “Detection Methods for Waterborne Pathogens,” In: R. Mitchell, Ed., Environmental Microbiology, Wiley-Liss, Inc., New York, 1992.
- M. J. Allen and S. C. Edberg, “The Public Health Significance of Bacterial indicators in Drinking Water. In: Coliform and E. coli: Problem or Solution?” Special Publications of the Royal Society of Chemistry, Vol. 191, 1997, pp. 176-181.
- E. J. Fricker and C. R. Fricker, “Use of the Presence Absence Systems for the Detection of E. coli and Coliforms from Water,” Water Research, Vol. 30, No. 9, 1996, pp. 2226-2228. doi:10.1016/0043-1354(96)00082-6
- C. L. Moe, “Waterborne Transmission of Infectious Agents,” In: C. J. Hurst, G. R. Knudsen, M. J. Mclnerney, L. D. Stetzenbach and M. V. Walter, Eds., Manual of Environmental Microbiology, American Society for Microbiology, Washington DC, 1997, pp. 136-152.
- S. C. Edberg, S. Kops, C. Kontnick and M. Escarzaga, “Analysis of Cytotoxicity and Invasiveness of Heterotrophic Plate Count Bacteria (HPC) Isolated from Drinking Water on Blood Media,” Journal of Applied Microbiology, Vol. 82, No. 4, 1997, pp. 455-461. doi:10.1046/j.1365-2672.1997.00134.x
- I. Tryland and L. Fiksdal, “Rapid Enzymatic Detection of Heterotrophic Activity of Environmental Bacteria,” Water Science and Technology, Vol. 38, No. 12, 1998, pp. 95- 101. doi:10.1016/S0273-1223(98)00808-7
- M. Brandt, J. Clement, J. Powell, R. Casey, D. Holt, N. Harris and C. Ta, “Managing Distribution Retention Time to Improve Water Quality, Phase I,” AwwaRF, Denver, 2004.
- L. Evison and N. Sunna, “Microbial Regrowth in Household Water Storage Tanks,” Journal of American Water Works Association, Vol. 93, No. 9, 2001, pp. 85-94.
- Miljøstyrelsen, “Det Intensive Måleprogram for de Regnvandsbetingede Udløb,” Report No. 43, 1997.
- A. K. Camper, W. L. Jones and J. T. Hayes, “Effect of Growth Conditions and Substratum Composition on the Persistence of Coliforms in Mixed-Population Biofilms,” Applied and Environmental Microbiology, Vol. 62, 1996, pp. 4014-4018.
- S. Niemelä, “Statistical Evaluation of Results from Quantitative Microbiological Examinations,” Nordic Committee on Food Analysis, Report No. 1, 1983.
- R. Boe-Hansen, “Microbial Growth in Drinking Water Distribution Systems,” Unpublished Ph.D. Thesis, Environment & Resources, Technical University of Denmark, 2001.
- F. M. Qureshi, U. Badar and N. Ahmed, “Biosorption of Copper by a Bacterial Biofilm on a Flexible Polyvinyl Chloride Conduit,” Applied and Environmental Microbiology, Vol. 67, No. 9, 2001, pp. 4349-4352. doi:10.1128/AEM.67.9.4349-4352.2001
- P. Laurent, P. Servais, M. Prevost, D. Gatel and B. Clement, “Testing the SANCHO Model on Distribution Systems,” Journal of American Water Works Association, Vol. 89, No. 7, 1997, pp. 92-103.
- M. Prevost, A. Rompre, J. Coallier, P. Servais, P. Laurent, B. Clement and P. Lafrance, “Suspended Bacterial Biomass and Activity and Full-Scale Drinking Water Distribution Systems: Impact of Water Treatment,” Water Research, Vol. 32, No. 5, 1998, pp. 1393-1406. doi:10.1016/S0043-1354(97)00388-6
- M. W. LeChevallier, “Coliform Regrowth in Drinking Water,” Journal of American Water Works Association, Vol. 82, 1990, pp. 74-86.
- M. W. LeChevallier, N. J. Welch and J. B. Smith, “FullScale Studies of Factors Related to Coliform Regrowth in Drinking Water,” Applied and Environmental Microbiology, Vol. 62, No. 7, 1996, pp. 2201-2211.
- J. C. Block, L. Mouteaux, D. Gatel and D. J. Reasoner, “Survival and Growth of E. coli in Drinking Water Distribution Systems,” Special Publications of the Royal Society of Chemistry, Vol. 191, 1997, pp. 157-167.
- S. Fass, M. L. Dincher, D. J. Reasoner, D. Gatel and J.-C. Block, “Fate of Escherichia coli Experimentally Injected in a Drinking Water Distribution Pilot System,” Water Research, Vol. 30, No. 9, 1996, pp. 2215-2221. doi:10.1016/0043-1354(96)00100-5
- U. Szewzyk, R. Szewzyk, W. Manz and K.-H. Schleifer, “Microbiological Safety of Drinking Water,” Annual Review of Microbiology, Vol. 54, 2000, pp. 81-127. doi:10.1146/annurev.micro.54.1.81
- K. A. Reynolds, “Bacteria in Drinking Water: Public Health Implications?” Water Conditioning & Purification Magazine, Vol. 44, No. 7, 2002. http://www.wcponline.com/column.cfm?T=T&ID=1631&AT=T
- M. W. LeChevallier and G. A. McFeters, “Interactions between Heterotrophic Plate Count Bacteria and Coliform Organisms,” Applied and Environmental Microbiology, Vol. 49, 1985, pp. 1338-1341.
- A. K. Camper, “Biofilms in Drinking Water Treatment and Distribution,” In: L. V. Evans, Ed., Biofilms: Recent Advances in Their Study and Control, Harwood Academic Publishers, Amsterdam, 2000, pp. 311-332.
NOTES
*Corresponding author.