Smart Grid and Renewable Energy
Vol. 4 No. 1 (2013) , Article ID: 28124 , 5 pages DOI:10.4236/sgre.2013.41007
Experimental Research on Monomial Cooling Measure of Greenhouse in Summer
![]()
College of Information and Engineering-Technology, Sichuan Agricultural University, Ya’an, China.
Email: hjsicau@126.com
Received January 19th, 2013; revised February 19th, 2013; accepted February 21st, 2013
Keywords: Glasshouse; Cooling Measure; Temperature; Humidity
ABSTRACT
This paper describes several main monomial cooling methods of greenhouse in summer, including natural ventilation, mechanical ventilation, wet curtain cooling, external sun-shading etc., as well as analyzes the change law of the environment on temperature and humidity in greenhouse. The result shows that the four cooling methods stated above make the temperature gradients between internal and external respectively 1.1˚C, 0.4˚C, −2.6˚C and −1.2˚C, so it is obvious that the cooling effect of wet curtain cooling is the optimum; and the internal and external humidity difference is respectively: −13%, −6%, 8% and 1%.
1. Introduction
With the continuous improvement of science, technology and the modernization of agricultural production, agricultural facilities in China boom rapidly. Greenhouse, as the main type of agricultural facilities, has significant social and economic benefits, and it has been widely used in our country. But there are also a series of problems in the application process, especially for the cooling problem of greenhouse in summer that has always been the concern of agricultural scientific workers. July and August are the hottest months in Chongqing Municipality throughout the year. Mean monthly temperature is about 27˚C - 28˚C [1], and the existence of “greenhouse effect” makes the indoor temperature reach more than 50˚C. Crops are completely unable to survive, resulting in making greenhouse in an “idle” state over a third of time. The greenhouse in summer must be considered to take corresponding cooling measures to organize normal production, so as to improve the utilization rate. And it can provide the crops a good growth environment for achieving a high yield, a high quality, and a high efficiency of the intensive mode of production, so to meet the needs of people’s life, and to improve the land utilization rate.
2. Experiment Conditions and Test Scheme
2.1. Experiment Conditions
This experiment is proceeded in water-saving irrigation efficiency demonstration laboratory of College of Engineering and Technology, Southwest University. The laboratory is four straight across Venlo type, which is a large high-grade glasshouse with one cross and three ridges. As Figure 1 shows, the greenhouse runs north to south, with a total area of 9.6 m/span × 4 span × 36 m = 1382.4 m2. It is divided into four areas: the first area is vegetable area, the second is flower area, the third area is for fruit nursery, and the last is for nursery garden. Each area is 9.6 m × 36 m = 345.6 m2, and there is a central control room in front of flower area. All the top and the board of the greenhouse are covered with 4 mm domestic high quality float glass. Light transmittance is greater than 90%; the coefficient of heat transfer K = 6.6 W/ (m2·˚C); the greenhouse is fixed by special aluminum alloy; it is sealed by rubber strip.
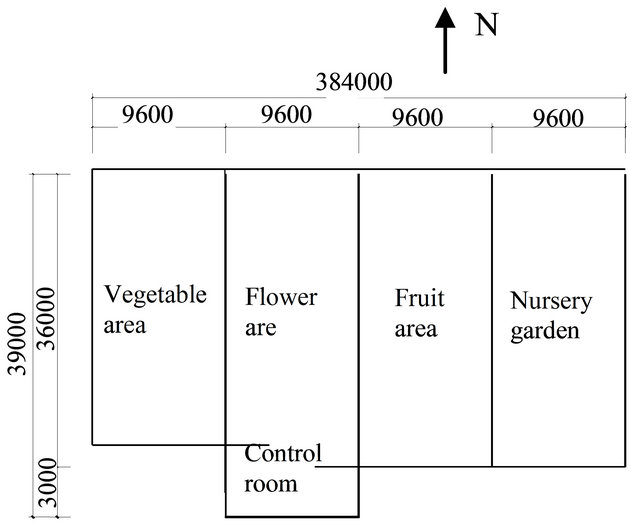
Figure 1. The ichnography of experiment greenhouse.
2.2. Test Instruments and Equipments
1) Greenhouse with natural ventilation system, mechanical ventilation system, wet curtain cooling system and external shading system [2].
2) 16 numbers of thermocouple sensors, one placed outdoor, the other fifteen placed indoor. They are located in three different planes. Thermal performance test system of TRM-2 Solar energy water heater (developed by Jinzhou Sunshine Technology Development Company) is used to record temperature automatically. The recording tome is setted for every 30 minutes.
3) Three wet and dry bulb thermometers are setted, 1 placed outdoor, the other 2 placed indoor, which are used to determine the dry bulb temperature, wet bulb temperature and relative humidity outdoors and indoors.
4) Computer is mainly used for the derivation of data. And some related softwares are also used for data processing.
2.3. Test Arrangement
This test is conducted in the second working place, the area—flower area, as is shown in Figure 2. Greenhouse is divided into two symmetrical work areas by corridor, and six observation positions are set up on the right side of the horizontal plane area for analyzing the temperature distribution rule in the horizontal plane during the cooling process indoors. And in the position 3, a temperature sensor is placed underground with a distance of 20 cm from the ground, which is used to measure the geothermal change rule in the whole test process. An observation point 7 is placed outdoors, which is used for monitoring the change of outdoor temperature. In addition, in the greenhouse there placed two dry wet bulbs, and out of the greenhouse there placed dry wet bulb, which are used to measure the relative humidity change rules outdoors and indoors.
Figure 3 shows the map of temperature vertical distribution of each point. Three planes are set up in vertical direction. The third plane is 500 mm distance from the ground. The first plane is 500 mm distance from the gutter. They are used for measuring the variation of tem-
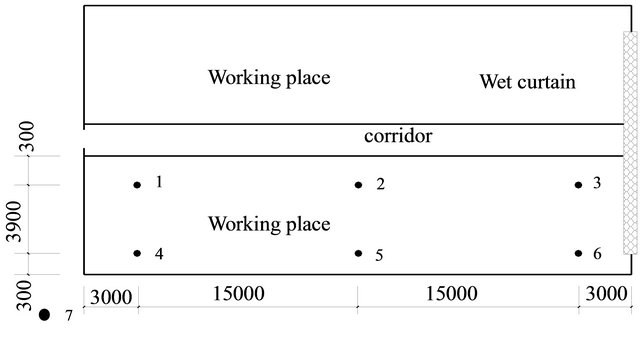
Figure 2. Horizontal distribute chart of every observation.
perature in vertical direction. All the temperature data are the automatic record of thermal performance test system of TRM-2 type solar energy water heater by every 30 minutes. The relative humidity is recorded by worker every 30 minutes.
3. Test Results and Analysis
3.1. Natural Ventilation Cooling Effect
Before the test, the greenhouse is closed. At 9:00 a.m., the indoor temperature reaches 34˚C, and the outdoor temperature reaches 31.6˚C. Open the axial flow shutters, wet curtain insect nets and top windows for natural ventilating, as shown in Figure 4. After the ventilation, the temperature of every plane in the greenhouse rises slowly, but the rise speed of temperature is slower than outdoor. After 10:00 a.m., the increase trend of temperature is basically same as outdoors. To about 13:00 p.m., temperatures of each plane all reach the maximum. They are about 7.9˚C, 5.4˚C, 5.3˚C higher than the temperature outdoors. With the cooling down outdoors, the temperatures of each plane indoors slow declining as well. By the end of the test, the indoor minimum temperature is 37.4˚C, which is beyond the temperature range of normal
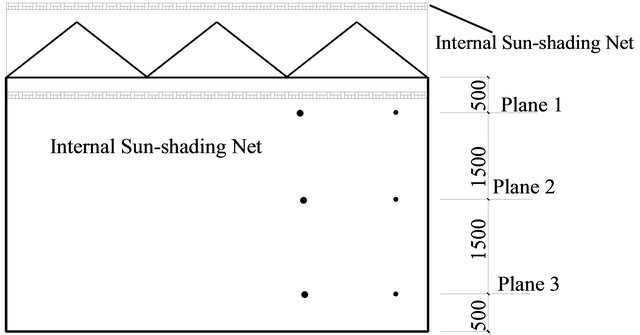
Figure 3. The vertical distribution of every measuring point in flower area.
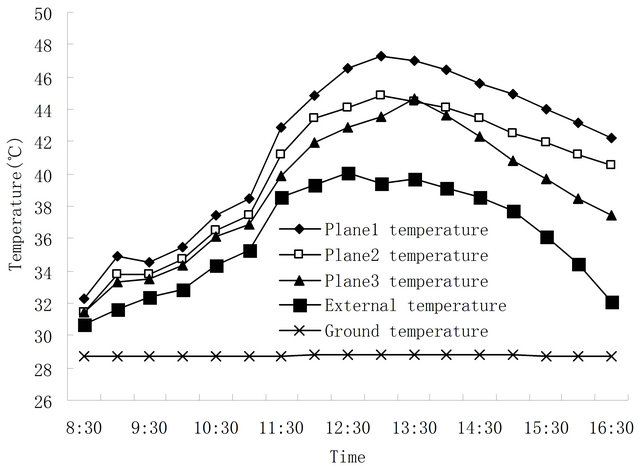
Figure 4. The change of temperature in natural ventilation cooling process.
growth of crops. During the whole process of natural ventilation, the humidity outdoors remains a relatively high level. While the relative humidity indoors changes obviously, which presents a trend of gradual declining, and the lowest point 33% appears at 14:30 p.m. After that it increases with the rising of humidity outdoors, as is shown in Figure 5.
The analysis above shows that it is impossible to use natural ventilation to reduce the temperature in greenhouse to achieve the demand of crop growth in the summer under such a climate situation of hot and humid in Chongqing area. It must adopt other ways to achieve the purpose of cooling.
3.2. Mechanical Ventilation and Cooling Effect
Making axial flow as power machine to extract the air indoors outside to form negative pressure, it can realize forcing gas exchange between indoors and outdoors [3]. Although this method consumes certain energy, the ventilation effect is reliable, and it’s easy to achieve regulating and controlling according to the needs. While, the range of temperature controlling is limited, and it can only control to equal the internal and external temperatures, as is shown in Figure 6. Through the positive action of the mechanical ventilating, the air exchange degree between indoors and outdoors is strengthened. Before 12:00 a.m. and after 16:00 p.m., the temperature of plane 2 and 3 are basically the same as the temperature outside. From 12:00 to 16:00 p.m., due to the enhancement of sun radiation, the temperature of the two planes above are higher than the air temperature outside about 2˚C. Plane 1, near the roof of the greenhouse, as its air exchange effect is weak, temperature here is higher than the temperature outdoors during the whole test process. And its highest temperature is up to 42.9˚C, which is 5.8˚C higher than the air temperature outside. After the
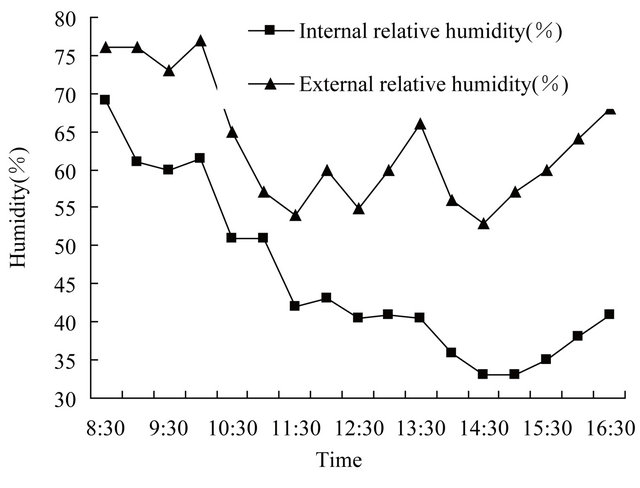
Figure 5. The change of internal and external humidity and temperature in natural ventilation cooling process.
use of mechanical ventilation, the indoor relative humidity reduces with the decrease of humidity outdoors gradually. By the time of 10:00 a.m., there appears an intersection (54%), and the humidity indoors and outdoors is equal, which is consistent with the actual fact. After words, with the increase of temperature indoors, the relative humidity presents a reducing trend, and the minimum declines to 44%, as is shown in Figure 7.
Through the analysis above, it is easy to see that there are a certain cooling effect and a dehumidifying effect through using mechanical ventilation to maintain temperature at about 35˚C when the temperature outdoors is not more than 35˚C. For the high temperature and humidity climate characteristic in Chongqing, it can be regarded as a kind of ideal cooling mode in a certain condition.
3.3. Wet Curtain Cooling Effect
Wet curtain cooling is the main cooling way of modern greenhouse [4]. It has been a mature technology, and the cooling effect is obvious, which has been widely used, as
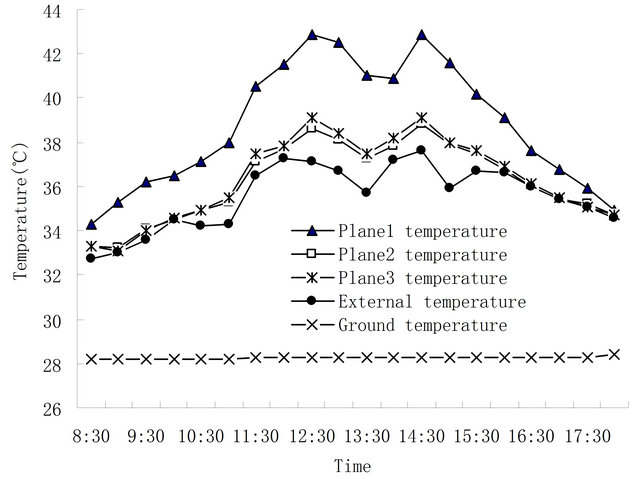
Figure 6. The change of temperature under mechanical ventilation cooling.
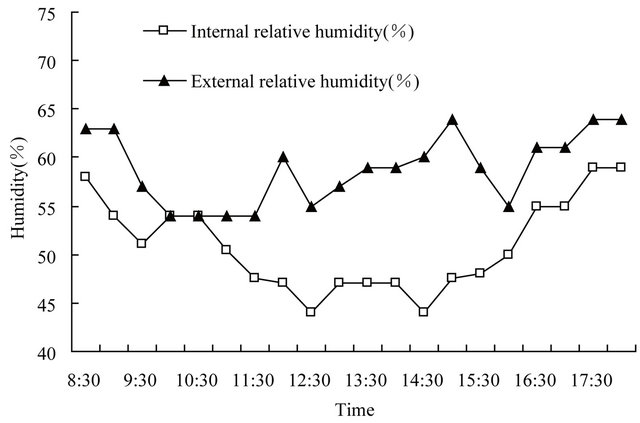
Figure 7. The change of internal and external temperature and humidity under mechanical ventilation cooling.
is shown in Figures 8 and 9. Open the wet curtain cooling system, the temperature indoors appears obviously decline. After 30 minutes, the temperature indoors drops to 31.7˚C, and at the same time, the indoor relative humidity increases from 60.5% to 75% after cooling. And the relative humidity increases by 24%. After opening the wet curtain cooling system, the temperatures of plane 2 and plane 3 are both significantly dropped below the temperature outdoors. After 9:30, the difference in temperature indoors and outdoors remains stable, and the highest temperature on the two planes is 35˚C. The cooling effect is very obvious. The temperature of plane 1 also declines, but it is higher than the outdoor temperature all the time, and the highest temperature can reach 44.6˚C.
Through the data analysis above, it shows that wet curtain cooling system has a good cooling effect, which can basically maintain temperature indoors within the scope of the crop normal growth. While, when the temperature reduces, the indoor humidity increases quickly.
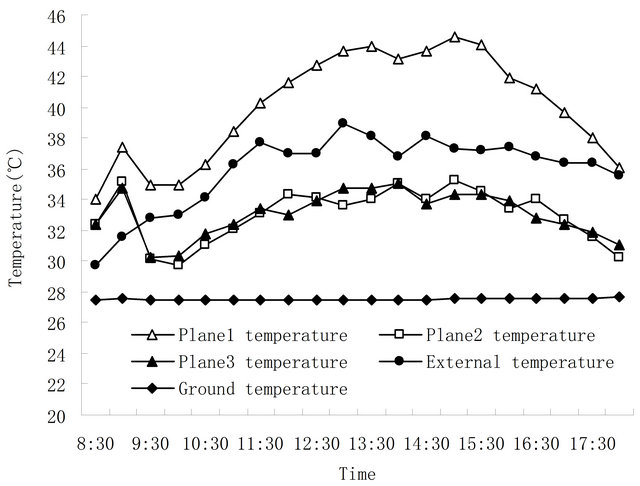
Figure 8. The change of temperature under wet curtain cooling.
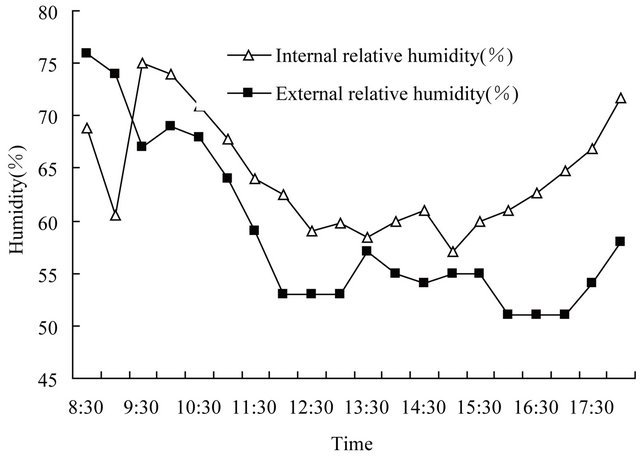
Figure 9. The change of temperature and humidity under wet pad curtain cooling.
If this condition continues for a too long time, it may cause plant diseases and insect pests. Besides, the high humidity will make open-strength degree of leaves stomata decrease, consequently inhibiting crop transpiration, making bad affects on the crops for the absorption and transport of moisture, nutrients. It can be considered to use mechanical ventilation with it in interval using, so as to achieve the purpose of dehumidification and eliminating the high humidity environment indoor.
3.4. The Cooling Effect of External Sun-Shading
According to the difference of placement, there are external sun-shading and internal sun-shading these two types of sun-shading [5]. The internal sun-shading will make a lot of heat gathered between the sun-shading net and the roof, preventing the heat indoors from dispersing and cooling in summer. So the external sun-shading is considered only to cool the temperature. There are two kinds of testing methods: one is under the condition of closing the greenhouse, unfolding the external sun-shading to collect temperature and humidity data indoors and outdoors data. Another one is to open the top window to ventilate to make the indoor and outdoor temperature and humidity in a relatively steady state, and then, unfold the external sun-shading and collect the temperature and humidity data indoors and outdoors. According to the actual situation, the first method has no real significance. Because in an airtight greenhouse, the air indoors can not circulate from the outside. Besides, the temperature indoors is very high, and crops can’t survive. It is impossible that actual greenhouse production appears this kind of circumstance. So the second method is adopted, and the test result is shown in Figures 10 and 11.
Open the top window in the greenhouse to ventilate before the test. At the time of 10:00 a.m., when the temperature and humidity indoors and outdoors have been on the condition of relative stability, the temperature indoors
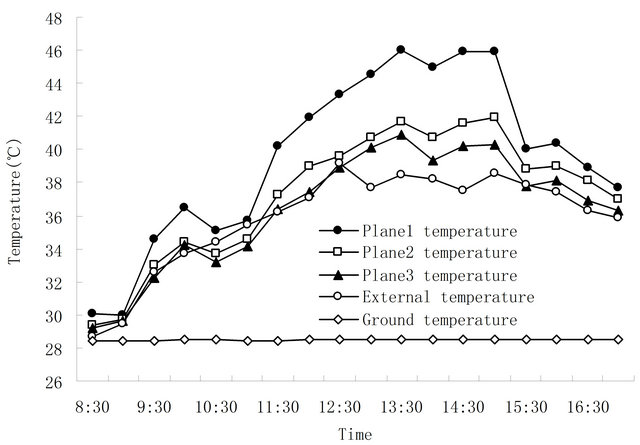
Figure 10. The change of temperature under outside sunshading.
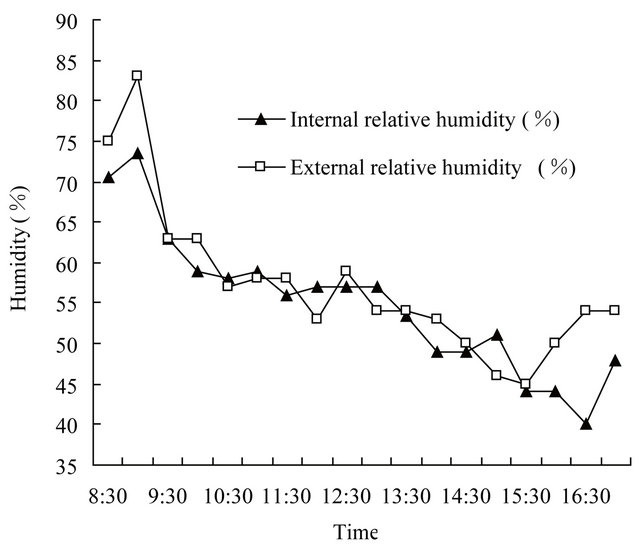
Figure 11. The temperature and humidity change indoors and outdoors under external sun-shading.
is about 35˚C and the temperature outdoor is about 33.7˚C, opening the external sun-shading and closing the top window. After the opening of the external sun-shading at 10:00 a.m., the temperature indoors of all planes drop. At the time of 10:30 a.m., the temperature of plane 1 drops from initial 36.5˚C to 35.1˚C, the temperature of plane 2 drops from initial 34.4˚C to 33.7˚C, and the temperature of plane 3 drops from initial 34.2˚C to 33.2˚C, while the temperature of outdoor is about 34.4˚C at that moment. The temperatures of both plane 2 and plane 3 are lower than that of the outdoors. The temperatures of the two planes and the outdoor don’t appear intersection until 11:30. After that, as the sun radiation enhancing, temperature indoor presents a rise tendency. Cause the effect of the external sun-shading, the humidity indoors and outdoors maintain 57% basically. In the subsequent time, both of them present alternate change trend, but the difference is small.
4. Conclusions
Tests are respectively conducted with four cooling measures of natural ventilation, mechanical ventilation, wet curtain and external sun-shading. There are some relaxation effects on the high temperature environment indoors. To further reduce the temperature in greenhouse in summer, it must be combined with cooling methods.
1) Wet curtain has the best cooling effect. The change of the temperature and humidity of the internal planes is not very influenced by the change of the eternal. Temperature in horizontal direction distributes unevenly, and it fluctuates greatly. If the air outdoors has a large relative humidity, the cooling effect will be affected a lot, and this cooling mode will make humidity indoors increase greatly, which is up to 24%, and which restrains crop transpiration. It can be considered to use mechanical ventilation by interval, so as to achieve the purpose of dehumidification and eliminating the high humidity environment indoors.
2) After opening the external sun-shading, the temperature on working planes in greenhouse can be reduced to below outdoors. And the temperatures of the working planes in horizontal distribution are well distributed, which can continue to noon. In addition, the influence to the humidity indoors is not very obvious.
3) Through using mechanical ventilation, it can strengthen the air exchange between indoors and outdoors. When the temperature outside is under 35˚C, the temperature indoors can be controlled at 35˚C or so, which can basically satisfy the needs of crop growth. At the same time, it also has a dehumidifying effect, which can be used together with other cooling system to achieve the purpose of dehumidification.
4) It is difficult to achieve the effect of cooling temperature through the natural ventilation. The methods above can be used when there exists a feeble solar radiation intensity. Only in cloudy days, it can strengthen air exchange between indoors and outdoors by natural ventilation to reduce indoor humidity.
REFERENCES
- C. W. Ma, “Agricultural Biological Environment Engineering,” China Agriculture Press, Beijing, 2005.
- J. Q. Wang, “Application of Some Cooling Measures for Greenhouse Cooling in Summer,” Transactions of the CSAE, Vol. 22, No. 9, 2006, pp. 257-260.
- C. Y. Ran, “Temperature-Decreasing Research and Use for Glass-Greenhouse in Summer,” Journal of Jilin Architectural and Civil Engineering Institute, Vol. 19, No. 4, 2002, pp. 31-34.
- B. G. Wang and X. W. Miao, “A Study on Comparison of Cooling Efficiency for the East-China Type Multi-Span Plastic Greenhouse in Summer,” Journal of Agricultural Mechanization Research, Vol. 26, No. 5, 2004, pp. 187- 193.
- J. Hu, “Cooling Technology of Modern Greenhouse in Summer,” Journal of Agricultural Mechanization Research, Vol. 29, No. 6, 2007, pp. 18-21.