Smart Grid and Renewable Energy
Vol.4 No.4(2013), Article ID:34100,13 pages DOI:10.4236/sgre.2013.44044
Investigation of Bandwidth Requirement of Smart Meter Network Using OPNET Modeler
![]()
School of Engineering and Built Environment, Faculty of Sciences, Engineering and Health, CQ University, Rockhampton, Australia.
Email: m.rahman2@cqu.edu.au, a.maungthanoo@cqu.edu.au
Copyright © 2013 M. Rahman, Amanullah Mto. This is an open access article distributed under the Creative Commons Attribution License, which permits unrestricted use, distribution, and reproduction in any medium, provided the original work is properly cited.
Received September 21st, 2012; revised January 5th, 213; accepted January 14th, 2013
Keywords: smart meter network; smart meter; router; firewall; server; communication bandwidth; propagation delay; throughput; utilization
ABSTRACT
Smart meter networks are the backbone for smart electrical distribution grid. Smart meter network requires the bidirectional communications medium and interoperability capability. As thousands of meters are interconnected in the smart meter network, it is vital to select an appropriate communication bandwidth to facilitate real-time two-way information flows and this will also allow further uptake of greenhouse-friendly technology options and enhance energy security. Optimized Network Engineering Tools (OPNET) Modeler is one of the most powerful simulation tools for the analysis of communication networks. In this paper, several models of different structured smart meter networks were developed with network parameters which were connected with different communication links such as 10 BaseT and 100 BaseT in order to measure propagation delay, throughput, and utilization of the network. It was found that the propagation delay decreases with higher bandwidth. The other network parameters, namely network utilization and network throughput were also analysed. Based on the investigation, it is recommended that the 100 BaseT communication link is suitable for the smart meter network. The outcome of this paper provided a guideline to the future smart meter network developer so as to avoid catastrophic challenges faced by some of the distribution companies.
1. Introduction
In recent years, there have been an increasing number of influences promoting the demand for the use of smallscale generation, connected to local distribution systems, which is commonly called Distributed Generation (DG). The community’s desire for an environmentally friendly electricity supply, the deregulated electricity market, constraints on the construction of new transmission lines, an increasing demand for high reliability of electricity supply, and the reduction of the use of the non-renewable fossil fuel resources, are forcing power distribution systems to use DG [1,2].
The presence of local generation units will change the power flow in the distribution system, and the distribution system can be considered as a system with bi-directional power flow [3-5]. To achieve optimization of performance, the distribution system should operate closer to their limits supported by increased network automation (monitoring and control) also known as “smart grids”. DG units supported with smart meters are the most prominent step in migrating to smart grids and this will allow the monitoring, protecting and controlling power system using Information Technology (IT) more robustly. Modern distribution companies are required to adopt smart meters in distribution systems to allow utilities and consumers to integrate DG sources of electricity into the grid, and to facilitate enhanced power delivery with information technologies to achieve improved reliability of distribution power system [6].
Utility system’s operational and commercial needs mandate the use of information technologies that are capable of providing two way information flows systems, namely smart meter networks. The smart meter network is an enabling technology to allow the integration of some critical developments into future distribution systems such as the expansion of network infrastructure to accommodate DG, penetration of IT to implement full digital control in distribution system and deployment of new applications such as system monitoring, protection and control [7]. The deployment of these applications requires up-to-date communication system in which the suppliers and the consumers could both have access to the real-time information [8]. This communication infrastructure is required to be readily available with appropriate bandwidth to allow data to be freely transferred among different devices.
In a smart meter network, thousands of data packets may cause network congestion that may add a significant latency in data transmission. At the same time, security is a major concern as smart meter networks are vulnerable to an external attack. Different kinds of firewall systems are currently integrated as a part of data security in the communication network. Basically, these firewalls check the authenticity of all the incoming and outgoing data which could add some delay in transmission and also add some additional bits into the data as checksum bits which increases the length of the total data. Therefore, few key potential risks such as bandwidth, latency and delay in smart meter networks need to be properly managed for efficient integration of smart meters into power distribution system. High delays in the network due to propagation delays may cause parts of the power distribution system to be virtually invisible and uncontrollable. Due to increasing demands for data by various utilities, research efforts have begun to make power system communication infrastructure more efficient, reliable and secure [9,10].
The analysis of smart meter network is vital to ensure that the network perform reliably. In this paper, several models of smart meter network have been developed using OPNET, simulation software to analyze the propagation delay of the different models to select suitable bandwidth of the network.
2. Importance of Smart Meter for Reliable Power Distribution System Operation
Smart meters refer to devices in which information flows in both directions. These devices open up a wide range of opportunities for utilities through up-to-date information. The new information and communication technologies (ICT) are used to change the conventional meters into smart meters for energy saving and energy security purposes [11]. The functionalities of smart metering technologies are brought together in distinct packages in this smart metering system. The significant changes in distribution system for smart meter monitoring program, and impact of smart meters in distribution systems are discussed in the following few sub-sections.
2.1. Significant changes in Distribution System for Smart Meter Monitoring Program
Adopting smart meters in distribution companies improve monitoring, and control of the system. The basic elements of a smart meter monitoring program are shown in Figure 1. It includes smart meters, a means of communication, and a power quality data warehouse. The means of communication could include fixed twisted pair cable, telephone lines, mobile phones, power line carrier, radio, fiber optic, or a combination of these [12].
The meters are capable of recording the parameters namely, voltage, current, power factor as well as others data and data warehouse are also an effective and secure means of storing data from all meters in the monitoring period. The quantity of data stored will be dependent upon the transmitted data [12]. Data are sent from the smart meter to the Power Quality Data Warehouse. A more sensible and realistic option is for each smart meter to report by exception in real time or using power quality indices for each site. However, the adoption of smart meters faces several challenges in smart distribution systems as described in the following sub-section.
2.2. Impacts of Smart Meters on Distribution Systems
The adoption of this new technology faces technical challenge which may put at risk its ability to reliably deliver power which includes:
Communication network challenges: Smart meters offer better interface technologies. As smart meters enable bi-directional communication between the customer and the utility, these devices provide access to more information than traditional meters. To facilitate robust communication between smart meter devices and a centralized control system, a high bandwidth communication channel is required to move digital data throughout the network efficiently and effectively.
Standard communication protocol: Lack of standardization of smart metering technology means that large numbers of smart meter of different types have been deployed for collecting and dispatching data and instructions, transforming the data and storing data under different communication protocols [13]. The common communication
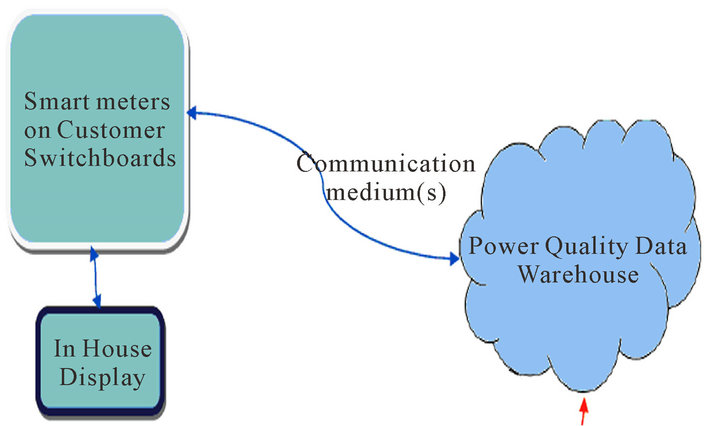
Figure 1. Smart meter monitoring program [12].
protocol throughout the network or international standards covering automatic meter data exchange can overcome this technical barrier [7].
The strategies outlined above provide a bridge to the implementation of smart metering technologies where real time data will be the best practice network.
3. Analysis of Bandwidth Requirement for Smart Meter Network
In the digital age, literally thousands of digital data are available in a single Intelligent Electronic Device (IED) and communication bandwidth should not be a limiting factor in smart meter network [14]. A broadband communications network is necessity to enable comprehensive system-wide monitoring and coordination to facilitate applications such as demand response and power quality monitoring. The present SCADA systems do not sense or control nearly enough of the components of the modern distribution system and therefore, reliable, upto-date information embedded power system, smart grid with smart meter in every consumers and server to store information in control centre is required [14].
The communications infrastructure facilitating timely and secure information flow is required for smart meter network. Over the past 35 years, there has been a substantial increase of communication speeds from 300 bps (bits per second) to digital relays that today operate at 100 Mbps [15]. Smart meter networks require a far greater degree of visibility and control devices as data collection and real time analysis become a more fundamental part of future distribution systems. Moreover, distribution systems are enhanced by large-scale application of smart meters [16,17]. At present, smart meter network allows easy broadcast of network applications from the system control centre to the many connected smart meters but only slow communications back from the connected devices to the central controller [18]. An inspection of the Victorian Automated Metering Infrastructure (AMI) functionality specification [19] shows a system that reveals a change in capability relative to the pre-existing meter infrastructure. This functionality of AMI is designed to deliver specific outcomes. Some more advanced smart grid concepts will lay beyond the capabilities of the AMI with a reasonable level of sophistication. Key restrictions are the asymmetric bandwidth of the communications channel and latency. Load control is one of the faster AMI commands. The Victorian functional specification [18,19] requires 99% of meters to respond in one minute to group commands but for individual meter commands only 90% need respond in 30 minutes. Only 2% of meters may be switched individually within a 24 hour period. Distributed generation, storage and load control would be unable to operate within the limitations of the AMI. Any communications to individual devices are potentially subject to very long delays. The management of the identified AMI functions will require the use of highly capable communications network that can provide guaranteed levels of performance with regard to bandwidth and latency. Figure 2 provides the extension of a communications and control infrastructure that currently include the existing distribution system [20]. The extension of communications coverage to the distribution system can support a variety of distribution automation functions.
Each Australian distributor faces challenge in developing a sound communications solution that will support their smart meter network aspirations. Many distributors have current programs in place to increase the level of automation and monitoring of distribution assets for reliability improvement purposes. The recently announced Australian national broadband network will provide speed in the 100 Mb/s range. It may present a possible communications solution [18].
Integration of smart meters in distribution systems requires high communication system for energy-efficient, secured and robust distribution. For this, bandwidth is a critical factor for effective operations of smart meter network in distribution system. Nonetheless, there is little research on bandwidth requirements and the propagation
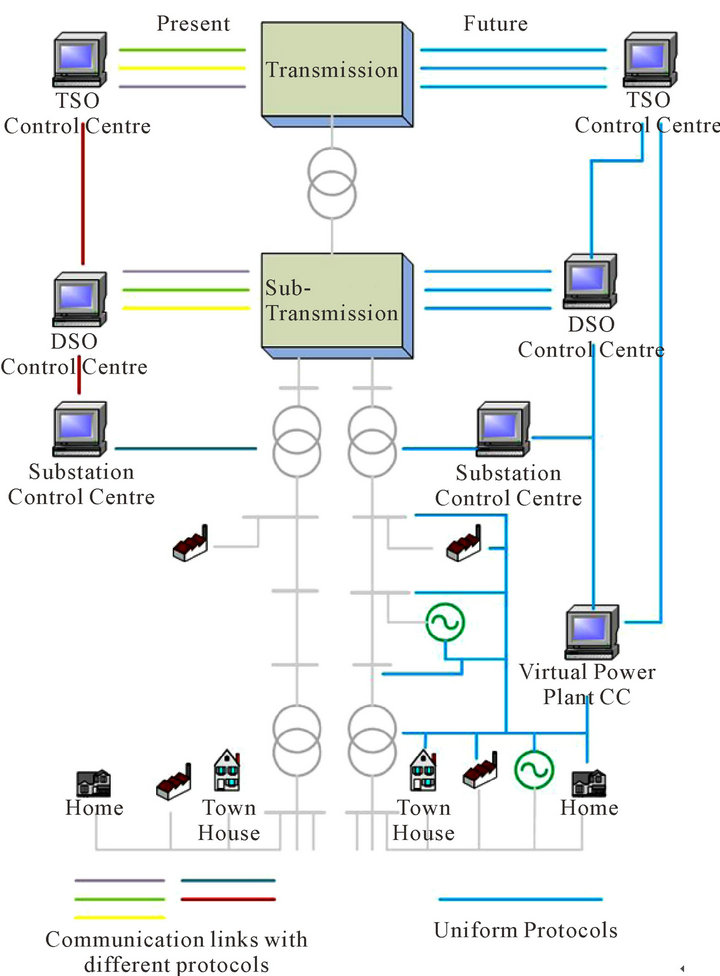
Figure 2. Smart grid roll-out of communications coverage to the distribution level [19].
delays associated with smart meter networks. This paper has developed several models of smart meter networks using OPNET Modeler 14.5 and analyzed the performance of those networks including propagation delay, network utilization and throughput.
4. Development of Smart Meter Network Using OPNET Modeller
OPNET Modeller provides robust platform to design and analyse systems and networks. It incorporates a lot of already-prepared simulation models of standard communication equipment and protocols for wired, radio and optical transmission mediums [21]. To model a specific component rarely appearing in real network, the components are to be modeled using an object oriented approach. OPNET has been used to model smart meters and develop a smart meter network by deploying smart meters, Ethernet switches, routers, firewalls and servers. To model a smart meter network with OPNET, the works were divided into four parts—model design, applying statistics, run simulation and then view and analyze the results. If the results are not satisfactory, then the network has to be re-modeled and then new statistics applied. The basic work flow of OPNET can be seen in Figure 3 [22].
4.1. Development of Smart Meter Using OPNET
A smart meter is a two way information exchange node. The meter is connected through an Ethernet switch within the smart meter network by a point to point duplex link so that it can send and receive data. A smart meter generates packets and assigns a destination address to the packet which is then transmitted through the Ethernet switch, router, and firewall to server. Smart meter applications all have Open System Interconnection (OSI)-7 layers stack is used for communication of metered (measured) values and the Ethernet link layer is used to transmit the data to the control centre [23,24].
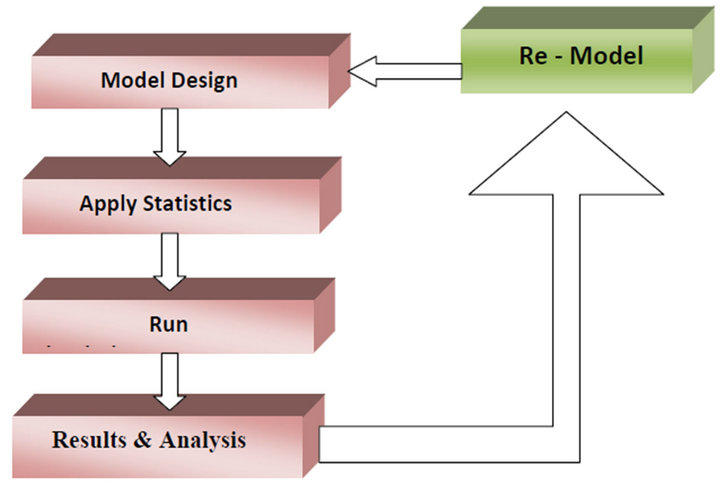
Figure 3. Workflow with OPNET [22].
As there are no specific smart meters available within the OPNET platform, a smart meter was developed using a workstation (node) in the OPNET platform and embedding typical characteristics of a smart meter within the TCP/IP application protocol. The implemented parameters include voltage (v), current (i), power factor (pf) and power (w). The mentioned parameters were executed within the function block of the process model which is sited within the node model of the application layer. This function supports receiving and sending data from the smart meter to the control centre (or server).
4.2. Development of Smart Meter Network using OPNET
A smart meter network is responsible for data access between smart meters and the server. The communication with meters needs the creation of topology to connect them with the server. To develop a suitable model of a smart meter network, three different models were developed within OPNET environment to analyze network performances.
The developed models based on OPNET have the capability to produce vast amounts of output data during simulations. The simulation models allow fast evaluation of important performance measures such as network delay, database query response time and server utilization. Simulation sets were defined by selecting the network model by using required network entities, such as Application Configuration, Profile Configuration, Virtual Private Network Configuration (VPN), Server, Nodes to be executed and then specifying values for input parameters..
Application Configuration: The applications, namely FTP (medium), FTP(low), HTTP(heavy browsing), HTTP (light browsing), Email(medium), Email(low), Database (medium) and Database(low) were adopted to specify the required applications in the simulation models of smart meter network.
Profile Configuration: Eight profiles, namely FTP medium), FTP low), HTTP heavy browsing), HTTP light browsing), Email medium), Email low), Database medium), and Database low) are used to create user profiles and these profiles can be specified on different nodes in the network design to generate the application traffic [22].
Virtual Private Network Configuration (VPN): VPN was arranged to offer a secure communication of information over the network. VPN increases packet latency by the addition of encryption and decryption, as well as wrapping and unwrapping packets at each end of the tunnel [25]. This has been specifically examined in this paper.
Server: This is a WLAN server with applications over a protocol such as TCP/IP. In server, the supported services can be defined based on the user profiles that may support FTP (medium), FTP (low), HTTP (heavy browsing), HTTP (light browsing), Email (medium), Email (low), and Database (medium), Database (low) on the client.
Nodes: Nodes includes smart meters (two way communication devices), Ethernet switches, Ethernet hubs, routers, and firewalls running over TCP/IP protocol that support underlying WLAN connection.
Apply statistics of smart meter network: Statistics that need to be applied for a designed model are basically two types—global or scenario-wide statistics and object statistics. Global statistics could be collected from the designed network model and the object statistics could be accumulated over nodes [22].
In this paper, the chosen global statistics are: DB Query, Email response time, FTP response time, HTTP response time, VPN, node statistics that include client DB, client DB entry, client DB queue, client FTP, client Email, client HTTP, server CPU utilization, server DB, server FTP, server Email, server HTTP. The selected Link statistic includes queuing delay, throughput, and utilization.
5. Modelling and Analysis of Smart Meter Network
Three different cases were considered while analyzing the smart meter network.
5.1. Case 1
There were two scenarios in case 1. In both scenarios, 24 smart meters along with the network elements, namely Database query response time is the time elapsed between sending a request to the server and receiving a response [26]. It has been shown that the response time of the smart meter network with the 10 Mbps communication link is 3.6 ms (as shown by the blue color line) with slight spike at 3.9 ms and is 0.8 ms (as shown by red color line) for the 100 Mbps communication link. It is also observed that response time appears to level off with time, which indicates that the network is stable.
Three Ethernet Switches, two Router, one Firewall, and one Server (that represents the control centre) are used.
As shown in Figure 4, the network was built with two LANs (each LAN comprises of twelve smart meters and an Ethernet switch connected with communication links 10 BaseT/100 BaseT) based on star topology, one Ethernet switch, two routers, a firewall and a server and all components were connected through 10 BaseT and 100 BaseT communication links. In scenario 1, the 10 BaseT communication link was used while the 100 BaseT communication link was used in scenario 2.
The performance of the networks was measured in terms of propagation delays, point to point throughput
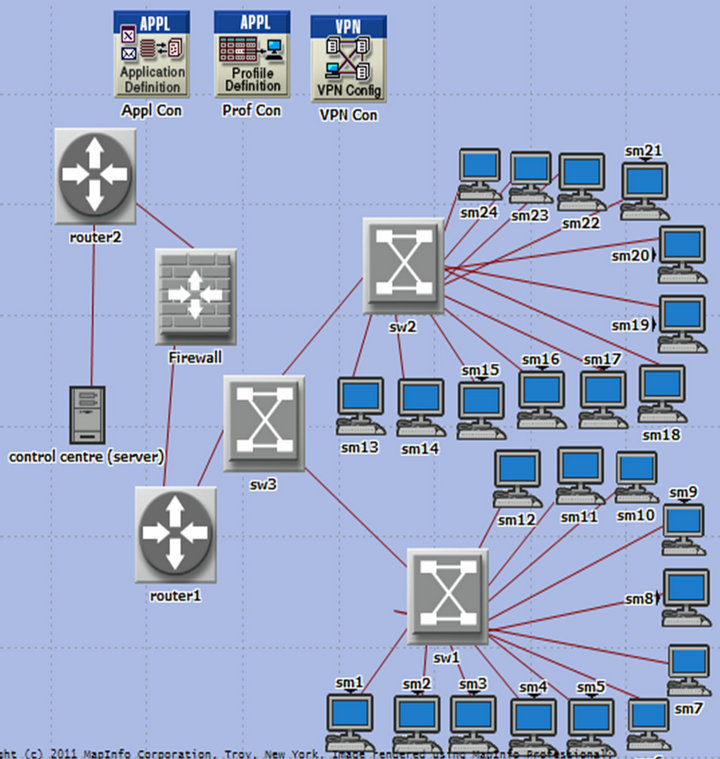
Figure 4. OPNET with smart meter network.
and server utilization. It is extremely important to identify these as there will be thousands of data packets coming through from the smart meters. Failure in adequately planning of the network to suitably respond can bring significant challenges. Based on this model, a network developer can easily develop a larger model to investigate larger network.
1) Simulation Result—Database Query Response Time of the Network
OPNET calculates an important parameter response time for the applications, namely Database (medium), Database (low) of the server for the above mentioned two scenarios as shown in Figure 5.
Database query response time is the time elapsed between sending a request to the server and receiving a response [26]. It has been shown that the response time of the smart meter network with the 10 Mbps communication link is 3.6 ms (as shown by the blue color line) with slight spike at 3.9 ms and is 0.8 ms (as shown by red color line) for the 100 Mbps communication link. It is also observed that response time appears to level off with time, which indicates that the network is stable.
From the two graphs, it is also obvious that the response time is reduced significantly with increasing bandwidth.
2) Simulation Result—Throughput from Router to Server
Figure 6 shows the load from router to server (bits/sec) for the above mentioned two scenarios. The load (or throughput) with 10 BaseT and 100 BaseT communication link are very low during an initial 1.8 second time period then sharp increases to 2200 bits/sec for the 10
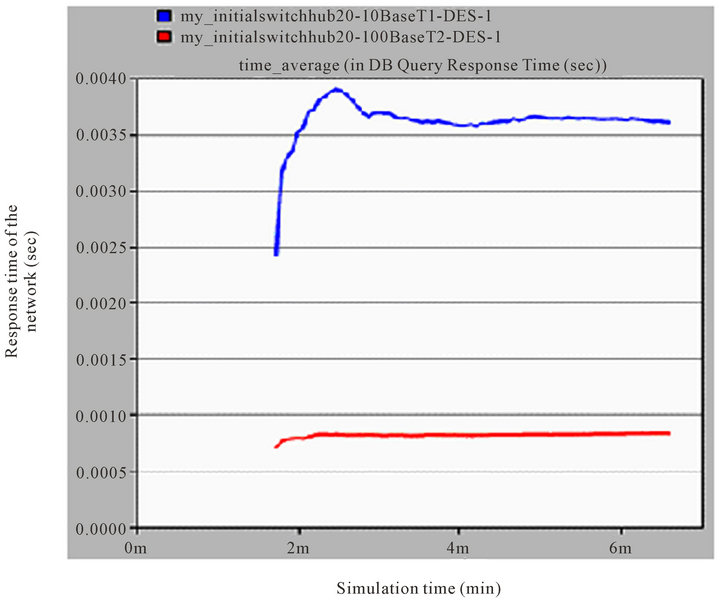
Figure 5. Database query response time of the smart meter networks.
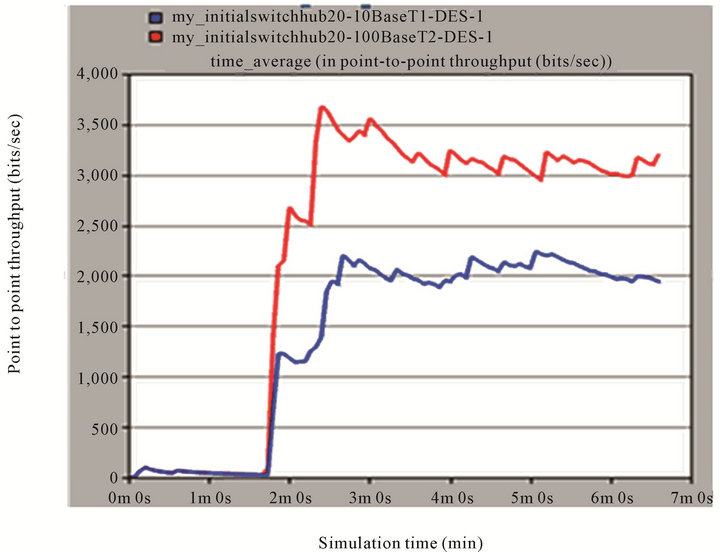
Figure 6. Throughput/load (bits/sec) from router to server for different bandwidth.
BaseT communication link and also sharp increases to 3200 bits/sec with a spike of approximately 3600 bit/sec for the 100 BaseT communication link during the rest of the time.
It can be stated that the larger bandwidth, the more bits can be inserted on the network in a given time frame.
3) Simulation Result—Server Utilization
Figures 7 shows server utilization for the above mentioned two scenarios.
This channel utilization depends on several factors such as the distance between the sender and receiver, signal speed over the channel, the bit rate, frame size, and the amount of time needed to construct and send a frame [27]. In the above mentioned two scenarios, the smart meter networks are utilized the same distance between the sender and receiver, and the same frame size, but with different bandwidths. The simulation results as shown in Figure 7 indicate that the network with 100 Mbps bandwidth carries higher network utilization amounting approximately 1.6% (with throughput 3200 bits/sec) compared with approximately 1.4% network utilization (with throughput 2200 bits/sec) for the network with the 10 Mbps bandwidth with initially very low network utilization in the server for both networks. The network with the 100 Mbps bandwidth sharply increases to 2.1% server utilization from the very low network utilization and it then stabilizes at about 1.6%, but the network with the 10 Mbps bandwidth increases to a stable 1.4% network utilization from the low initial network utilization.
4) Conclusion of Using Different Communication Llinks in Smart Meter Network
From the above analysis as shown in Figures 5, 6, and 8, it can be stated that communication link bandwidth capacity affects the database query response time, throughput, and server utilization. When network bandwidth is high, network throughput, and network utilization are high, while on the other hand, propagation delay of the network is decreased.
5.2. Case 2
As power distribution system performance is very important, a secure and reliable smart meter network is critical. To achieve maximum security, firewalls are deployed to provide a basic level of security when internal and external users attempt to access the smart meter network. A firewall can be configured to filter or deny the delivery of packets from particular applications or IP addresses [25]. While it is essential to have firewalls within the network to protect it from the hackers, it also adds to the processing delay and eventually to the propagation delay.
In case 2, the simulation was carried out for two scenarios without the Firewall as depicted in Figure 8.
As shown in Figure 8, the network was built with two LANs (each LAN comprises of twelve smart meters and an Ethernet switch connected with communication links 10 BaseT/100 BaseT) based on star topology, one Ethernet switch, two routers, and a server and all components were connected through 10 BaseT/100 BaseT communication links. In the first scenario, the 10 BaseT communication link was used with the above mentioned parameters while in the second scenario the 100 BaseT communication link was used.
1) Simulation Result—Database Query Response Time of Smart Meter Network
As shown in Figure 9, the database query response time without firewall for the applications, namely Database (medium), and Database (low) of the server are as below:
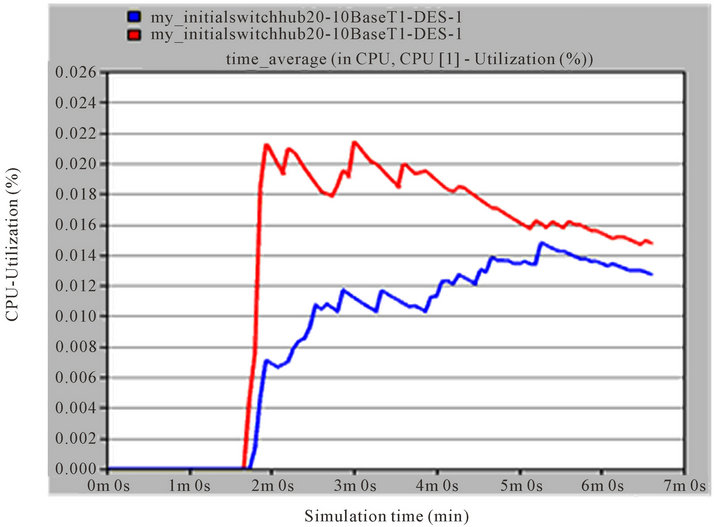
Figure 7. Server utilization for different network bandwidths.
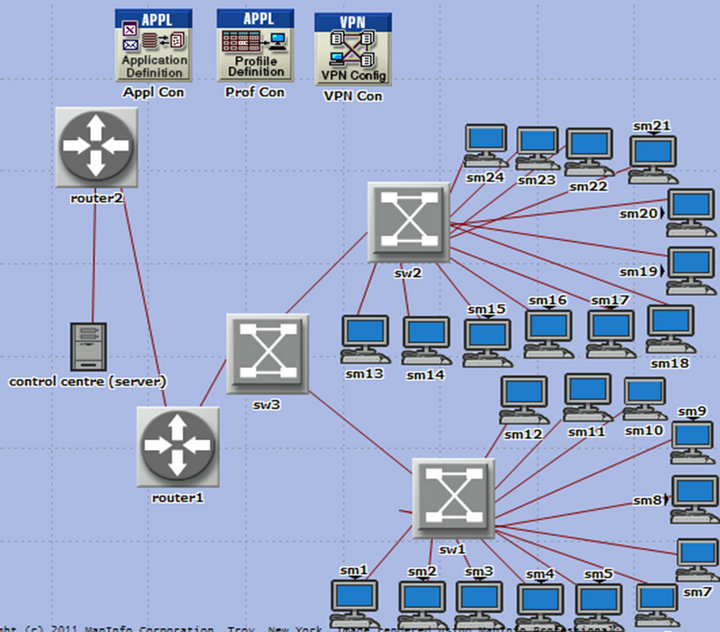
Figure 8. Smart meter network with smart meter, Ethernet switch, router, and server (without firewall).
• With 10 BaseT, the response time is 3.2 ms.
• With 100 BaseT, the response time is 0.78 ms.
Compared with the results in case 1 (with firewall), the difference without firewall for 10 BaseT is 0.4 ms while the difference for 100 BaseT is 0.02 ms.
2) Simulation Result—Throughput from Router to Server
Figure 10 shows throughput from router to server with and without a firewall. Throughput for 10 BaseT without a firewall is approximately 2050 bits/sec while for 100 BaseT without a firewall throughput is 2600 bits/sec. By comparing results with and without firewall, the difference with 10 BaseT is 150 bits/sec while it is 600 bits/ sec with 100 BaseT.
Hence, it can be concluded that throughput increases by having firewall in the network.
3) Simulation Result—Server Utilization
Figure 11 shows server utilization of a smart meter network with and without a firewall. Without the firewall for the 10 BaseT communication link, the server utilizetion rate is 0.8% (with 2050 bits/sec) and it is 0.85% (with 2600 bits/sec) for the 100 BaseT communication link. Hence, the comparative server utilization rate with and without a firewall is 0.6% for 10 BaseT and 0.75% for 100 BaseT.
4) Conclusion
Adopting a firewall within the smart meter network slightly increases CPU utilization, throughout as well as propagation delay. As the propagation delay increases only minimally with the addition of a firewall in the network, it is recommended that firewalls must be adopted in the smart meter network.
5.3. Case 3
There were two scenarios in case 3. In both scenarios, 24 smart meters along with the network elements namely two Ethernet Hub, one Ethernet Switches, two Routers, one Firewall, and one Server (that represents the control centre) are used.
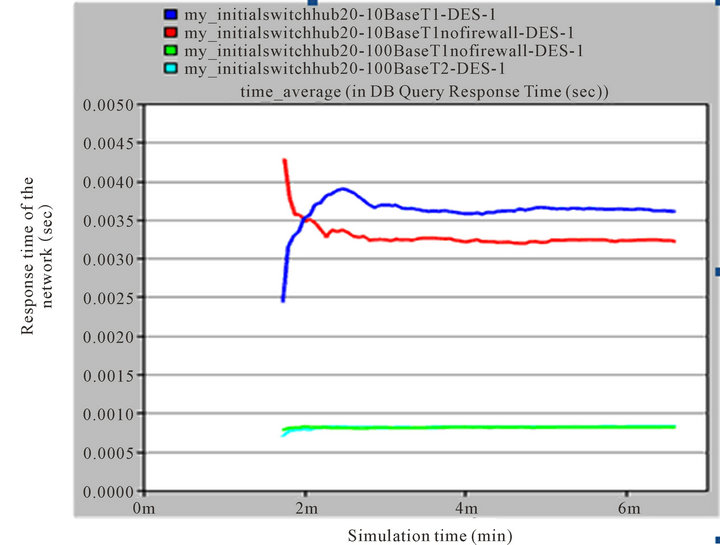
Figure 9. Database query response time of smart meter network.
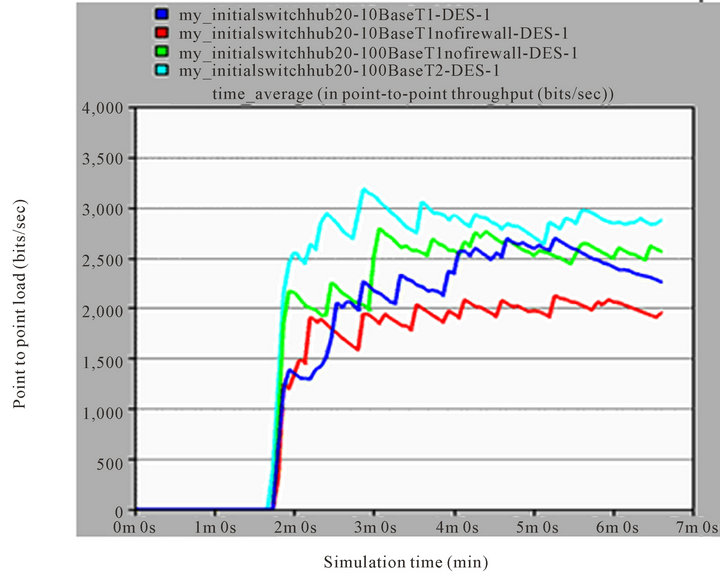
Figure 10. Throughput (bits/sec) from router to server of smart meter network.
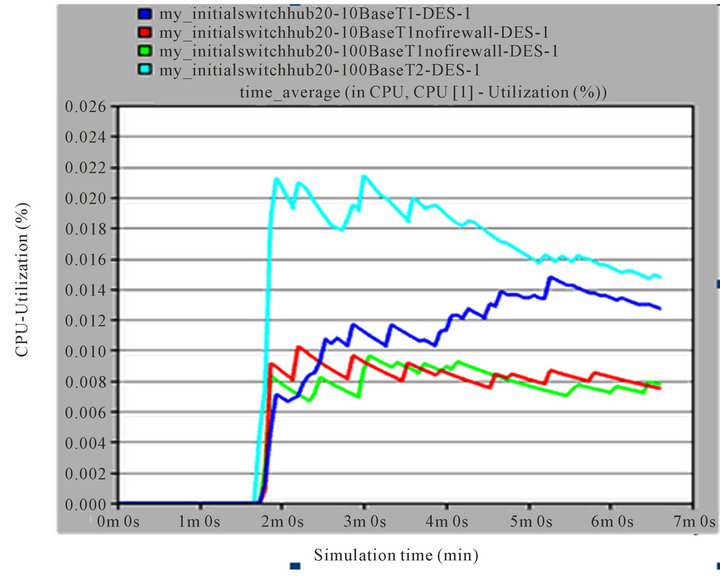
Figure 11. Server utilization in smart meter network.
As shown in Figure 12, the network was built with two LANs (each LAN comprises of twelve smart meters and an Ethernet hub connected with 10 BaseT/100 BaseT communication links), one Ethernet switch, two routers, one firewall and one server.
In the first scenario, the 10 BaseT communication link was used with the above mentioned parameters while the 100 BaseT communication link was used with the above
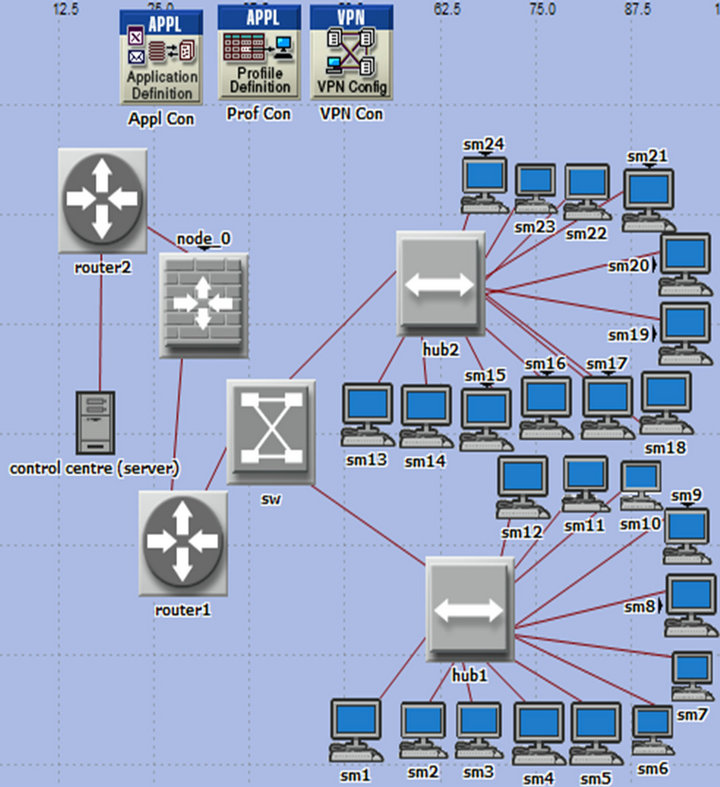
Figure 12. Smart meter network with smart meter, hub, switch, router, firewall and server.
mentioned parameters as shown in Figure 12 in second scenario.
Simulation Result—Database Query Response Time of Smart Meter Network
Figure 13 shows the database query response time for the above mentioned two scenarios in case 3 for the applications, namely Database (medium), and Database
(low) of the server are as below:
• With 10 BaseT, the response time is 2.4 ms.
• With 100 BaseT, the response time is 0.7 ms.
Compared with the results in case 1, the difference for the 10 BaseT scenario is 1.2 ms while the difference for 100 BaseT is 0.1 ms. It can be stated that the smart meter network with the 100 BaseT communication link perform better.
2) Simulation Result—Throughput from Router to Server
Figure 14 shows the throughput (bits/sec) from router to server of the smart meter networks for the two scenarios of case 3 and compared these with the two scenarios of case 1. Throughput from router to server with 10 BaseT is approximately 1600 bits/sec while for 100 BaseT throughput is 2000 bits/sec. Compared with the results for the two scenarios in case 1, the difference for throughput in 10 BaseT is 600 bits/sec while there are 1200 bits/sec in 100 BaseT.
It can be stated that adding an Ethernet hub in each LAN instead of having an Ethernet switch causes a significant decreased of throughput from router to server with the different bandwidth scenarios of smart meter network.
3) Simulation Result—Server Utilization
Figure 15 shows server utilization of smart meter networks for the mentioned two scenarios in case 3 and compares the scenarios with two scenarios of case 1. Server utilization with the 10 BaseT communication link is 1.2% while it is 1.1% with the 100 BaseT communication link.
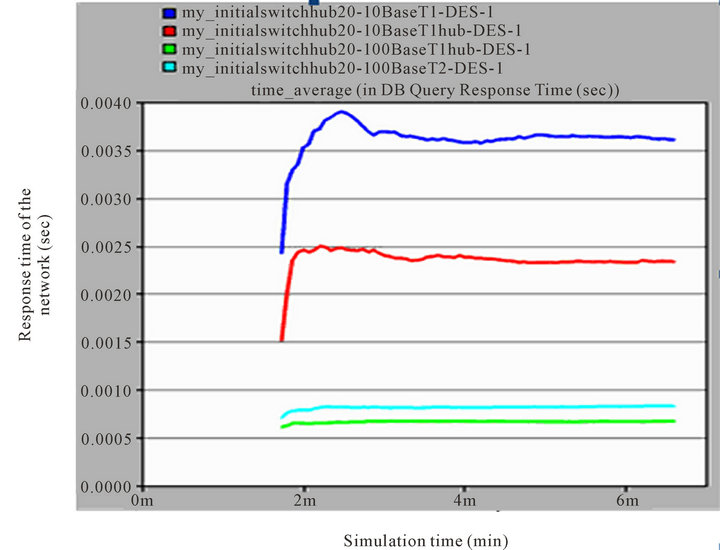
Figure 13. Database query response time of smart meter network.
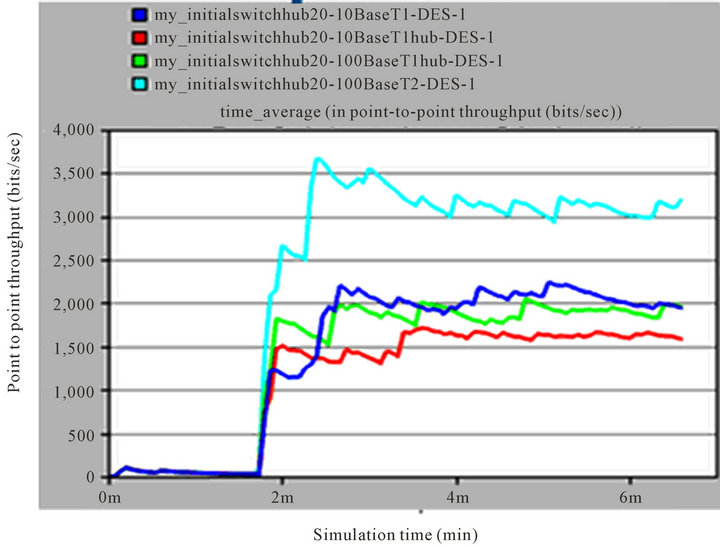
Figure 14. Throughput (bits/sec) from router to server.
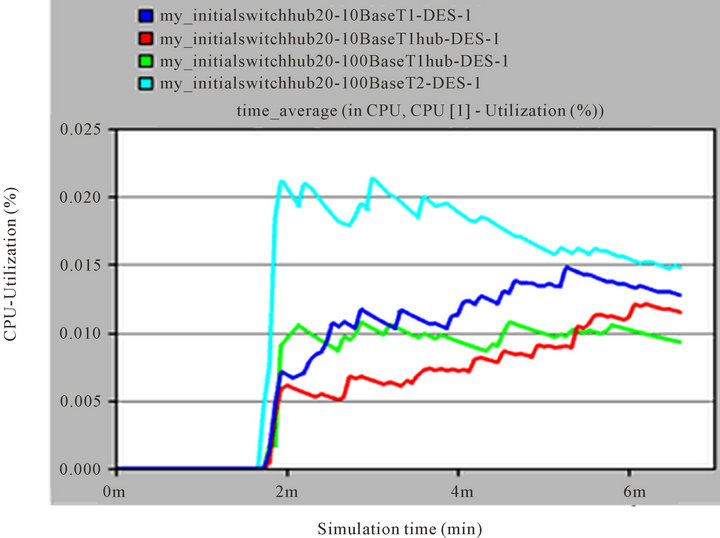
Figure 15. Server utilization.
Hence, the comparative server utilization rate for the scenarios of case 1 is 0.2% reduced for 10 BaseT and 0.5% reduced for 100 BaseT.
4) Conclusion
Adopting an Ethernet hub in place of Ethernet switches in each LAN of smart meter network, server utilization and throughout as well as propagation delay shows slightly decreased.
6. Result Analysis
The different structured smart meter networks setup as shown in Figures 4, 8 and 12 were used to measure database query response time, server utilization and throughput from router to server over a wide range of time. For
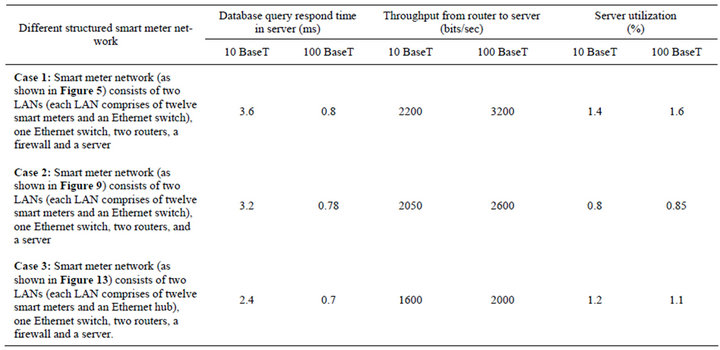
Table 1. Summary of simulation result with 10 and 100 BaseT.
each simulation run, thousands of packets were sent from smart meters to the server and reach a steady state or stable situation before starting to record delay measurements.
Table 1 shows a summary of simulation results, namely database query response time, server utilization and throughput from router to server of the different structured smart meter network in sending packets from smart meters to server using communicating link 10 BaseT and communicating link 100 BaseT in networks.
From the table, it can be stated that with increased bandwidth, network parameters, namely server utilization and throughput from router to server are increased in different structured of smart meter networks.
By analyzing the results from different simulation models using 10 BaseT and 100 BaseT communication links, higher communication link capacity provides decreased database query response time and increases network load and network utilization. Using a firewall in the network increases very negligibly propagation delay. Smart meter network using Ethernet hubs instead of Ethernet switches in each LAN with a higher communication link capacity, database query response time, and load from router to server and CPU utilization decreases.
Given the simulation results from different structured smart meter networks, it can be stated that the 100 BaseT communication link is most suitable for smart meter network.
7. Conclusions
OPNET modeler was used to develop both smart meter and smart meter network models. Various scenarios were developed and simulated. The developed models can measure the performance of smart meter network accurately. As discussed in the details of each case, the 10 BaseT communication link will be inadequate while the 100 BaseT communication link will fulfill communication requirements for a typical smart meter network in a distribution system. From the simulation results carried out for different models of smart meter networks, it can be concluded that the 100 BaseT communication link will be required to adequately transmit smart meters data to the central server of control centre.
The development carried out in this paper has produced a smart meter network model which can be used by the distribution companies to analyze larger scale smart meter networks based on this research. The development and implementation of several models of differently structured smart meter network in OPNET modeler is a pioneering engineering achievement accomplished in this paper. A realistic scenario of smart meter network performance requirement has also been obtained for various cases.
REFERENCES
- H. Dellwing, S. Geretshuber, C. Schwaegerl and O. Seifert, “Power System Survivability Increase with Intelligent Support Tools,” IEEE Conference on Power & Energy Society General Meeting, Calgary, 26-30 July 2009, pp. 1-6. http://ieeexplore.ieee.org/stamp/stamp.jsp?tp=&arnumber=5275602
- Ferry August via Wan, “Voltage Control and Voltage Stability of Power Distribution Systems in the Presence of Distributed Generation,” A Thesis for Degree of Doctor of Philosophy, Division of Electric Power Engineering, Department of Energy and Environment, Chalmers University of Technology, Göteborg, 2008.
- N. Jenkins, R. Allan, P. Crossley, D. Kirschen and G. Strbac, “Embedded Generation,” The Institution of Electrical Engineers, London, 2000.
- T. A. Short, “Electric Power Distribution Handbook,” CRC Press LLC., Boca Raton, 2004.
- T. Gönen, “Electric Power Distribution System,” McGraw- Hill Book Company, New York, 1986.
- M. L. Chan, KEMA, Inc., “Smart Grid—Future Distribution System Infrastructure,” Comments on Distribution System Infrastructure Docket No. 06-IEP-IF, Sunnyvale, May 2007.
- “Smart Networks Position Paper,” Technical Report, Energy Network Associations, September 2009. http://www.ena.asn.au/udocs/2009/09/Smart-networks-policy-paper-2.pdf
- Energy Retail Association, “Smart Meters.” http://www.energy-retail.org.uk/smartmeters.html
- S. P. Carullo and C. O. Nwankpa, “Experimental Studies and Modelling of an Information Embedded Power System,” Proceedings of the 36th Hawaii International Conference on System Sciences, Big Island, 6-9 January 2003, pp. *.
- M. T. O. Amanullah, “Experimental Analysis and Modelling of an Information Embedded Power System,” A Thesis of Doctor of Philosophy, Victoria University, 2006.
- S. Marvin, H. Chappells and S. Guy, “Pathways of Smart Metering Development: Shaping Environmental Innovation,” Computers, Environment and Urban Systems, Vol. 23, No. 2, 1999, pp. 109-126. doi:10.1016/S0198-9715(99)00011-3
- C. Halliday and M. D. Urquhart, “Network Monitoring and Smart Meters,” 2008. http://elect.com.au/Attachments/Network%20Monitoring%20and%20Smart%20Meters.pdf
- “Smart Grid,” Wikipedia Foundation Inc., 2009. http://en.wikipedia.org/wiki/Smart_grid
- “Networking the Smart Grid,” Technical Report: A Troops Networks White Paper, April 2009. http://www.smartgridnews.com/artman/uploads/1/NetworkingSmartGridWP_A7.pdf
- L. Sollecito, “Smart Grid: The Road Ahead,” Techcial Report, IntelliGrid Architecture Report: Volume 1, IntelliGrid User Guidelines and Recommendations, EPRI, 2009, pp. 15-19. http://www.gedigitalenergy.com/multilin/journals/issues/Spring09/Smart_Grid_The_Road_Ahead.pdf
- J. Z. Wu and N. Jenkins, “Self-Adaptive and Robust Method for distribution Network Load and State Estimation,” 16th Power Systems Computation Conference, Glasgow, 14-18 July 2008.
- Y. He, N. Jenkins, J. Z. Wu and M. Eltayed, “ICT Infrastructure for Smart Distribution Networks,” 14th IEEE International Symposium on Power Line Communications and Its Applications, Rio de Janeiro, 28-31 March 2010.
- P. Wolfs and S. Islam, “Potential Barriers to Smart Grid Technology in Australia,” Power Engineering Conference, Adelaide, 27-30 September 2009. http://ieeexplore.ieee.org/stamp/stamp.jsp?tp=&arnumber=5356623
- Department of Primary Industries, Victoria, “Advanced Metering Infrastructure—Minimum AMI Functionality Specification (Victoria),” 2008. http://share.nemmco.com.au/smartmetering/Document%20library/Smart%20meter%20background%20info/Background%20-%20Minimum%20AMI%20Functionality%20Specification%20Vic%20-%20Sep%202008.pdf
- European Technology Platform SmartGrids, “Strategic Research Agenda for Europe’s Electricity Networks of the Future,” European Commission, Directorate-General for Research, Directorate Energy, 2007.
- Opnet Modeler, OPNET Technologies Inc. http://www.opnet.com
- Y. Ravikumar and S. K. Chittamuru, “A Case Study on MANET Routing Protocols Performance over TCP and HTTP,” Master Thesis, Blekinge Institute of Technology, Sweden. http://www.bth.se/com/mscee.nsf/attachments/6434
- R. Tahboub, D. Lazarescu and V. Lazarescu, “Modeling and Simulation of Secure Automatic Energy Meter Reading and Management System using Mobile Agents,” IJCSNS International Journal of Computer Science and Network Security, Vol. 7, No. 1, 2007, pp. 244-253.
- A. Zaballos, G. J. Ravera, A. Vallejo and J. M. Selga, “Simulation and Modelling of the Coexistence of Polling and Contention in PLC Based AMR System,” IEEE International Symposium on Power Line Communications and Its Applications, Pisa, 26-28 March 2007, pp. 110- 115.
- K. Brown and L. Christianson, “OPNET Lab Manual to Accompany Business Data and Communications,” 2005.
- N. Albort, M. Keyvani, M. Nikolic and L. Trajkovic, “Simulation of Packet Data Networks Using OPNET,” 2005.
- W. A. Shay, “Understanding Data Communication and Network,” 2nd Edition, PWS-Kent, Boston, 1995.