World Journal of Mechanics
Vol. 1 No. 3 (2011) , Article ID: 5775 , 7 pages DOI:10.4236/wjm.2011.13016
Dual Behavior of Suspended Sediment Concentration in a Regulated River
International Center for Water Hazard and Risk Management under the Auspices of the United Nations Educational, Scientific, and Cultural Organization, Tsukuba-shi, Japan
E-mail: huang@pwri.go.jp
Received April 4, 2011; revised May 5, 2011; accepted May 15, 2011
Keywords: Suspended Sediment Concentration, Hysteresis, Carrying Capacity, Transport-Limited, Supply-Limited
ABSTRACT
Better understanding of suspended sediment transport processes allows for better management of both rivers and coasts. Based on field data and sediment transport energy theory, this study presents an analysis on the suspended sediment hysteresis in the Lower Tenryu River of Japan in connection to the channel carrying capacity of suspended sediment and morphological characteristics. The transport of suspended sediment in the river exhibited dual behaviors according to the magnitude of flood. It was transport-limited in a 10-year flood while supply-limited in a 30-year flood. In the supply-limited case, the temporal variation of suspended sediment concentrations followed the hydrograph well. In the transport-limited case, however, there was a time lag between peak discharge and maximum suspended sediment concentration. The mechanism of time lag was further clarified to be different for the 10-year flood and a small flood. The objective of this paper is to shed some new light on the relationship of suspended sediment to flow and channel conditions.
1. Introduction
Better understanding on the transport of suspended sediment from rivers to the ocean has remained a challenge for an increasing number of reasons. In Japan, the overall erosion rate of the coastline was 7.2 × 10⁵ m2/year before 1980, but sharply increased to 1.6 × 10⁶ m2/year after 1980 due largely to the reduction of suspended sediment supply. In the United States, Environmental Protection Agency (EPA) identifies suspended sediment as the single most widespread pollutant affecting the beneficial uses of the Nation’s rivers and streams [1]. High concentration of suspended sediment may clog fish gills, either killing them or reducing their growth rate. When the water slows down, the suspended sediment settles out and drops to the bottom, a process called siltation. This causes the water to be clear, but as the sediment settles it may change the bottom smothering bottom-dwelling organisms, covering breeding areas, and smothering eggs. Therefore, sound management of suspended sediment transport is a multi-purpose undertaking.
The relationship between river discharge and suspended sediment concentration is generally expressed by a rating curve, which is described by a power function (Walling [2], Sickle and Beschta [326], Steegen et al. [4], Morehead et al. [5]).
 (1)
(1)
in which SSC is the suspended sediment concentration (g/m3), Q is the flow discharge (m3/s) and a, b are empirically determined regression coefficient. However, various studies (Klein [6], Seeger et al. [4], Williams [7]) showed that the relations between SSC and Q are highly variable either within or between events. Resulting SSC-Q hysteresis were widely examined at the event scale to interpret geomorphic processes and outline the spatial distribution of sediment sources (Crawford [8], Lenzi and Marchi [9], Jansson [10], Krueger [11], Duvert [12]). Based on these studies, the SSC–Q relationships can be mainly classified into three classes. First class: peaks of SSC and discharge arrive simultaneously; Second class: the SSC peak arrives earlier than the discharge peak; Third class: the SSC peak arrives later than the discharge peak. The mechanism behind the second class may be the remobilization of in-channel sediment deposits or adjacent extra-channel sources where sediment is transported a short distance by runoff (Williams [7], Jansson [10]). The third class may be related the arrival of remote sediment from external channel sources during long duration rainfall events or correspond to the absence of in-channel sediment delivery (Brasington and Richards [13], Lenzi and Marchi [9], Orwin [14]). However, little study has been done on the suspended sediment hysteresis in relation to sediment carrying capacity and channel morphology.
In this study, the patterns of SSC-Q relation during three floods of different magnitude in a regulated gravel river were studied. It is aimed to better understand the hysteresis in relation to flow and channel cross-sectional characteristics and from the perspective of channel sediment carrying capacity.
2. Materials
2.1. Study Site
The Tenryu River (Figure 1) originates in the central Honshu Mountains. From its source at Lake Suwa in Okaya, Nagano Prefecture, it extends 213 km, grazing Aichi Prefecture en route to its mouth at the boundary between the cities of Hamamatsu and Iwata in Shizuoka Prefecture. It drains 5050 km² into the Enshunada Coast. In length, it is the 9th longest river in Japan. There are five dams along the mainstream; Yasuoka Dam, Hiraoka Dam, Sakuma Dam, Akiha Dam and Funagira Dam. The Lower Tenryu River is the part from the Kashima site to the river mouth, approximately 25 km long. Due to dam constructions in the upstream of the river, particularly after the completion of the Sakuma Dam in 1956, the
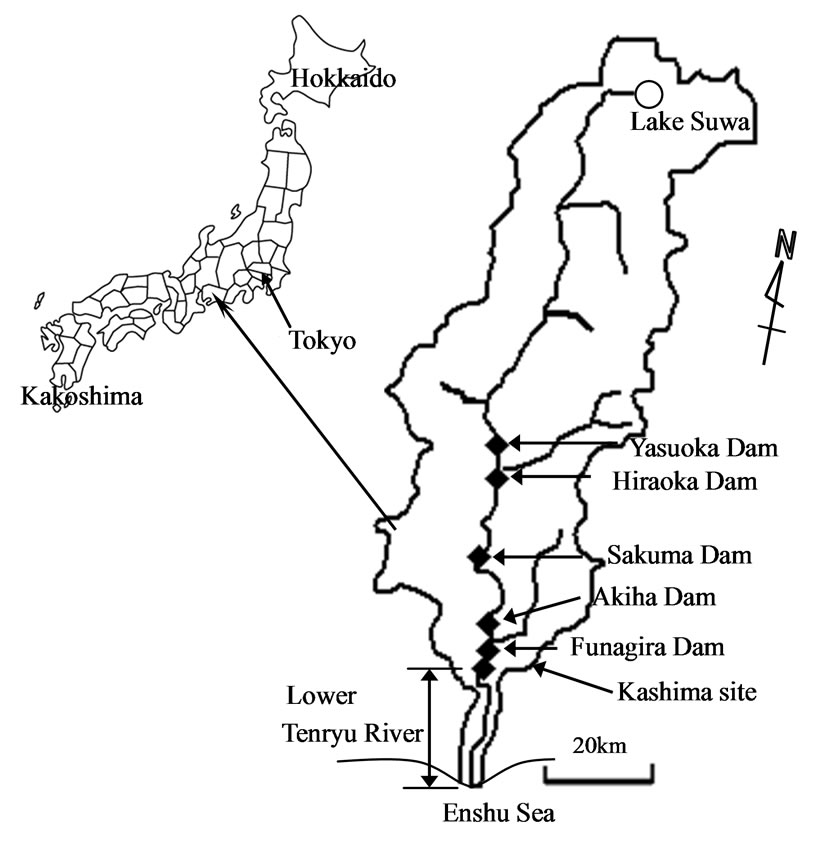
Figure 1. Tenryu River.
sediment supply from the upstream was very much reduced, resulting in significant morphological change in the downstream reaches and beach erosion in the Enshunada Coast as well (Nagashima [15], Liu [16]). By analyzing the riverbed aggradations data in the reservoir formed by the Sakuma Dam, it was found that the total amount of the sediment trapped in the reservoir during the period from 1956 to 2000 was about 1.2 × 10⁸ m3. Thus, the annual sediment trapping rate by the Sakuma Dam was estimated to be about 2.6 × 10⁶ m3/yr, which virtually prevented all bed material sediment loads from transporting to downstream reaches. As a result, the active remaining source of beach-forming sediment supply to the coast after the dam construction is the Keta River, which is a tributary of the Tenryu River and located downstream of all sediment-trapping dams but upstream of the Kashima site.
2.2. Data
Two large floods occurred in the river in 2006 and 2007, respectively. Hamamatsu River Office conducted fieldobservation of SSC and flow discharge during the two floods. The depth-averaged SSC data, supplied to authors from the river administration office, were used in the analysis of this study. We also collected from the river administration office channel cross-sectional data and continuous water level records for the calculation of flow velocity and depth. In 2008, we installed a back scattering turbidity meter (Compact-HTW) 1m above the river bed at the Kakedsuka gauging station (3.3 km from the river mouth) for continuous monitoring. During the summer of 2008, there was a small flood and the corresponding turbidity data were recorded and converted to SSC according to the calibrated relationship between turbidity and SSC compiled through pre-field lab test.
2.3. Methods
First of all, flood frequency analysis was conducted for the Lower Tenryu River to determine the return periods of the three floods in consideration. The Log-Pearson Type III distribution was used in the analysis.
To explain the difference among the three cases in terms of carrying capacity, we adopted the energy balance theories of Velikanov [17], Bagnold’s [18] and Zhang ([19,20]), which assumed that (1) the amount of energy supplied by the fluid equals frictional energy losses and that required to keep sediment in suspension; (2) the energy supplied by sediment equals frictional energy losses by the sediment.
By dimensional analysis, the difference in energy dissipation rate between clear water and sediment-laden flow could be expressed as
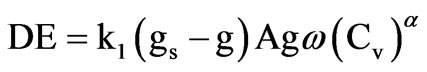 (2)
(2)
where A = channel cross-sectional area; g, gs = specific weights of water and sediment; w = settling velocity; Cv = suspended sediment concentration by volume, k1 and a = coefficients.
By definition,
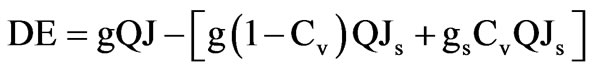 (3)
(3)
where J and Js are energy slopes of clear water and sediment-laden flow, respectively. They can be expressed as following
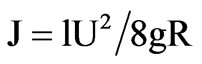 (4)
(4)
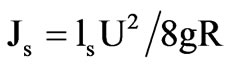 (5)
(5)
where l and ls are friction coefficient without and with suspended sediment, respectively. Mathematical manipulation of Equations (2-5) led to
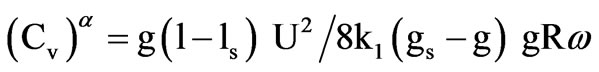 (6)
(6)
Since the difference between l and ls is due to the presence of suspended sediment, (l - ls) in Equation (6) could be assumed to be a function of sediment concentration as
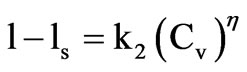 (7)
(7)
Substitution of Equation (7) into Equation (6) and mathematical manipulation led to
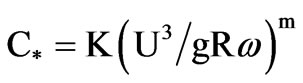 (8)
(8)
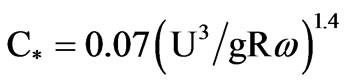
where C* can be considered as the saturation concentration of suspended sediment (kg/m3) under the velocity U; R is the hydraulic radius; K and m are empirical parameters. Following the work of Zhang ([19,20]), which was based on flume experiments and field observation, the values of K and m were assigned to be 0.07 and 1.4 in this study. Then, the transport capacity of suspended load was estimated in the present study as
 (9)
(9)
To make use of this formula, the settling velocity must be determined. In the autumn of 2006, we surveyed surficial sediment size distributions in a vegetated zone on the floodplain 14 km from the river mouth. The type of vegetation was hard tree with an average height of 5 m. After the flood of 2007, we survey surficial sediment size distributions on a vegetated sandbar 5 km from the river mouth. Figure 2 shows the measured sediment size distributions on the vegetated flood plain and on the vegetated sandbar as well. Because trees trap suspended sediment, the surface deposits on the flood plain and sand bar reflect what was in suspension during the last
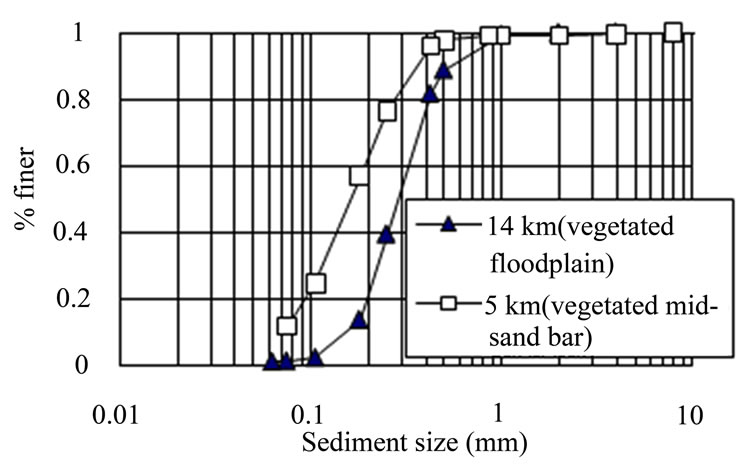
Figure 2. Size distribution of surficial deposits.
flood. It can be seen from Figure 2 that surface deposits were mainly in the range of 0.1 mm – 1 mm in vegetated zones. Therefore, the mean particle size of suspended sediment (Dm) was taken to be 0.3 mm. The settling velocity was then computed according to Dietrich [21].
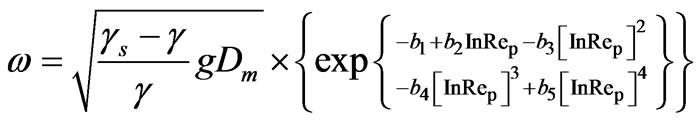
 (10)
(10)
To characterize the three floods in terms of their carrying capacities, the saturation concentrations at the peak discharges of the three floods were computed by Equation (9).
3. Results and Discussions
Figures 3-5 show flow discharges and SSC for the three target flood events. The peak flows were approximately 8000, 6000 and 1000 m3/s, respectively, while the maximum concentrations of suspended sediment were approximately 1400, 1200 and 110 g/m3, respectively. The hydrograph of the 2007 flood was relatively symmetrical inserting suggesting no hysteresis between discharge and water level within this flood event.
A four parameter Pearson Type-Ill distribution given below has been used as the form of inflow hydrograph for testing flood routing methodologies by various investigators (Ponce and Theurer, [22]; Garbrecht and Brunner [23]).
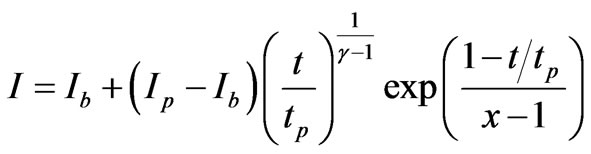 (11)
(11)
where Ib is the initial steady flow, Ip is the peak flow, t is the time to peak, and c is the skewness factor. The symmetry exhibited in the 2007 flood can be generated by
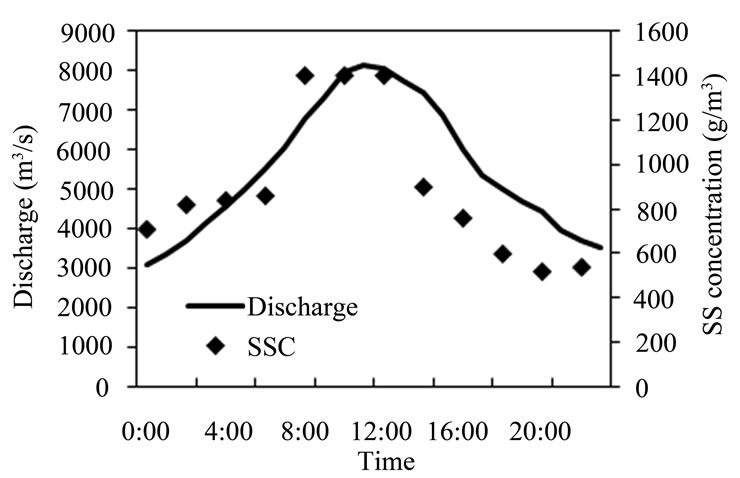
Figure 3. Flow discharge and suspended sediment concentration at Kashima station on July 15, 2007.
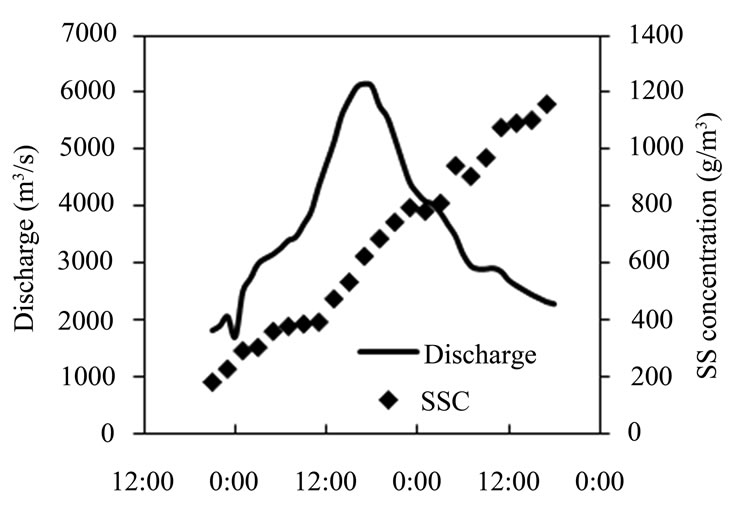
Figure 4. Flow discharge and suspended sediment concentration at Kashima station on July 19, 2006.
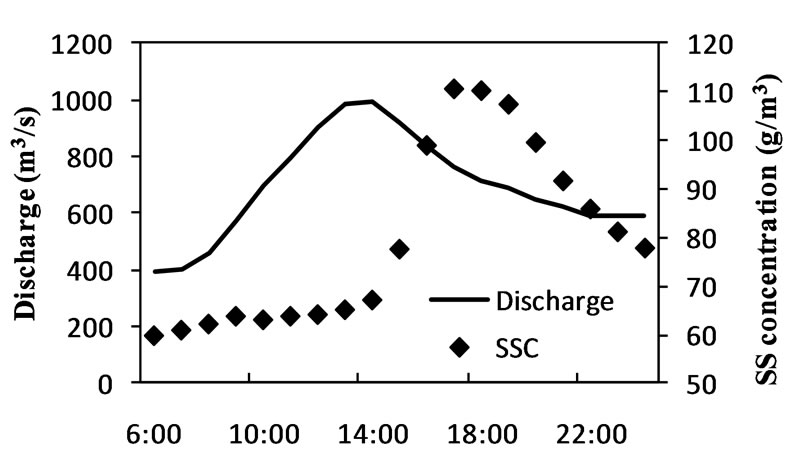
Figure 5. Flow discharge and suspended sediment concentration at Kakedsuka station on July 4, 2008.
Equation (11) if the value of skewness factor is given less than 1.15.
According to the flood frequency curve (Figure 6), the flood in 2006 was a 10-year flood and the 2007 flood was a 30-year flood. Therefore, they may be ranked as large and very large, respectively. For the 30-year flood, the variation of SSC followed the hydrograph well having its peak slightly ahead of the peak flow. For the 10-year and small floods, however, the peaks of SSC lagged behind the peaks of discharge. By using surveyed cross-sectional data, the maximum cross-sectional average velocities at the Kashima station for the 2006 and
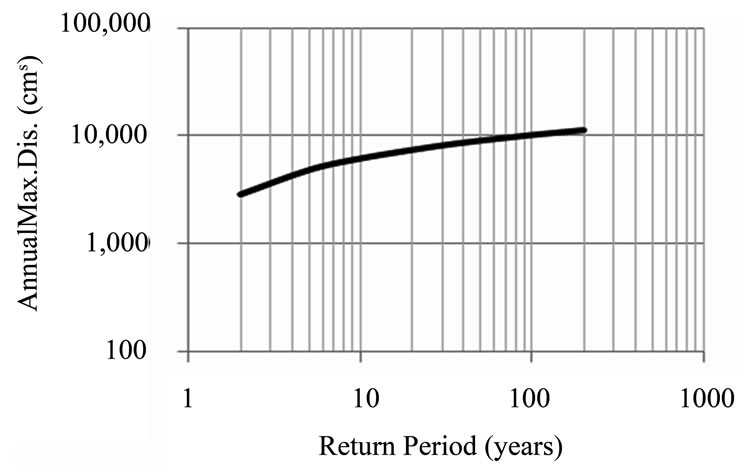
Figure 6. Flood frequency in the Lower Tenryu River.
2007 floods were calculated to be 4.0 m/s and 4.9 m/s, respectively. The maximum velocity at the Kakedsuka station during the small flood of 2008 was 0.8 m/s. Thus, the saturation levels of SSC at monitoring sites for the three floods were estimated by Equation (9) to be approximately 2700 g/m3, 1300 g/m3 and 100 g/m3, respectively. It is clear that the observed maximum suspended concentrations of the 10-year flood in 2006 and the small flood in 2008 were around their thresholds. However, during the 30-year flood, SSC was just 55% of the carrying capacity. Following the concept of Julien [24], the sediment transport process can be described as being transport-limited mode in the 2006 and 2008 floods, but a supply-limited mode in the 2007 flood.
A characteristic of the Kashima site is that there is a point bar on the left side of the channel (Figure 7) so that it resembled a two-stage channel on the left side. Figure 8 shows the water level variations for the 2006 and 2007 floods, respectively. Compared to the 2006 flood, the 2007 flood had steeper rising limb. Because of the channel cross-sectional configuration and the characteristics of water level variation, the 2006 flood inundated the point bar shallowly. In a two-stage channel, horizontal vortices around the interface between the main channel and the flood plain, lateral vortices above the flood plain and longitudinal vortices in the main channel may be generated as illustrated in Figure 9 (Ishigaki and Imanoto [25], Knight and Shiono [26]). The experiment by Ikeda et al. [27] showed that the large-scale vortices appeared when the water depth on the floodplain is relatively shallow. Such large-scale vortices can cause re-suspension of sediment deposited on the flood plain prior to a flood (Ikeda et al. [28]). In the 2006 flood, because the water level stopped rising further after shallowly inundated the point bar, coherent vortices must be present and dominant. Figure 10 shows the relationship between measured velocity and water level during this flood. As it is revealed, the maximum cross-sectional average velocity appeared as the water just overflowed the point bar, resulting in a time lag between maximum velocity and highest water level. Since there was no de
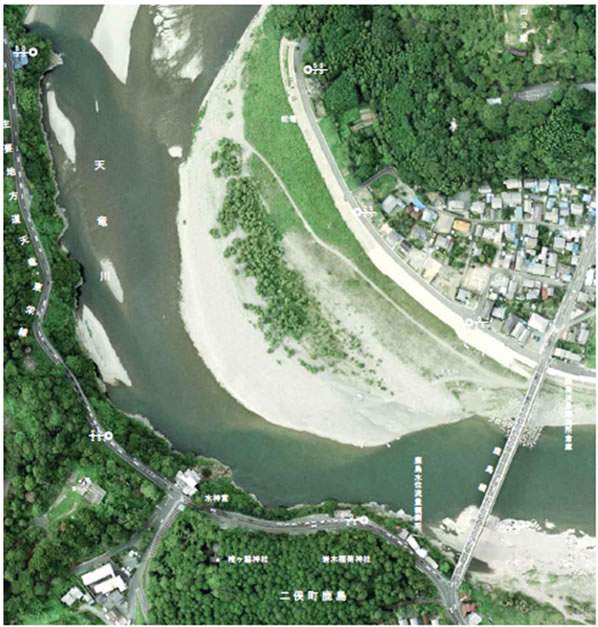
Figure 7. Point bar at the Kashima site.
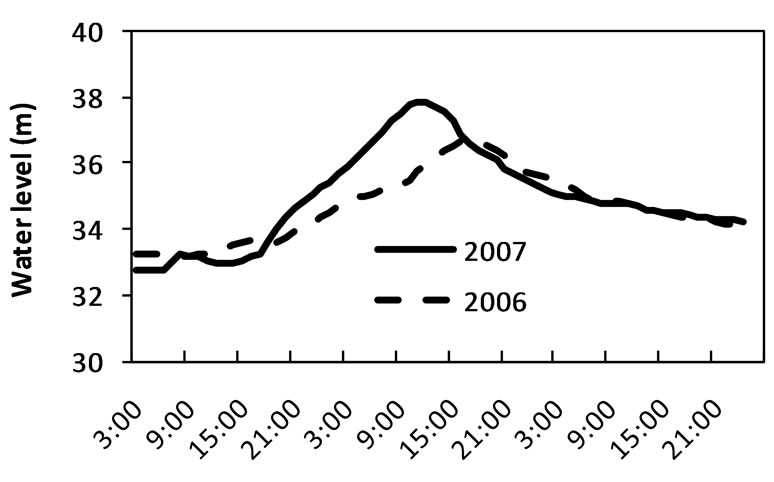
Figure 8. Water level variations in the 2006 and 2007 flood events.
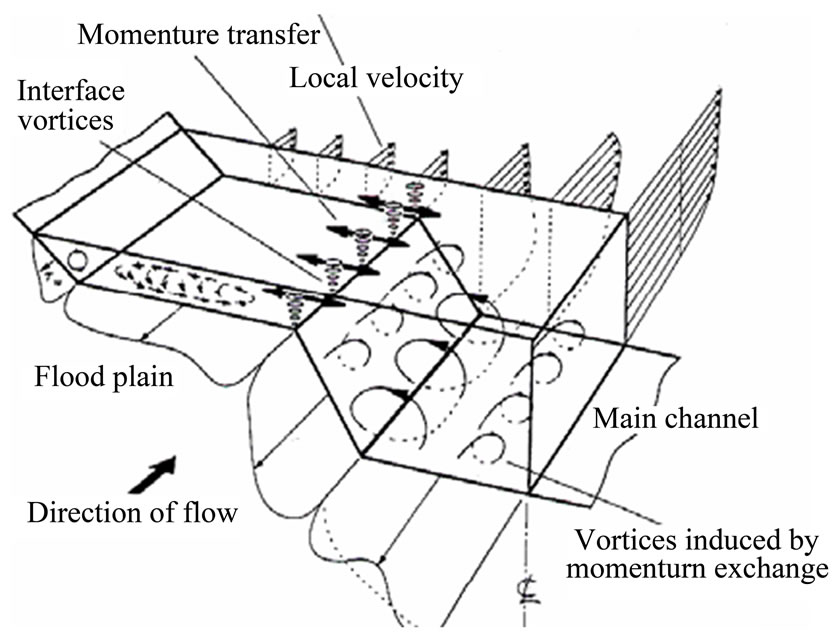
Figure 9 Flow structure in a two-stage channel (modified from Knight and Shiono)
layed arrival of sediment from tributary in the 2006 flood, the hysteresis can be considered as a mechanism by which the peak flow velocity entrained in-channel sediment deposits and the enhanced cross-sectional mixing due to channel configuration sustained the suspended sediment concentration during the falling limb of the flood.
During the 2007 flood, the water level rose quickly through the level of point bar and continued to rise to a depth of 2.8 m over the point bar. Therefore, the time lag between maximum velocity and highest water level was negligible and the lateral momentum exchange was insignificant in the 2007 flood. In other words, the flood in 2007 behaved as like a flood in a single section channel.
According to Equation (9), at the time when the water level reaches its highest, the flow would be able to carry more sediment if the maximum velocity coincided. Therefore, the time lag between maximum velocity and highest water level reduces the flow capacity to transport suspended sediment.
According to the Kleitz-Seddon formula of flood propagation, flood-wave celerity is greater than flow velocity. Then, one may conclude that the peak of suspended sediment concentration should arrive at a gauging station after the flood-wave peak has passed because suspended sediment is transported at stream flow velocity. The small flood in 2008 was just the case. However, the 2006 flood was a different case. The reason is that the quasi-steady assumption used in deriving the Kleitz-Seddon formula did not hold in large floods. When the effect of water surface variation is considered, differentiating the Manning formula of flow velocity with time led to
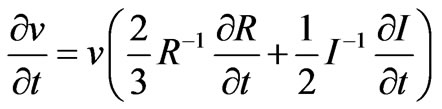 (12)
(12)
where I is the water surface slope (–dH/dt). At the time of highest water level, dR/dt = 0; –dH/dt < 0 at upstream and –dH/dt > 0 at downstream, consequently,
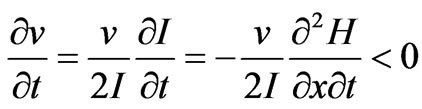 (13)
(13)
This implies that the peak of flow velocity is ahead of highest water level when the variation of water surface slope cannot be neglected.
By comparing flood discharge data with the morphological change of Enshuda Coast, it was found that the river discharge below 6.0 × 10³ m3/s supplied little sediment to the coast (Sato [29]). This confirms the finding that a 10-year flood in the Lower Tenryu River is not sufficiently effective in generating sediment flux from the river to the coast.
Since very large floods did not occur frequently in reality, the strategy to increase sediment delivery would have to be placed on enhancing the carrying capacity of median floods through channel manipulation.
4. Conclusions
In the Lower Tenryu River, suspended sediment was transported in different modes according to the magni-
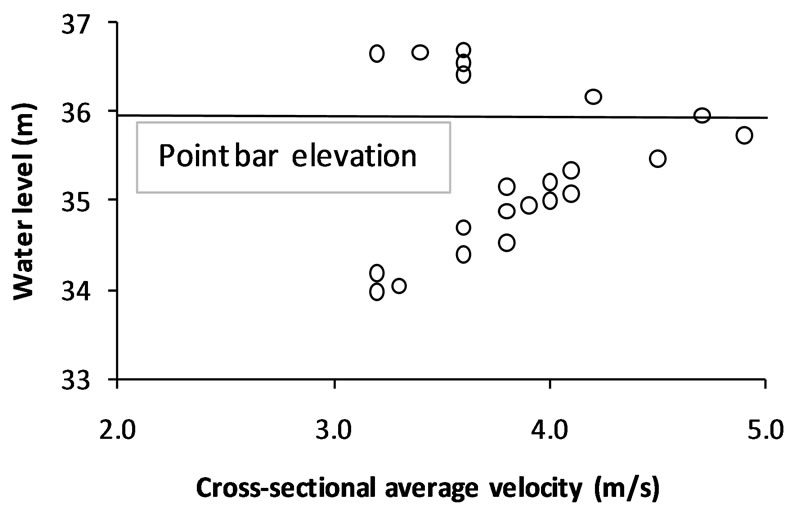
Figure 10. Time lag between maximum velocity and highest water level.
tudes of flood. In a 30-year flood, the suspended sediment transport was supply-limited. However, during a 10-year flood and a small frequent flood, the mechanism was found to be transport-limited. In the supply-limited case, the variation of SSC followed the hydrograph well. In the transport-limited case, however, there was a time lag between the peak discharge and maximum concentration. It was further clarified that the cause of hysteresis in the 10-year flood was related to a point bar, while the time lag in the small flood can be attributed to the fact that flood celerity is greater than flow velocity. Besides, it was revealed that the symmetry of the 30-year flood hydrograph could be reproduced by a four parameter Pearson Type-Ill distribution with a value of less than 1.15 for skewness.
The findings of the present study indicate that the occurrence of hysteresis in the relationship between sediment concentration and flow discharge is not just a matter of sediment source but related to flood magnitude and affected by channel morphology. It also serves as a general warning that sediment-discharge rating curves must be used with caution; a relation between suspended sediment concentration and flow discharge obtained from one storm event may not be translatable to events of different magnitudes. Since most of the annual sediment transport usually takes place during a few events (Kronvang et al. [30]), thus it is very important to develop better understanding on the short-term dynamics of suspended sediment and refine the rating curve approach in order to have an accurate estimate of annual suspended sediment loading and discuss management strategy. In the case of the Lower Tenryu River, the suspended sediment hysteresis in a 10-year flood implies that a new strategy must be sought to increase sediment delivery for the purpose of beach protection along the Enshunada Coast.
5. Acknowledgements
This work is part of the Enshunada project supported by Japan Science and Technology Agency. The authors are grateful to Hamamatsu River and Road Administration Office for the supply of valuable field measurement data.
REFERENCES
- U.S. Environmental Protection Agency, “Report of the Federal Advisory Committee on the Total Maximum Daily Load (TMDL) Program,” EPA 100-R-98-006, 1998.
- D. E. Walling, “Assessing the Accuracy of Suspended Sediment Rating Curves for a Small Basin,” Water Resources Research, Vol. 13, 1997, pp. 531-538. doi:10.1029/WR013i003p00531
- J. V. Sickle and R. L. Beschta, “Supply-Based Models of Suspended Sediment Transport in Streams,” Water Resources Research, Vol. 19, No. 3, 1983, pp. 768-778. doi:10.1029/WR019i003p00768
- A. Steegen, G. Govers, J. Nachtergale, I. Takken, L. Beuselinck and J. Poesen, “Sediment Export by Water from an Agricultural Catchment in the Loam Belt of Central Belgium”, Geomorphology, Vol. 33, No. 1-2, 2000, pp. 25-36. doi:10.1016/S0169-555X(99)00108-7
- M. D. Morehead, J. P. Syvitski, E. W. H. Hutton and S. D. Peckham, “Modeling the Temporal Variability in the Flux of Sediment from Ungauged River Basins,” Global and Planetary Change, Vol. 39, No. 1-2, 2003, pp. 95-110. doi:10.1016/S0921-8181(03)00019-5
- M. Klein, “Anti Clockwise Hysteresis in Suspended Sediment Concentration during Individual Storms,” Vol. 11, No. 1-3, 1984, pp. 251-257.
- G. P. Williams, “Sediment Concentration Versus Water Discharge during Single Hydrologic Events in Rivers,” Journal of Hydrology, Vol. 111, No. 1-4, 1989, pp. 89-106. doi:10.1016/0022-1694(89)90254-0
- C. G. Crawford, “Estimation of Suspended-Sediment Rating Curves and Mean Suspended-Sediment Loads,” Journal of Hydrology, Vol. 129, No. 1-4, 1991, pp. 331-348. doi:10.1016/0022-1694(91)90057-O
- M. A. Lenzi and L. Marchi, “Suspended Sediment Load during Floods in a Small Stream of the Dolomites (Northeastern Italy),” Catena, Vol. 39, No. 4, 2000, pp. 267- 282.
- M. B. Jansson, “Determining Sediment Source Areas in a Tropical River Basin, Costa Rica,” Vol. 47, No. 1, 2002, pp. 63-84.
- T. Krueger et al., “Uncertainties in Data and Models to Describe Event Dynamics of Agricultural Sediment and Phosphorus Transfer,” Journal of Environmental Quality, Vol. 38, No. 3, 2009, pp. 1137-1148. doi:10.2134/jeq2008.0179
- C. Duvert, et al., “Drivers of Erosion and Suspended Sediment Transport in Three Headwater Catchments of the Mexican Central Highlands,” Geomorphology, Vol. 123, No. 3-4, 2010, pp. 243-256. doi:10.1016/j.geomorph.2010.07.016
- J. Brasington and K. Richards, “Turbidity and Suspended Sediment Dynamics in Small Catchments in the Nepal Middle Hills,” Hydrological Processes, Vol. 14, No. 14, 2000, pp. 2559-2574. doi:10.1002/1099-1085(20001015)14:14<2559::AID-HYP114>3.0.CO;2-E
- J. F. Orwin and C. C. Smart, “The Evidence for Paraglacial Sedimentation and Its Temporal Scale in the Deglacierizing Basin of Small River Glacier, Canada,” Geomorphology, Vol. 58, No. 1-4, 2004, pp. 175-202. doi:10.1016/j.geomorph.2003.07.005
- I. Nagashima, N. Iwasaki, T. Uda and T. Arimura, “Beach Erosion of Enshu-Nada Coast West of Mouth of Tenryu River,” Annual Coastal Engineering Journal, Vol. 2, 2005, pp. 596-600.
- H. Liu, S. Kishimoto, T. Takagawa, M. Shirai and S. Sato, “Investigation of the Sediment Movement along the Tenryu–Enshunada Fluvial System Based on Feldspar Thermoluminescence Properties,” Journal of Coastal Research, Vol. 25, No. 5, 2009, pp. 1096-1105. doi:10.2112/08-1065.1
- M. A. Velikanov, “Gravitational Theory of Sediment Transport,” Journal of Science of the Soviet Union, Geophysics, Vol. 4, 1954.
- R. A. Bagnold, “An Approach to the Sediment Transport Problem from General Physics,” U.S. Geological Survey Professional Paper 422-J, 1966, p.37.
- R. J. Zhang, “A Study of the Sediment Transport Capacity of the Middle and Lower Yangtze River,” Chinese Journal of Sediment Research, Vol. 4, No. 2, 1959.
- R. J. Zhang, “River Dynamics,” China Industry Press, Beijing, 1961.
- E. W. Dietrich, “Settling Velocity of Natural Particles,” Water Resources Research, Vol. 18, No. 6, 1982, pp. 1615-1626. doi:10.1029/WR018i006p01615
- V. M. Ponce and F. D. Theurer, “Accuracy Criteria in Diffusion Routing,” Journal of Hydraulics Division, Proceedings of the American Society of Civil Engineers, Vol. 108, No. 6, 1982, pp. 747-757.
- J. Garbrecht and G. Brunner, “Hydrologic Channel Flow Routing for Drainage Networks,” Journal of Hydraulic Engineering, Vol. 117, No. 5, 1991, pp. 629-642.
- P. Y. Julien, “Erosion and Sedimentation,” Cambridge University Press, Cambridge, 1995.
- T. Ishigaki and H. Imamoto, “Experimental Study on 3-D Flow Structure in Compound Open Channel Flows,” Journal of Hydraulic, Coastal and Environmental Engineering, Vol. 515, No. 31, 1995, pp. 45-54.
- D. W. Knight and K. Shiono, “Chapter 5: River Channel and Floodplain Hydraulics, Floodplain Processes,” In: M. G. Anderson, D. E. Walling and P. D. Bates, Eds., River Channel and Floodplain Hydraulics, Floodplain Processes, John Wiley and Sons Ltd., 1996.
- S. Ikeda and T. Kuga, “Laboratory Study on Large Horizontal Vortices in Compound Open Channel Flow,” Journal of Hydraulic, Coastal and Environmental Engineering, Vol. 558, No. 38, 1997, pp. 91-102.
- S. Ikeda, T. Sano, M. Fukumoto and K. Kawamura, “Organized Horizontal Vortices and Lateral Sediment Transport in Compound Open Channel Flows,” Journal of Hydraulic, Coastal and Environmental Engineering, Vol. 656, No. 52, 2000, pp. 135-144.
- S. Sato, “Dynamics of Sand Movement on Hamamatsu Coast Facing Enshunada,” Journal of Hydraulic, Coastal and Environmental Engineering, Vol. 64, No. 3, 2008, pp. 192-201. doi:10.2208/jscejb.64.192
- B. Kronvang, A. Laubel and R. Grant, “Suspended Sediment and Particulate Phosphorus Transport and Delivery Pathways in an Arable Catchment, Gelbaek Stream, Denmark,” Hydrological Processes, Vol. 11, No. 6, 1997, pp. 627-642. doi:10.1002/(SICI)1099-1085(199705)11:6<627::AID-HYP481>3.0.CO;2-E