Atmospheric and Climate Sciences
Vol.4 No.4(2014), Article
ID:49840,6
pages
DOI:10.4236/acs.2014.44051
Temporal Variation of the Concentration of Carbon Monoxide in the Center West of Brazil
Amaury de Souza1, Flavio Aristones1, Gustavo Becker Modesto Silva1, Widinei Alves Fernandes1, Catia Braga2
1Federal University of Mato Grosso do Sul, Institute of Physics, Campo Grande, MS, Brazil
2CEMTEC—Monitoring Center of Weather, Campo Grande, MS, Brazil
Email: amaury.de@uol.com.br
Copyright © 2014 by authors and Scientific Research Publishing Inc.
This work is licensed under the Creative Commons Attribution International License (CC BY).
http://creativecommons.org/licenses/by/4.0/


Received 29 June 2014; revised 30 July 2014; accepted 29 August 2014
ABSTRACT
South Mato Grosso has been developing very rapidly in recent decades, and it is clearly leaving behind the status of being solely an agricultural region to become an important state in the areas of commerce and industry. Nevertheless, it is still possible to observe the harmful effects of atmospheric pollution due to biomass burning activities, even if those actions are being systematically reduced in the state throughout the past several years. This kind of pollution persists not only due to local activities but also due to the pollution of other states and even other border countries. Satellite remote sensing has proven to be an important tool of environmental control vis-à-vis the ease of data acquisition, accuracy and wide temporal range. A study has been conducted of spatial and temporal concentration of carbon monoxide (CO) in the state of South Mato Grosso from 2001 through 2012 using the MOPITT sensor onboard the TERRA satellite. The carbon monoxide comes principally from the incomplete combustion of vehicles engines and biomass burnings. A direct correlation of the CO concentration in the state of South Mato Grosso is observed precisely during the months of drought (August to October), for which the number of fire outbreaks is the highest of the year.
Keywords:Carbon Monoxide, MOPITT, Biomass Burning

1. Introduction
Earth is a gigantic sphere covered by water, rocks and soil that evolved by a huge mixing of gases. Such a cover layer of gases, generally referred to as air, is kept on the planet surface by gravitational force, which is scientifically denominated atmosphere [1] . The relationship between mankind and the atmosphere is a long story with obstacles which have arisen due to the severe pollution produced by anthropogenic sources. The term “air pollution” is defined by the EPA (Environmental Protection Agency) as [2] : the presence of contaminants or polluting substances in the air that interfere with the well-being and health of mankind or that produce harmful effects on the environment. One of the main aggravating conditions to the quality of the air in human history is the process of industrialization [3] .
The association between the harmful effect on human health and atmospheric pollution has been established from sharp episodes of air contamination and studies about the event of thousands of deaths registered in London in 1948 and 1952. In the case of Sao Paulo Metropolitan Region (SPMR), the random growth observed in the capital and in neighboring cities, especially in the so-called ABC region, after World War II, led to the installation of numerous large industries without concern for controlling the emissions of atmospheric polluting agents, when it was possible to see chimneys emitting huge amounts of smoke [4] .
The model for environmental standards and improvement of the air quality is a point that is being constantly discussed both in national and international legislations. Back in the 18th century the governing principle was the identification of the main chemical compounds of the atmosphere. Nonetheless, in the beginning of the 20th century the idea was to analyze the trace amounts of gases (less than 1 part per million in volume of air) and define which elements should be considered as pollutants [5] . The EPA considers the six most important elements that are controlled by the American system of air quality, which are: particulate matter; tropospheric ozone; carbon monoxide; nitrogen oxides; sulfur dioxide and lead. In Brazil the CONAMA 03/90 [6] has a similar list with small differences. Lead is not listed in the legislation and the particulate matter is subdivided into total number of particles, inhalable particles (MP10) and smoke [7] .
The tropospheric studies traditionally have been based on field campaigns, regular terrestrial and aerial measurements, as well as on contributions from the modeling of chemical agent transports. Remote sensor satellites offer a better opportunity to obtain global measurements of trace gases and aerosols on the troposphere during long periods of time [8] . The purpose of this paper is to analyze the spatial and temporal distribution of carbon monoxide in the state of South Mato Grosso—Brazil, thru the data obtained from the MOPITT sensor placed onboard the TERRA satellite and to study the behavior of CO concentrations close to the earth’s surface and divided by atmospheric profiles.
South Mato Grosso is located in the western of Brazil and belongs to the region called Middle-West, being locally abbreviate as MS. It has international borders with Bolivia and Paraguay; a total of 2.5 million inhabitants and only 7 inhabitants per square km (or 18 by square mile). Typical climate is divided in two main characteristics: humid subtropical and tropical. The typical landscape is called “cerrado” characterized by extensive savannas including various type of vegetation. The more important differential of South Mato Grosso is the region called The Pantanal, which is the largest flooded lowland on the planet and the third largest environmental reserve in the world.
2. Methodology
MOPITT Sensor
MOPITT is the first satellite sensor to use gas correlation spectroscopy, which is a correlation spectrometer of four channels operating in scan cross-track mode. The sensor measures both emitted and reflected Earth radiation in three spectral bands. The light going inside the sensor passes along two different paths thru distinct compartments filled with carbon monoxide and methane. These paths seize different amounts of energy being conducted to small variations on the resulting signals that are correlated to the presence of these gases in the atmosphere [9] .
22 km is the spatial resolution of the MOPITT at the nadir, leading it to “see” the earth as strips of 640 km of extension, allowing a total scanning of the globe every three days [10] . In addition, it can measure the concentration of carbon monoxide within every 5 km layers along the vertical column of the atmosphere, helping scientists to track the emitting sources of that gas.
In this paper the data from the MOPITT sensor obtained between 2001 and August 2012 have been analyzed. The chosen area of study corresponds to the state of South Mato Grosso located in the west central region of Brazil, along the following coordinates: 16˚South and 57˚West, and 22˚South and 55˚West.
The following results were obtained from the daily concentration detected by the MOPITT sensor. They are presented as concentration of the integrated column, i.e., considering the entire atmosphere for different levels (surface, 900 hPa, and every 100 hPa down to the final 100 hPa of pressure).
3. Results and Discussion
The monthly distribution of concentrations of the total column for over a decade of data obtained for all the South Mato Grosso territory is exhibited in Figure 1. The highest concentrations occurred during August, September and October. It is noticeable that the concentration of CO increases during the winter time period, certainly due to the fact that meteorological conditions are more unfavorable to the polluting elements dispersion, as the winds are weaker and the solar radiation arriving at the surface is smaller. These two processes imply that the thermal and mechanical production of TKE (Turbulent Kinetic Energy) is small avoiding the vertical development of the PLL (Planetary Limit Layer). During the winter period the intensity of the surface thermal inversion is larger than the one occurring during the summer period, due to the radioactive surface night cooling being higher during the winter.
The seasonal variation of the month’s daily average of carbon monoxide shown in Figure 1 indicates that the highest CO concentration occur during the months of August, September and October and its monthly average varies from 73.41 to 138.55 ppb (parts per billion). The higher concentrations measured between August and October repeat themselves during the entire period except for small fluctuations from year to year. The maximum concentration observed is 138.5 ppb while the smallest one is 71.18 ppb. The small peaks appearing in December of 2003 and 2009 are particularly noticeable and they are probably linked to the last two particular years of moderate intensity of El Niño, even though such a conclusion requires other quantitative analysis.
In spite of the existing variation among the results throughout the years it is possible to observe that the monthly averages indicate a minimum background value as well as that the maximum value always occurs during the same period of the year. The values above the background are essentially due to the biomass burning fires and during the dry months, which coincide with the local winter and the beginning of the spring season, when the major biomass fire spots occur. The biomass fire burnings are the major source of CO of the whole Southern Hemisphere, principally in Africa and South America. This same aspect is also found in Brazil wherein the critical period of fire burnings in the west central region occur between the months of July and September. Such a period corresponds to the local winter season that is cold and dry and, despite of the spontaneous firewood occurring in the region, the majority of the burnings originate from anthropogenic sources. Those fires are deliberately set in the rural zone to facilitate the harvest of monocultures like sugarcane and soybean, as well as to clean up the pastures.
Figure 2 exhibits the average concentration of CO obtained for August, September and October at the earth’s surface and also for the other profiles. The highest values of CO concentration are found for 800 hPa and 700
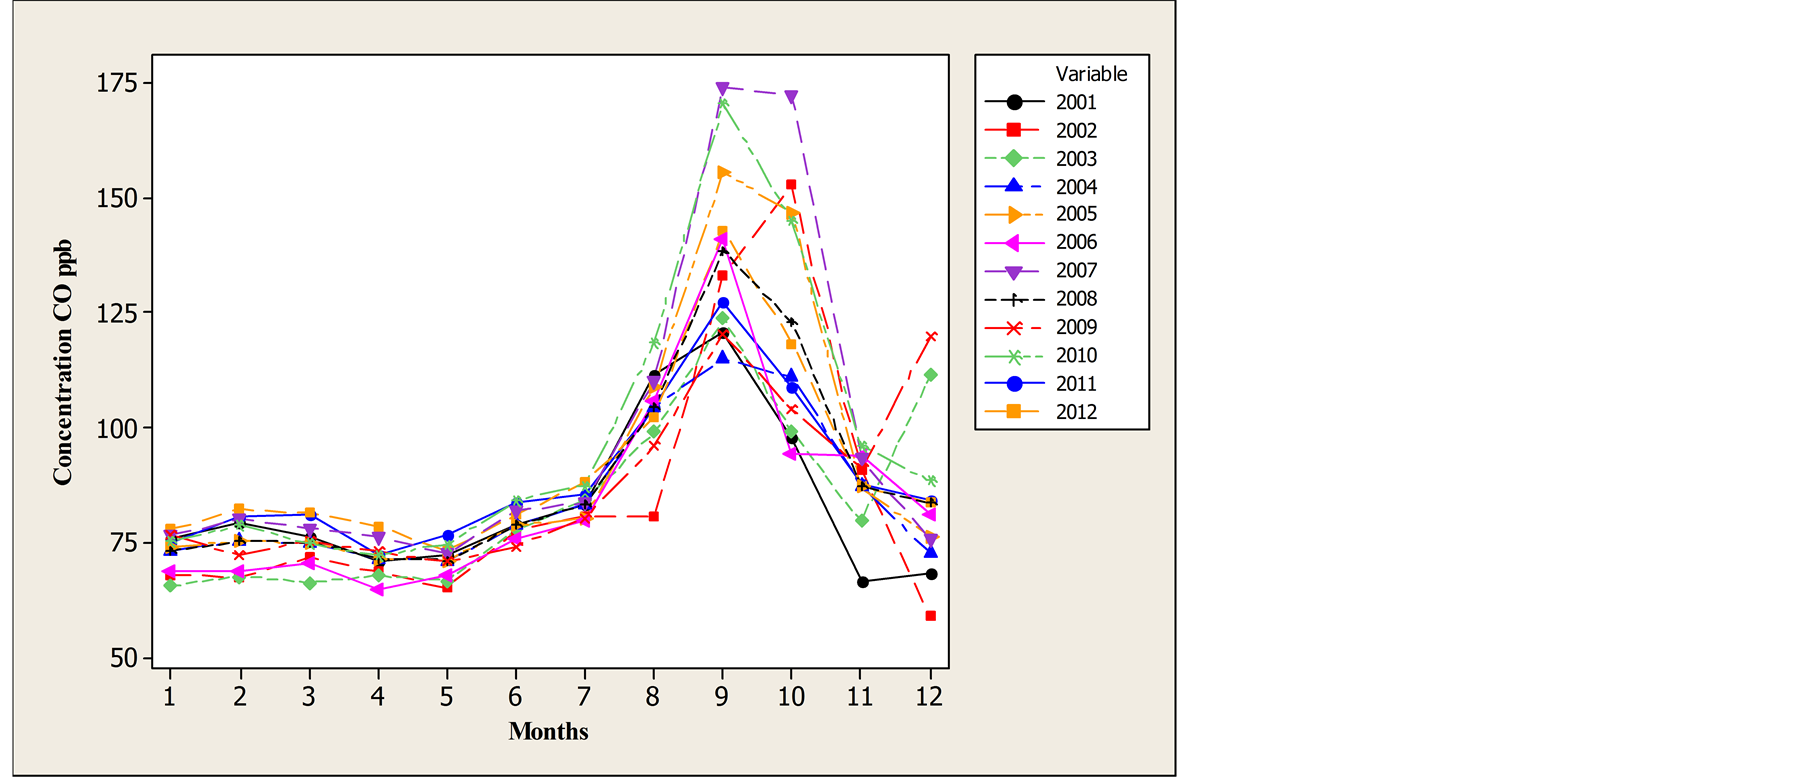
Figure 1. Monthly average concentration of the total carbon monoxide column from 2001 to 2012 for the state of South Mato Grosso, Brazil.
hPa pressures and not for the highest values of pressure of 900 hPa at the earth’s surface.
The diurnal evolution of the hourly average obtained for every month of the carbon monoxide is exposed in Figure 3 and indicates that the concentration presents two maxima and two minima for all season. The first maximum occurs between 07:00 and 08:00 hours and the second maximum occurs between 19:00 and 20:00 hours. On the other hand, the two values of minimum occur close to 04:00 and to 17:00 respectively.
The progressive decay of CO concentration at the surface during the dawn reaching a minimum is a typical characteristic of the region (Figure 2 and Figure 3). Such a value corresponds to the background concentration of CO applicable to the region and it can be observed due to the diminution of traffic intensity of vehicles. Conversely, the relative minimum of CO concentration at the mid-afternoon presents a large variability. The second relative minimum is associated in addition to the reduction of vehicular traffic, to the increase of the PLL top clean air entangling1 and the horizontal advection.
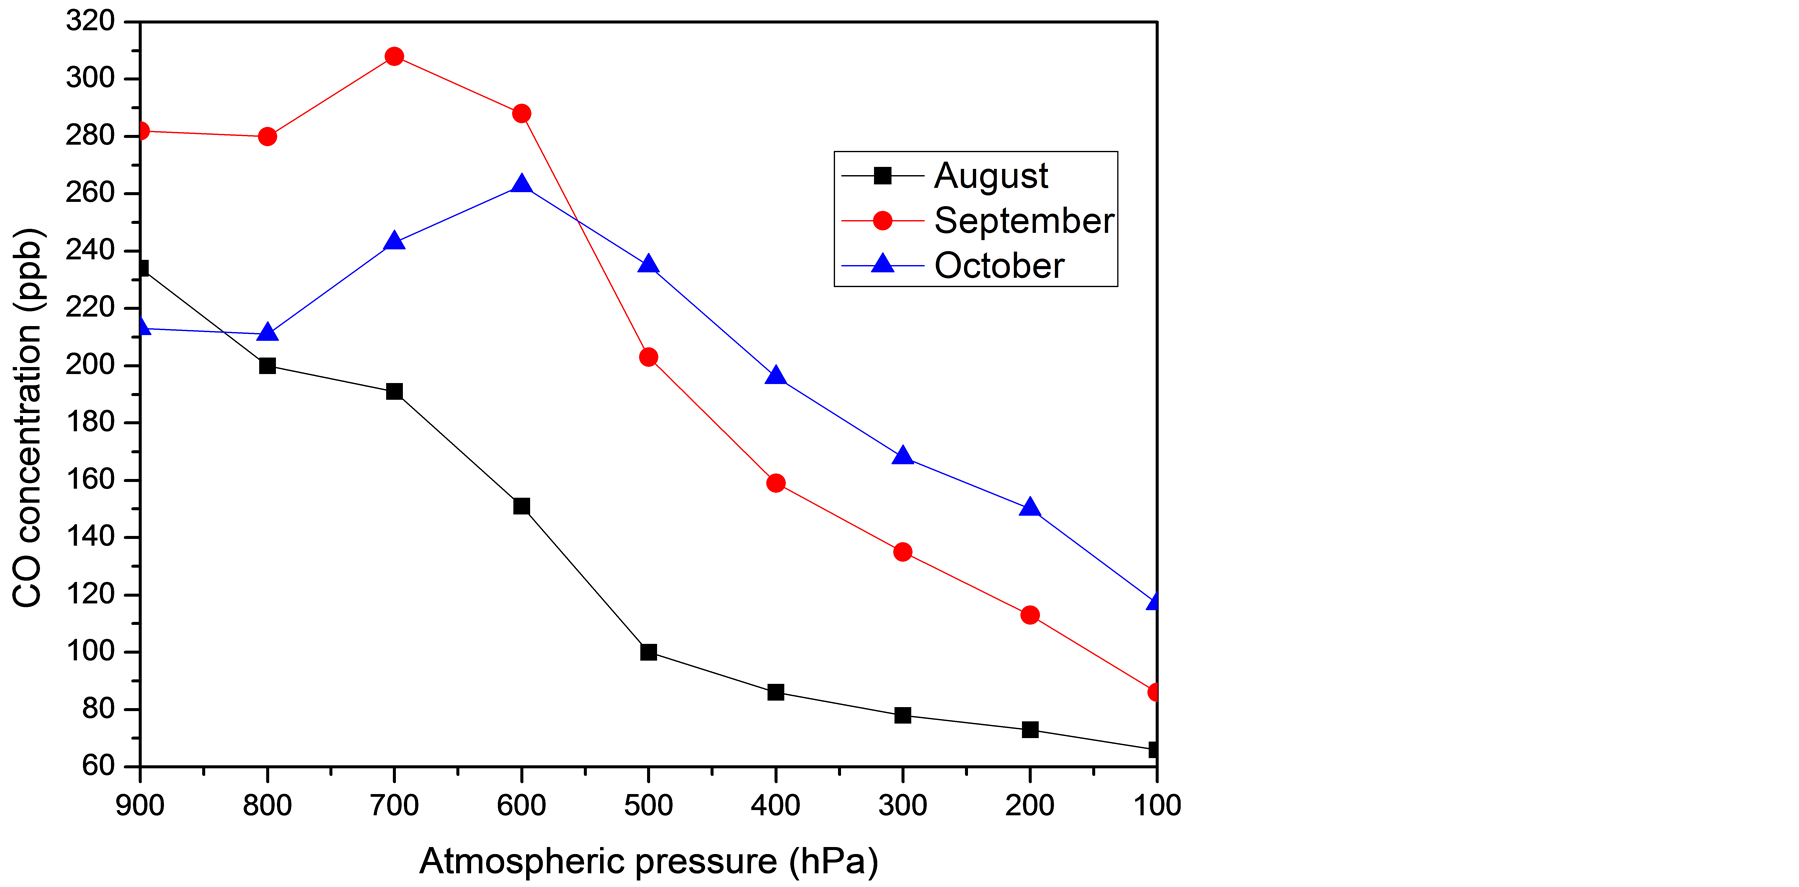
Figure 2. Average concentration of CO (ppb) as a function of the atmospheric profiles for August, September and October.
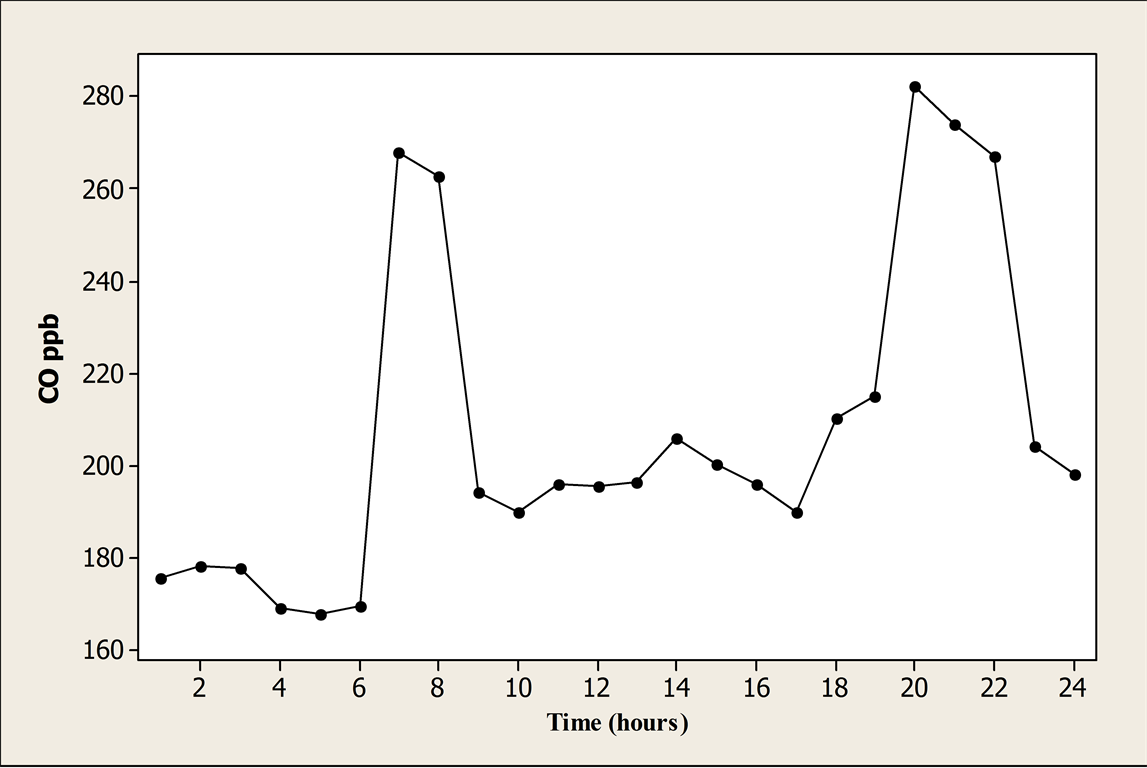
Figure 3. Average diurnal evolution of carbon monoxide concentrations for the period 2001-2012.
The intensification of CO concentration during the dusk period is related to the intensity of vehicles traffic and the smaller efficiency presented by the turbulence to disperse the polluting elements into the atmosphere. At that time the PLL becomes stable and its intensity is determined by the mechanical intensity of TKE production. Thus, a part of the diurnal cycle of the surface CO is associated with the cycle of bimodal vehicle emissions [11] -[16] .
The standard bimodal presented in the cycle of vehicle emissions is more intense during the autumn/winter months than during the summer period. However, the minimum of CO concentration around 06:00 local time occurs in every month of the year. At this time the source of emission is small.
Generally the CO concentration remains within acceptable values throughout the year, presenting problematic values only during the months of August, September and October when the numbers are very much higher. Such a variation considerably increases the health risks to the population in relation to respiratory diseases and other issues induced by pollution.
4. Conclusions
This paper is anchored on results obtained from the sensor MOPITT that is onboard of the satellite named TERRA. Such an environmental satellite seeks to help the improvement of the atmospheric dynamic comprehension and the interference by mankind. Data have been used also from the Aeronet platform [17] .
The results extracted and presented here revealed a seasonal behavior of the carbon monoxide concentration with maximum values through August till October and background values during the rest of the year. This characteristic is mainly related to the period of drought in the State and consequently to the period of biomass burning fires.
The highest values for the CO concentration from August to October in South Mato Grosso happen due to firewood and to the transport of pollutants arriving from other regions with higher incidences of wildfires. The atmospheric profiles show that the CO values at the troposphere decrease as the considered position deviates from the surface. Nevertheless, the fact cannot be ignored that considerable samples of carbon monoxide have been found at higher altitudes, either transported by the wind or derived from convective processes, modifying the upper troposphere behavior.
Finally, the remote sensing used as an investigative tool has been shown to be very useful for environmental studies due to its large scope, reliability and data availability. Sensors like the MOPITT and others present in environmental satellites facilitate the research of sporadic or conventional events at the local, regional or global atmosphere.
Acknowledgements
The authors are particularly grateful to Ms. Victoria Tangi for English editing and text revision.
References
- Alvarez, H.B. (2008) Introduction. In: Theodore, L., Ed., Air Pollution Control Equipment Calculations, John Wiley & Sons Inc., Hoboken, 2.
- EPA. Environmental Protect Agency. http://www.epa.gov/airquality/particlepollution/
- Theodore, L. (2008) Air pollution Control Equipment Calculations. John Wiley & Sons Inc., Hoboken, 10. http://dx.doi.org/10.1002/9780470255773
- CETESB. State of Sao Paulo Environmental Company. http://www.cetesb.sp.gov.br/ar/informacoes-basicas/20-historico
- Seinfield, J.H. and Pandis, S.N. (2006) Atmospheric Chemistry and Physics: From Air Pollution to Climate Change. 2nd Edition, John Wiley & Sons Inc., Hoboken.
- BRASIL. Laws and etc. Text about the National Programa of Air Pollution Control. Conama resolution number 05 of 06/15/1989, Complemented by Resolutions Number 3 and 8/90. Published in DOU on 08/25/1989, Section i, pages 14713-14714. http://www.mma.gov.br/port/conama/legiabre.cfm?codlegi=81
- CETESB. State of Sao Paulo Environmental Company. http://www.cetesb.sp.gov.br/ar/Informa??es-B?sicas/21-Poluentes
- Edwards, D.P., Emmons, L.K., Gille, J.C., Chu, A., Attié, J.-L., Giglio, L., Wood, S.W., Haywood, J., Deeter, M.N., Massie, S.T., Ziskin, D.C. and Drummond, J.R. (2006) Satellite-Observed Pollution from Southern Hemisphere Biomass Burning. Journal of Geophysics Research, 111.
http://dx.doi.org/10.1029/2005JD006655 - WDC-RSAT—World Data Centre for Remote Sensing of the Atmosphere.
https://wdc.dlr.de/sensors/mopitt/ - Worden, J., Aben, I., Bowman, K.W., Clerbaux, C., Coheur, P.F., de Laat, A.T.J., Detweiler, R., Drummond, J.R., Edwards, D.P., Gille, J.C., Hurtmans, D., Luo, M., Martínez-Alonso, S., Massie, S., Pfister, G. and Warner, J.X. (2013) Decadal Record of Satellite Carbon Monoxide Observations. Atmospheric Chemistry and Physics, 13, 837-850. http://dx.doi.org/10.5194/acp-13-837-2013
- Andrade, F., Orsini, C. and Maenhaut, W. (1994) Relations between Aerosol Sources and Meteorological Parameters for Inhalable Atmospheric Particles in Sao Paulo City, Brazil. Atmospheric Environment, 28, 2307-2315. http://dx.doi.org/10.1016/1352-2310(94)90484-7
- Massambani, O. and Andrade, M.F. (1994) Seasonal Behavior of Tropospheric Ozone in the Sao Paulo (Brazil) Metropolitan Area. Atmospheric Environment, 28, 3165-3169.
- Castanho, A.D.A. and Artaxo, P. (2001) Wintertime and Summertime Sao Paulo Aerosol Source Apportionment Study. Atmospheric Environment, 35, 4889-4992. http://dx.doi.org/10.1016/S1352-2310(01)00357-0
- Martinis, B.S., Okamoto, R.A., Kado, N.Y., Gundel, L.A. and Carvalho, L.R.F. (2002) Polycyclic Aromatic Hydrocarbons in Bioassay-Fractionated Extract of PM10 Collected in Sao Paulo, Brazil. Atmospheric Environment, 36, 307-314. http://dx.doi.org/10.1016/S1352-2310(01)00334-X
- Miranda, R.M., Andrade, M.F., Worobiec, A. and Grieken, R.V. (2002) Characterization of Aerosol Particles in the Sao Paulo Metropolitan Area. Atmospheric Environment, 36, 345-352.
http://dx.doi.org/10.1016/S1352-2310(01)00363-6 - Sanchez-Ccoyollo, O.R. and Andrade, M.F. (2002) The Influence of Meteorological Conditions on the Behavior of Pollutants Concentration in Sao Paulo, Brazil. Atmospheric Environment, 116, 257-263.
- AERONET. Aerosol Robotic Network. http://aeronet.gsfc.nasa.gov/cgi-bin/bamgomas_interactive
NOTES

1The process of the convective PLL growing is denominated entangling. It occurs when the free atmosphere air is displaced in the vertical towards inside the PLL along with the altitude thermal inversion layer. This air, which is initially not turbulent, becomes turbulent as it gets mixed with the PLL air.