Atmospheric and Climate Sciences
Vol.3 No.3(2013), Article ID:33894,16 pages DOI:10.4236/acs.2013.33034
Dust Events in the Western Parts of Iran and the Relationship with Drought Expansion over the Dust-Source Areas in Iraq and Syria*
Atmospheric Sciences and Meteorological Research Centre, Tehran, Iran
Email: #ali_didehvar714@yahoo.com
Copyright © 2013 Mojtaba Zoljoodi et al. This is an open access article distributed under the Creative Commons Attribution License, which permits unrestricted use, distribution, and reproduction in any medium, provided the original work is properly cited.
Received April 22, 2013; revised May 23, 2013; accepted June 1, 2013
Keywords: Dust Events; Droughts; VHI; Correlation; T-Student Test and Iran; Iraq; Syria
ABSTRACT
The most famous deserts exist in subtropical regions which is the direct outcome of insufficient precipitation and high temperatures. The Middle East deserts are subjected often to dust, which reduces horizontal visibility to 5 km, and sometimes even to less than 100 m. The severe and prolong drought recently afflicting the west Asia region has been suggested to be instrumental in producing an increased output of dust into the atmosphere from the region. Regarding the increasing of dust events over the west of Iran with the external origin in the recent decade (from 2000 to present), so the main dust-source areas over Iraq and Syria have been detected using the dust-source map of the southwest of Asia, satellite images and soil type maps. We considered the relationship between the increasing of dust events in the western of Iran and drought expansion over the main dust-production areas during the recent decade. Dust frequency data series, and drought variables which include the VHI (vegetation health index), precipitation and temperature data series in long-term and monthly scales have been monitored and compared. And then we used the correlation analysis that indicated the significant proximity between the dust events and droughts/dryness in a yearly scale and also during the warm season (May to Aug). Meantime the derived results from the T-student test for the aforementioned data series confirm the fact that the droughts are parallel to the increasing of dust events from 1996 to 2011 (especially in the recent decade). We found that the recent droughts in the external dust source areas had the remarkable potential to increase the dust events in the west of Iran.
1. Introduction
In arid and semiarid areas, dust storms occur frequently. Sand and dust storms (SDS) have caused devastating damages to properties and human health in the southwest of Asia. When surface winds are strong, large amounts of sand and dust can be lifted from bare, dry soils into the atmosphere and transported downwind affecting regions hundreds to thousands of kilometers away. Dust storms are most commonly caused by strong pressure gradients which cause an increase in wind velocity over a wide area. For countries in and downwind of arid regions, dust storms may cause a variety of problems. One of the major problems is a considerable reduction of visibility that limits various activities, increases traffic accidents, and may increase the occurrence of vertigo in aircraft pilots [1-3]. Other environmental impacts, reported in the literature [4-6] include reduced soil fertility and damage to crops, a reduction of solar radiation and in consequence the efficiency of solar devices, damage to telecommunications and mechanical systems, dirt, air pollution, increase of respiratory diseases and so on. Three main categories of reduced visibility are often used to describe the severity of dust storms: 1) Blowing Dust—the horizontal visibility (due to aeolian dust), is less than 11 km; 2) Dust Storm—the horizontal visibility is less than 1000 m, 3) Severe Dust Storm—the horizontal visibility is less than 200 m.
Atmospheric aerosols exert a significant impact on the earth’s radiation balance and on local and regional climate. They can also result in adverse effects on human health, particularly in areas with elevated levels of anthropogenic and/or natural atmospheric particles. Southwest Asia is a particularly important source of dust, and airborne dust particles from the desert are often transported over long distances.
In some seasons in certain regions of the Middle East and North Africa and for about 30% of the time on average, the dust conditions in the lower troposphere fall into one of these three categories [7]. Thus, in these regions, dust storms are a very frequent phenomenon and a better knowledge of their spatial and temporal distribution is of prime importance. A positive correlation exists between the quantity of dust in the air, and the wind velocity. whereas, a negative correlation exists between dust amount and the particles size. Precipitation and/or vegetation coverage may reduce considerably the amount of dust in the air for a given wind velocity and/or particle’s size [8-10]. Thus, a study of the moisture and thermal stress, precipitation oscillations, which directly affect the vegetation covers in a given region, is crucial to understand the expansion of dust source areas, and then the increase of dust storms over the regions in downwind of the dust source areas.
Almost from 2000 to present, the frequency and intensity of dust storms over Iran, particularly in western and southwestern regions of the country have been increased remarkably (Figure 1). interesting is that the dust storms occur in parallel to the dryness and desertification progress as well as the droughts, which may be refereed in major as a result of the ongoing global warming. The 2001-2012 warmest decade was the strongest in the past 30 - 40 years, the process of drought intensification, expansion and penetration into the new areas has started [11].
In recent years, systematic research on dust storms has been carried out. Dust storm climatology, in east of Asia, is quite well documented through the analyses of synoptic records over the past 50 years [12-17] and of satellite data of recent years. Sun et al. (2001, 10331) [12] ana-
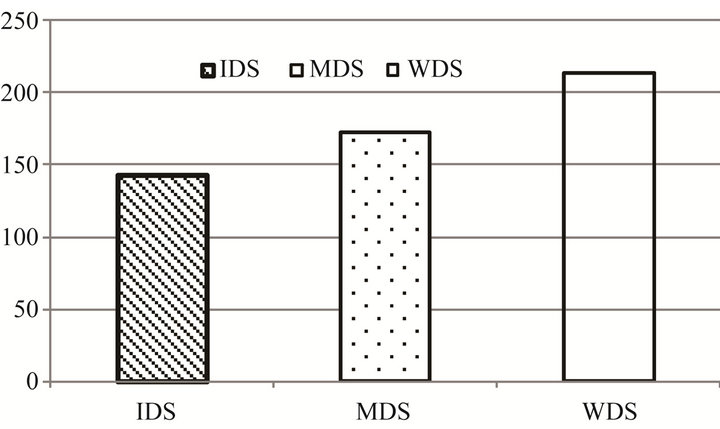
Figure 1. The frequency of dust storms with different severities (where; IDS, MDS and WDS are Intensive, Moderate and weak Dust Storms respectively) in Iran during the recent 10 years.
lyzed the synoptic reports over the 40year period between 1960 and 1999 and found the Gobi in Mongolia and north China is a major dust source. Haim Kutiel and Hadar Furman in 2003 [7] have developed a research on “dust storms in the Middle East” they found that Sudan, Iraq, Saudi Arabia and the Persian Gulf, are the regions that reported the greatest occurrence of dust storms. Dust storms in Iran, north-eastern Iraq and Syria, the Persian Gulf and southern Arabian Peninsula are more frequent in summer. In western Iraq and Syria, Jordan, Lebanon, northern Arabian Peninsula and southern Egypt they occur mainly in the spring. Middleton NJ, 1986 [18], analyzed the dust distribution over Syria, Lebanon, Jordan, Saudi Arabia, Yemen, Iraq and Iran and his analyses were based on short periods of data recording and on other data collected over varying lengths of time from the 1950s and 1960s.
In this research, we identify the main sources of dust, firstly in the SW of Asia and then with more details over the study area where includes the east of Syria, Iraq and the west of Iran. Spatial distributions of the dust events over Iran in a yearly scale during 30 years (1980-2009) have been monitored, at the same time, in the main dust source areas over Iraq and Syria, the vegetation health index (VHI) as a remotely sensed drought index, precipitation and temperature oscillations that are recounted the prime variables of drought and dryness, have been considered and then compared to the dust events in the west and southwest of Iran where extremely suffered from dust storms in the recent years.
2. Materials and Methods
2.1. Datasets
Dust data: For considering the frequency of dust storm events in Iran the dataset has been provided through the reports of the synoptic stations throughout the country. These reports are available in Islamic Republic of Iran Meteorological Organization (IRIMO). Dust datasets are developed based on the visibility less than 5 km. for each 3-hour spell (every 24 hours, 8 times measurement of the horizontal visibility) through 30 years (1980-2009). We used the yearly and monthly frequencies of dust storm events in this work.
Vegetation Health Index (VHI): Vegetation health method is a new tool designed to estimate the entire spectrum of vegetation health (condition) from AVHRRbased Vegetation Health (VH) indices. Remote sensing of VH is based on the properties of green vegetation to reflect and emit solar radiation. In drought-free years, green and vigorous vegetation reflects little radiation in the visible (VIS) part of solar spectrum (due to high solar light absorption by chlorophyll) and much in the near infrared (NIR) part (due to specificity of scattering the light by leaf internal tissues and water content impact). Following these properties, the difference between NIR and VIS becomes large, indicating that vegetation is very green and vigorous. Drought normally depresses vegetation greenness and vigor (due to a reduction in chlorophyll and water content) and canopy area leading to an increase in the VIS, decrease in the NIR and a reduction in NIR-VIS. This principle is used in construction of the Normalized difference vegetation index [NDVI = (NIRVIS)/(NIR + VIS)] which becomes the most widely used for environmental monitoring because it correlates with vegetation biomass, leaf area index and crop yield [19, 20].
However, NDVI alone is not sufficient for monitoring vegetation health and drought. Afternoon temperature of vegetation canopy is an extremely important characteristic for estimation of vegetation condition and health. Therefore, thermal characteristic of land cover was added to the NDVI tool. In addition, both NDVI and thermal indices were related to their climatology calculated from the 32-year AVHRR data. Following these principles, three indices were developed: Vegetation condition (VCI) from NDVI, Temperature condition (TCI) from 10.3 - 11.3 µm infrared channel measurements of brightness temperature (BT) of land surface and vegetation health index (VTI) from the combination of VCI and TCI for estimation of total vegetation health [21]. The NDVI and BT were well calibrated and low/high frequency noise was removed from the data. The VCI, TCI and VHI were validated to be an appropriate indicators of moisture, thermal and total vegetation health conditions, respectively. The indices values change from zero, indicating extreme stress, to 100, indicating very favorable conditions. Close to normal conditions are approximated by the values around 50. VH-designed drought monitoring is based on the numerical analysis of vegetation stress from a lower greenness and above normal temperature. These conditions indicate moisture and/or thermal vegetation stress. In dry years, high temperatures at the background of insufficient water supply trigger an overheating the canopy, which intensifies the impact of moisture shortage on vegetation. Drought warning is issued if VH values decrease below 40. The details of the algorithm are presented in Kogan (1997) [21]. We downloaded the weekly VHI values from 1980 to present for the detected dust source areas in Iraq and Syria.
Temperature: The temperature anomaly dataset is provided from NOAA NCEP CPC CAMS1: Climate Anomaly Monitoring System monthly gridded and station precipitation and temperature data. Spatial resolution of data is 2˚ × 2˚; longitude and latitude are global; Time from Jan 1980 to present in monthly series. We used the dataset of some points over the main sources of dust: AlMuthanna desert (46E-31N), Sala Ad-Din Province (43E- 34N), Neinava Province (43E-36N) and Dayr Az-Zwar Province of Syria (40E-34N). The details of data-production are presented in Appendix.
Precipitation: The “CAMS_OPI” (Climate Anomaly Monitoring System (“CAMS”) and OLR Precipitation Index (“OPI”) is a precipitation estimation technique which produces real-time monthly analyses of global precipitation. To do this, observations from raingauges (“CAMS” data) are merged with precipitation estimates from a satellite algorithm (“OPI”). The analyses are on a 2.5 × 2.5 degree latitude/longitude grid, are updated each month, and extend back to 1979. This data set is intended primarily for real-time monitoring. For research purposes, we refer users to the GPCP and CMAP products which are more quality-controlled and use both IR and microwave-based satellite estimates of precipitation. The CAMS_OPI data files contain, for each month:
• Raingauge/satellite merged analysis;
• Gauge-only precipitation analyses;
• The number of gauge reports in each gridbox;
• OPI-only precipitation estimates;
• Gauge/satellite merged analysis anomalies (1979- 1995 base period);
• Anomalies expressed as a percentage of the Gamma distribution.
The merging technique is very similar to that described in Xie and Arkin (1997) [22], and the CAMS_ OPI technique has also been published recently [23]. Briefly, the merging methodology is a two-step process. First, the random error is reduced by linearly combining the satellite estimates using the maximum likelihood method, in which case the linear combination coefficients are inversely propostional to the square of the local random error of the individual data sources. Over global land areas the random error is defined for each time period and grid location by comparing the data source with the raingauge analysis over the surrounding area. Over oceans, the random error is defined by comparing the data sources with the raingauge observations over the Pacific atolls. Bias is reduced when the data sources are blended in the second step using the blending technique of Reynolds (1988) [24]. Here the data output from step 1 is used to define the “shape” of the precipitation field and the rain gauge data are used to constrain the amplitude.
2.2. Methods
The study area covers Iraq, the northeast of Syria and the western of Iran (Figure 2).
In first, the dust source areas over the southwest of Asia (SWA) have been identified using the information
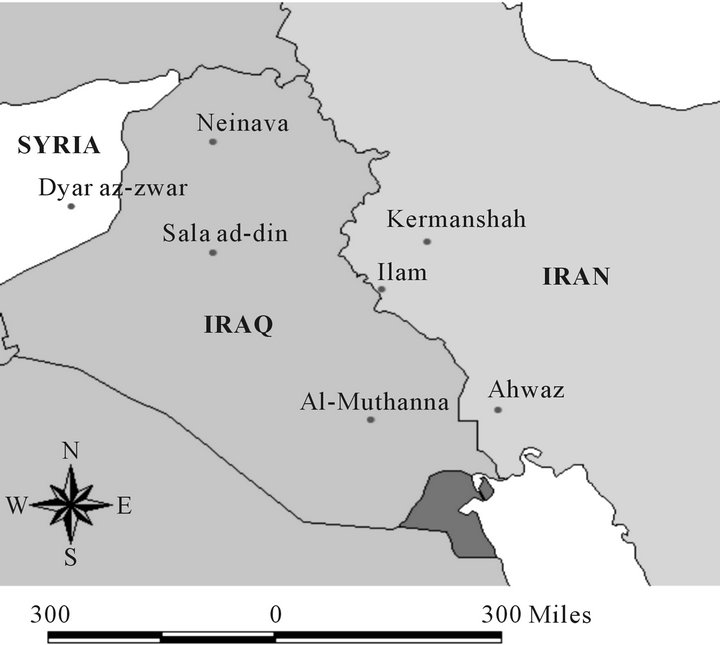
Figure 2. Geographic position of the study area and the chosen stations.
of the department of sand and dust storms modeling and studying in the World Meteorological Organization (WMO). The dust source areas in this model based on the land cover and topography of the regions can be recognized. Then we used the satellite images of the dusty days from 2000 to present for identifying the dust source areas in purposes of the frequency of the occurred dust storms, these images are produced through the Moderate Resolution Imaging Spectroradiometer (MODIS) on NASA’s Terra satellite, at the same time the map of soil grain types in the Middle East has been used, and we coupled them (the derived results from the satellite images and the soil types map). Finally via GIS software we illustrated the highly effective regions on dust production over the study area.
After delimiting the main dust source areas, we used the yearly dust frequency datasets (visibility < 5 km) of all synoptic stations in Iran during a 30-year period (1980-2009), and then via GIS the spatial distribution of dust storm frequencies have been illustrated in the country for whole 30-year period and also for each three decades respectively: 1980-1989, 1990-1999 and 2000-2009.
In order to find the linkage between droughts and dust storm frequency we attempted firstly to monitor the drought events over the main dust source areas in Iraq and Syria, so the datasets of the vegetation health index (VHI)—as an important index that shows moisture and temperature stresses-, precipitation and temperature are provided over the Al-Muthanna Province, Sala Ad-Din Province, Neinava Province in Iraq and Dayr Az-Zwar Province in Syria (Figure 2). The VHI values are in the weekly time scale for each four provinces from 1980 to present, these values have been provided from star.nesdis. noaa.gov. The fluctuations of the VHI based on the weekly values as well as 52-week moving averages for each province monitored via the developed plots.
Precipitation and temperature datasets in the monthly scale over the aforementioned provinces from NOAA NCEP CPC have been provided. Using the Scilab software the datasets have been arranged and the missing values removed. At the same time from the provided station-based dust frequency values in Iran we chose the datasets of three stations of Eilam, Ahwaz and Kermanshah in west and southwest of the country where indicate the highest frequency of wide spread suspended dust (dust covering a vast area carried aloft from a dust storm occurred in a remote position) over the past 30 years. The datasets of these three Iranian stations have been completed up to 2011 by demanding the complementary data of 2010 and 2011 from the IRIMO.
We arranged all datasets (VHI, precipitation, temperature and dust frequency datasets) as the yearly and monthly spatial averages, which include all data points/ stations in Iraq, Syria and Iran for using in the analysis. Then the initial values of all datasets became standardized for comparing them easily. The statistical analysis has been done between the dust frequency values of the three chosen stations in Iran (the averaged values from three aforementioned stations in Iran) and the three drought indicators of the dust source areas (the averaged values of the VHI, precipitation and temperature from four provinces in Iraq and Syria). T-student test is applied for each four variables to consider the long term changes in the mean values through the two sub-periods of 1980-1995 and 1996-2011. We developed also the correlation analysis as following: 1) yearly correlation during 1980-2011 for having a long term approach; and 2) monthly correlation for considering the monthly/seasonal variations of the dust storms as well as the drought indicators.
3. Results
3.1. Detection of the Dust-Source Areas
Using the produced map of the dust source areas over the southwest of Asia from WMO, the efficiencies of dustproduction have been determined basically in the different regions of the SWA and the Middle East (Figure 3). This categorizing of the SWA in purposes of the dustproduction capacity of the regions is based on the topography and land cover, which play an important role in the dust production. The dry flat/low lands with poor vegetation cover and the fine soil particles (for example: silt and clay) potentially have a high capacity in the dust production. On the map regarding the efficiency, four categorizations are shown as following: bare and sand deserts with 100% efficiency and semi desert as well as semi desert shrubs respectively with 80% and 70% effi-
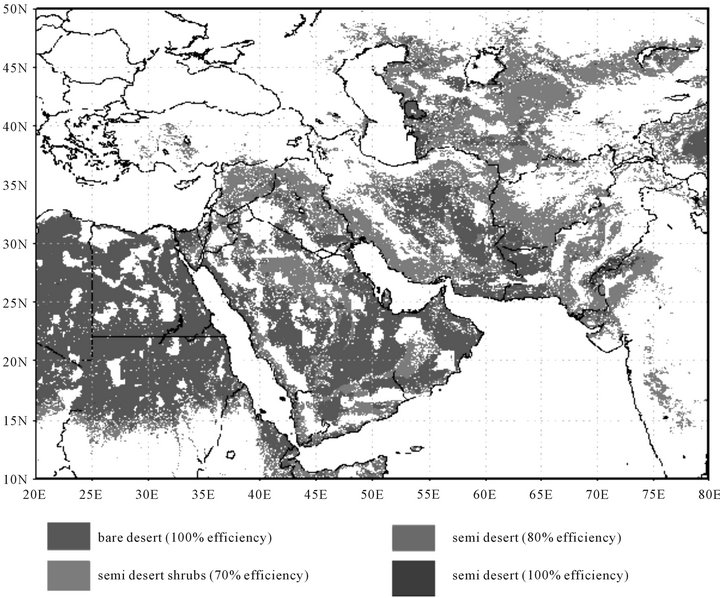
Figure 3. Dust source map of SW Asia region: preferential dust sources based on land cover and topography (Source: WMO).
ciency in dust production. Focusing in our study area the main dust sources (bare desert with 100% efficiency) cover some regions from the northeast of Syria to the southeast of Iraq, of course the dust sources mostly are extended in Iraq by covering the northwest, centre and southeast of the country.
Furthermore, over the study area using the satellite images of the dusty days in a long term scale as well as the soil types map the dust source areas are detected with a high resolution. The satellite images of the dusty days regarding the dust storm frequencies would help to recognize the dust sources more precisely. Figures 3 and 4 illustrate the distribution of the dust sources in the study area.
We found that the high effective dust source-areas over the region are located in: 1) the western parts of the Neinava Province of Iraq and the east of Syria, (around the frontier of Syria-Iraq); 2) the north-west of Tharthar lake (western parts of the Samera and Tikrit cities in Iraq); and 3) Muthanna desert in the south-east of Iraq (about 200 km far from Khozestan Province of Iran).
We will consider the changes of vegetation cover, temperature conditions and precipitation over these areas in order to find the linkage between the expansion of droughts over the region and rising of the dust-storms, which influence mostly western and southwestern provinces of Iran through south westerly or westerly winds (Figure 5).
Recently by spreading and creating the dust-sources in the north of Iraq and eastern north of Syria, the west of Iran is impacted with more intensity, frequency and permanency by this event. The two following reasons are of most importance in this regard:
1) There are soft soil and clay in the mentioned regions;
2) The meteorological conditions are suitable for dust formation.
Since in summer, when the most extensive and severe dust events occur and usually maximum number of dusty days are reported in summer; by strengthening the subtropical upper high anticyclone, the waves of Mediterranean trough that in addition to be weak have been delivered to northern latitudes, mostly passed from the north parts of Mediterranean and there will be no possibility of
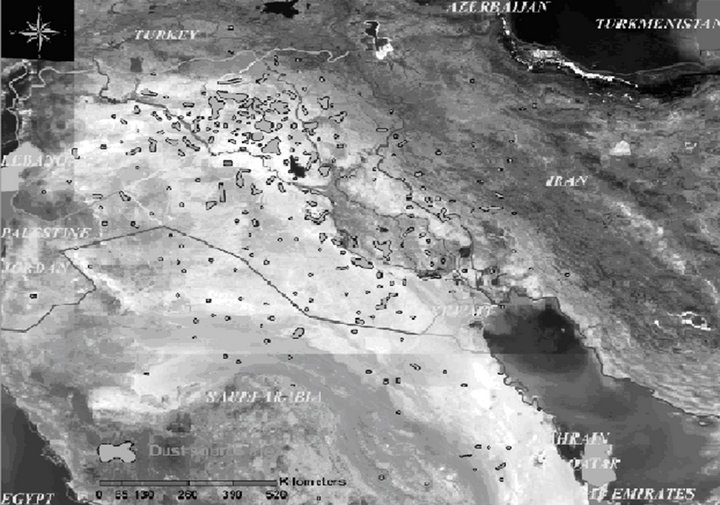
Figure 4. Detected dust-source areas via satellite images in the study area.
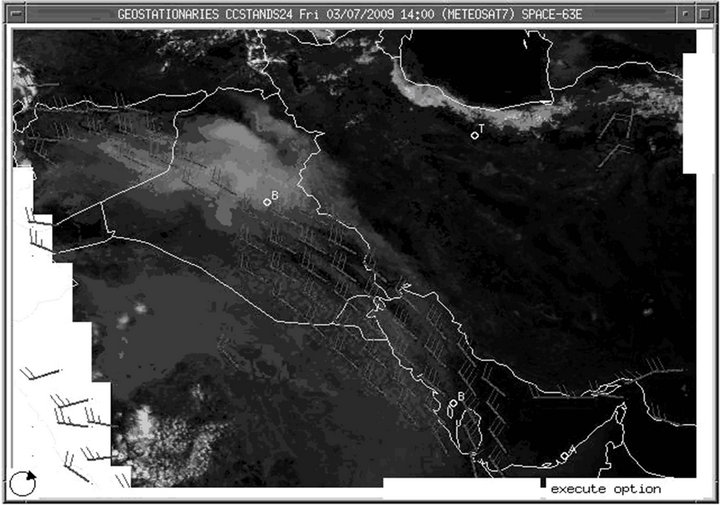
Figure 5. The wind directions in a dusty day over the region note the main wind directions in the dusty days are mostly western and southwestern.
moisture feeding and no precipitation. Thus, its deployment on dry areas provides suitable conditions for ascending of air and dust particles.
3.2. The Relationships between Droughts and Dust Storms
The spatial-temporal variations of the dust storm frequencies in Iran for 30 years and also for each three decades give us some interesting information. In a long-term monitoring of 1980-2009, the southwestern of the country illustrates more vulnerable situation respect to the dust storm events than the other parts of the country. In the yearly average the southwest of Iran shows about 60 - 130 dust events, north, east and northwest mostly 0 - 10 events, center, southeast, south and west had 10 - 60 events (Figure 6).
Through a decadal monitoring, we compared each decade to the long term condition. Both two decades of 1980-1989 and 1990-1999 show decreasing condition of the dust frequency in most areas of the country especially over the western parts (Figures 7 and 8). While in the decade of 2000-2009 throughout the country (except for some areas in the northeast and north), an increasing dust frequency is evident, meantime the western parts of the country faced to an extreme situation, as the increase of dust frequency ranges from 70 - 175 percent in some western parts. In this study we focused on western Iran, so the effects of the dust sources outside of Iran (in Iraq and Syria) are of more importance there (Figures 9).
As we explained above the unusually increasing in the dust events over Iran particularly in western Iran (west and southwest) from 2000 to present seems to be parallel to the precipitation decrease and the warming process in the Middle East. Regarding the monthly mean precipitation ranks in Iraq (as a country that includes the main dust sources, which influence Iran) for a 60-year period as well as for the periods of 1970-2008, 2003-2008 and 2008, and comparing them to the long term means, it indicates a decreasing behavior in the precipitation amount especially in the winter and spring months, so the maximum decrease is remarkable in the 5-year period of 2003-2008 and the intensive drought year of 2008 (Figure 10).
3.3. Drought Monitoring via Remotely Sensed Data in the Main Dust-Source Areas
Changes in the vegetation cover of the different regions in purposes of density and greenness may be one of the important indicators of the drought or wet period. Particularly in the semi-arid areas the negative changes of the vegetation cover would increase potentially the dustproduction capability. The long term variations of the VHI based on the weekly series in the four main detected dust-sources of Iraq and Syria indicate the fact that in the
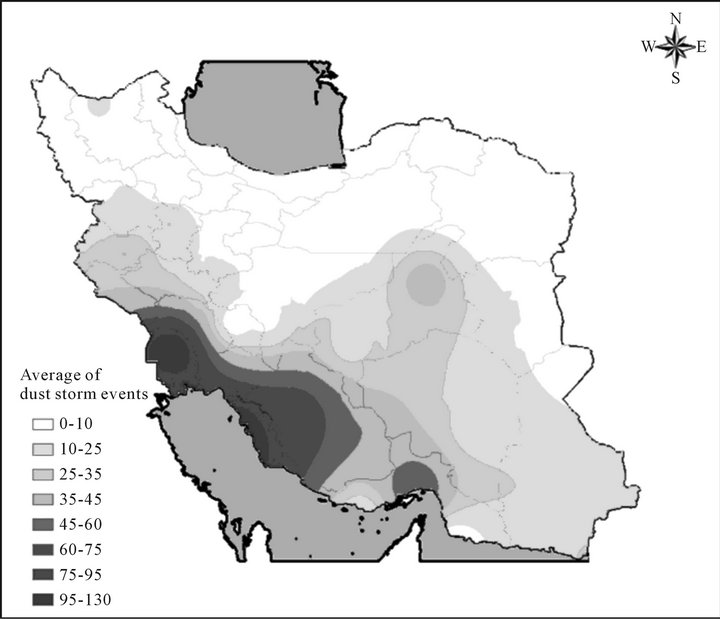
Figure 6. Yearly average of the dust storm events (3-hour observations of visibility less than 5 km) during 1980-2009 in Iran.
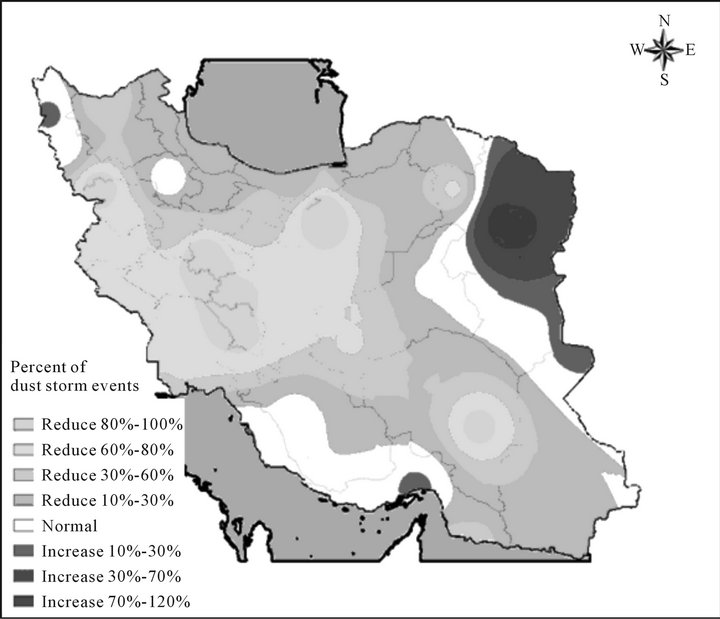
Figure 7. Percent of dust storm events (3-hour observations of visibility less than 5 km) a comparison of the period 1980-1989 to the long term average of 1980-2009 in Iran.
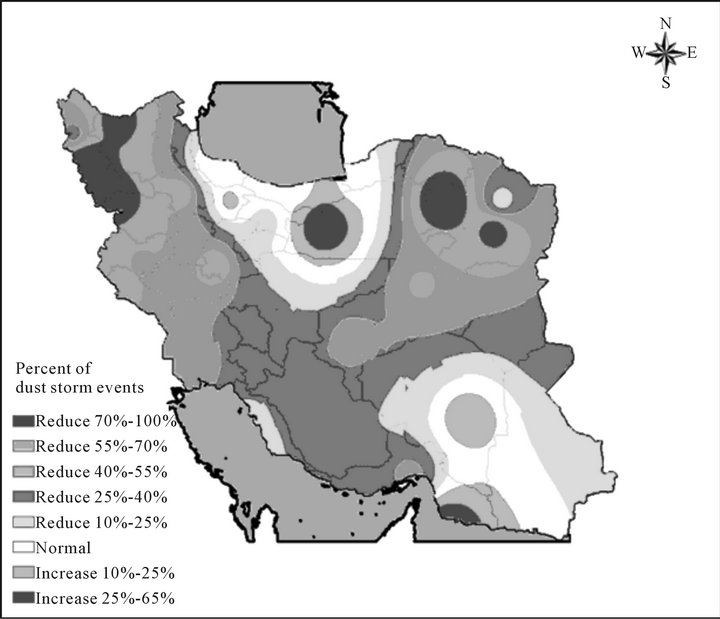
Figure 8. Percent of dust storm events (3-hour observations and visibility less than 5 km) a comparison of the period 1990- 1999 to the long term average of 1980-2009 in Iran.
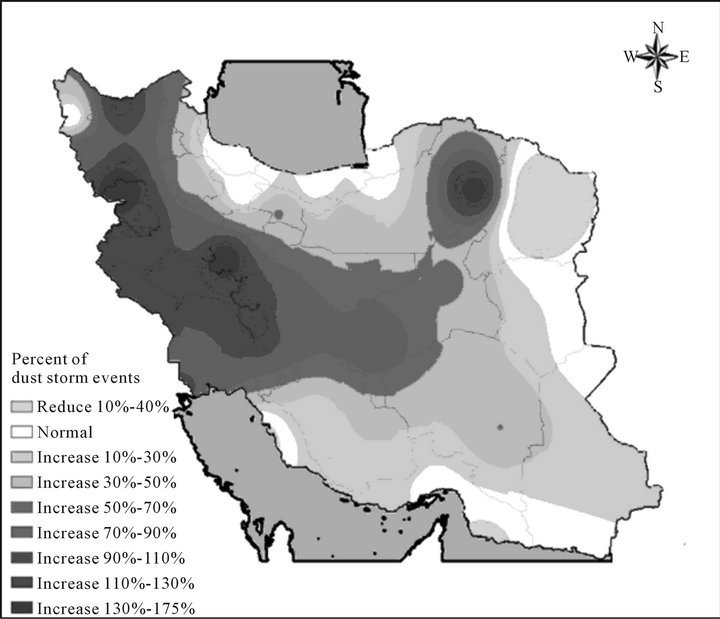
Figure 9. Percent of dust storm events (3-hour observations of visibility less than 5 km) a comparison of the period 2000-2009 to the long term average of 1980-2009 in Iran.
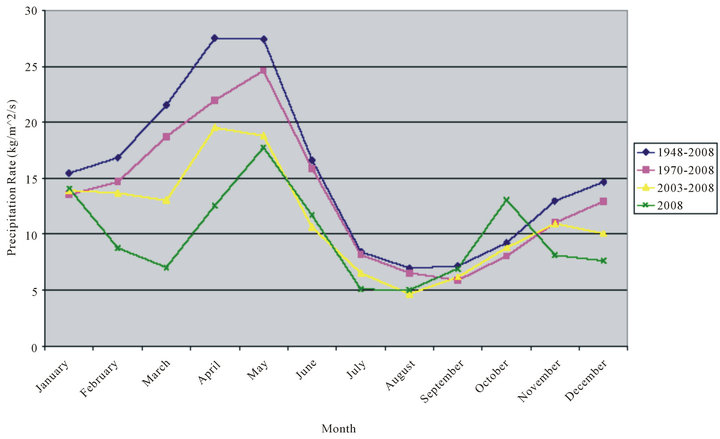
Figure 10. The monthly mean precipitation rate (PR) time series for Iraq for: 1948-2008 (blue); 1970-2008 (red); 2003-2008 (yellow); and 2008 (green).
 (a)
(a)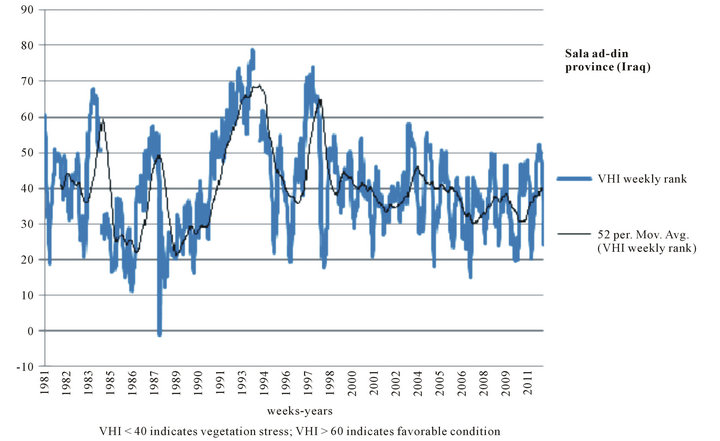 (b)
(b)
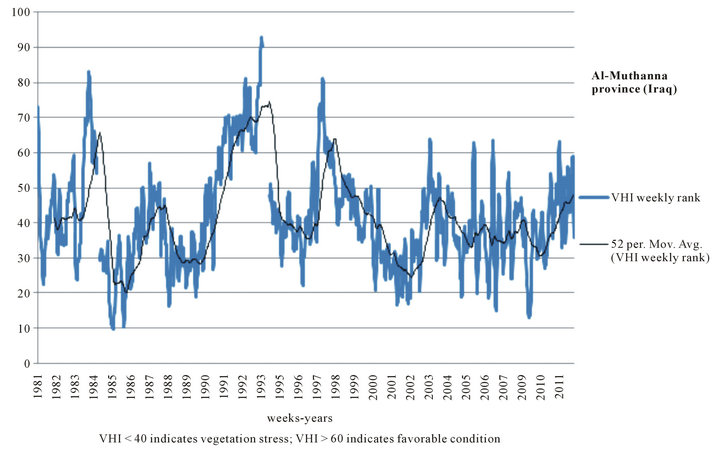
Figure 11. VHI (vegetation health index) weekly values over main dust source areas: (a) Al-Muthanna Province (Iraq); (b) Sala Ad-Din Province (Iraq), during 1981-2011.
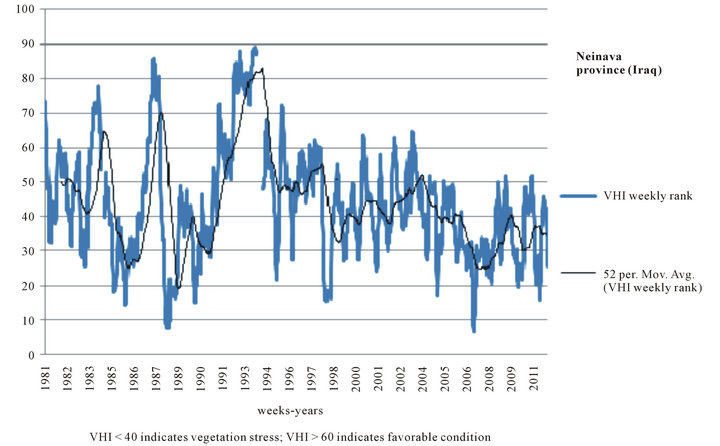 (a)
(a)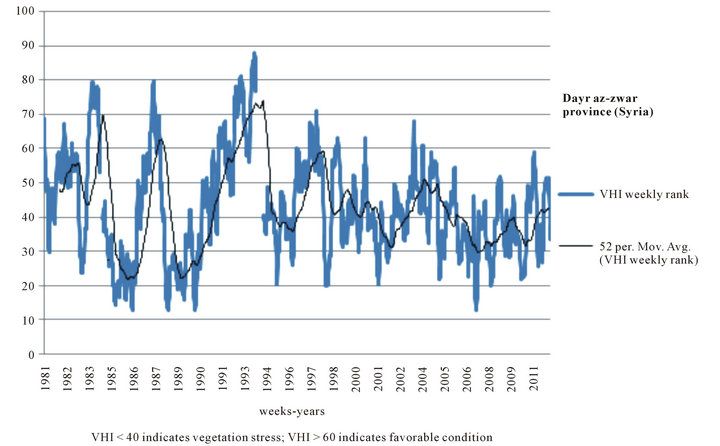 (b)
(b)
Figure 12. VHI (vegetation health index) weekly values over main dust source areas: (a) Neinava Province (Iraq); (b) Dayr Az-Zwar Province (Syria), during 1981-2011.
recent decade the VHI values in average fell down and persistently varied below 50%, as these conditions would be in result of the frequentative droughts and dryness expansion (Figures 11 and 12). While, as the below plots show over the period before 2000 the VHI values varied above 50%, beside we can see evidently the periods with favorable conditions (VHI > 60), which can recover the damaged vegetation covers. Thus the negative vegetation changes of the recent decade in all four pilot areas without the recovery-years (the years with favorable condition of the VHI) may have increased the dust rising potential.
3.4. Comparing the Dust Events to the Main Variables of Drought
Respect to the changes of the VHI in the dust source areas and precipitation decreasing in Iraq parallel to dust increasing over west and southwest of Iran, we intended to compare statistically the temporal variations of the VHI, precipitation and temperature (as the main variables of drought in this study) in Iraq and Syria to the dust frequency variations in the west of Iran during 1980-2011. For developing this comparison firstly spatial averages have been calculated from the pilot places/stations in Iraq, Syria and Iran for all data series in the yearly/monthly scales. Then the average values became standardized based on the standard deviation and mean values. The correlation analysis has been developed in two modes of long-term and monthly analyzes between the dust frequency and the aforementioned variables of drought in order to have the periodic and inter-annual approaches.
3.4.1. Long-Term Analysis
Through this analysis firstly the long-term variations of all data series in the yearly scale based on their standard values have been monitored, so it is found that from 2000 to present the remarkable changes in the behavior of the data series is evident. Through the recent decade obviously the dust frequency and temperature values are above the normal, on the other hand precipitation and VHI values stay below normal (Figure 13). We applied the T-student test on the data series during the two 16- year sub-periods of 1980-1995 and 1996-2011, to determine whether two samples are likely to have come from the same two underlying sub-periods that have the same mean. Through this test it is found that the mean values of the mentioned sub-periods are seriously different regarding the estimated weak probability ranks (Table 1). In fact the derived results from the T-student test confirm the observed changes of the data series in the recent decade comparing to the period of 1980-1995.
Respect to the aforementioned results it seems the drought expansion and warming process especially in the recent decade over some regions in Iraq and Syria likely
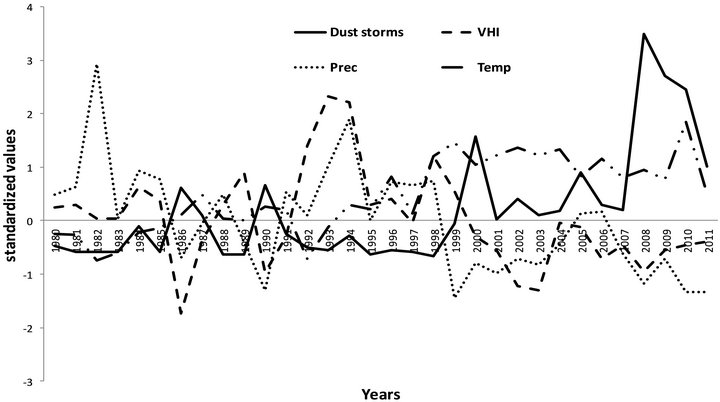
Figure 13. Yearly standardized values of the VHI (dash), precipitation (round dot), temperature (dash dot) and dust frequency (solid) during 1980-2011 (VHI, precipitation and temperature values in the dust-source areas of Iraq and Syria. The values of dust frequency from the 3 chosen synoptic stations of Iran).
have increased the dust events over Iran. The long term correlation analysis between the dust frequency and the main drought variables may explain their relationships. The results show the highest proximity between dust and precipitation with a correlation rank about −0.58, and then both temperature and the VHI got the same rank of ±0.50 (Table 2). As expected the VHI and precipitation show the negative ranks of R and R2 because of the fact that by decreasing precipitation amount and VHI values usually the dust storms should be raised, but the temperature increasing as a drought and dryness factor have positive relationship with the dust storms (Figure 14). The derived correlation ranks that range around 0.50 to 0.58, evidently confirm that the drought expansion would cause the dust storms, and provide an effective background for this phenomenon. However association of the topographic and other meteorological factors with drought, such as the anthropogenic changes on the earth surface, wind velocity and directions, changes in the positions of the low and high pressures, etc may have the complementary effects in the dust rising.
The coefficients of determinations (R2 s) that explain the linear correlations between the variables, indicate almost weak ranks (Table 2). Indeed because of the interventions of aforementioned factors in dust rising, we found the indirect relationships between them, as the intensity of changes in the dust events and the main drought variables are mostly different, and then we can not imagine a high linear correlation for them.
3.4.2. Monthly Analysis
Through the monthly correlations, it is aiming to find the
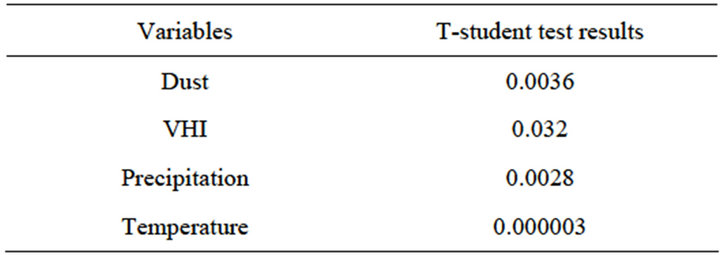
Table 1. T-student test on all variables by dividing the entire period (1980-2011) in 2 sub-periods: 1980-1995 and 1996-2011.
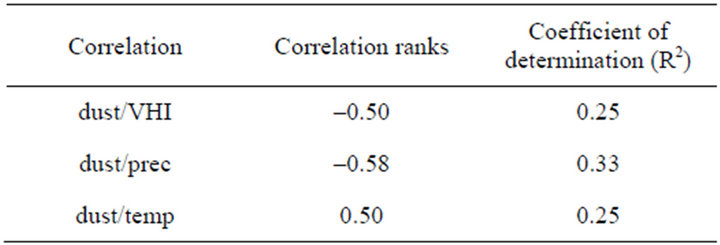
Table 2. Correlation analysis between dust storm eventsover west and southwest of Iran-with the VHI, precipitation, temperature-in the main dust source areas-during 31 years (1980-2011).
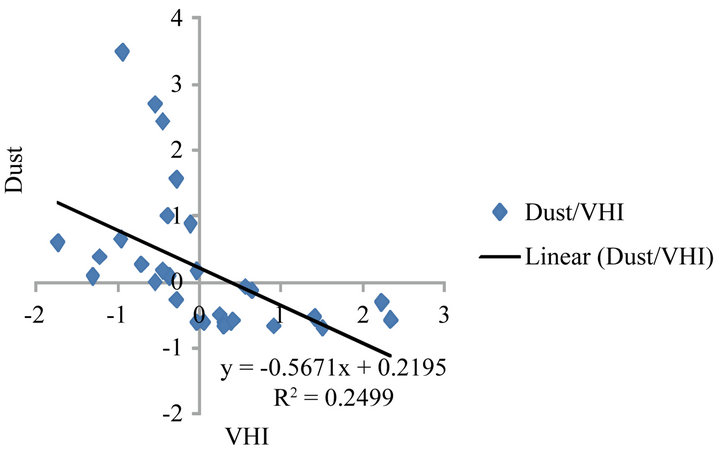 (a)
(a)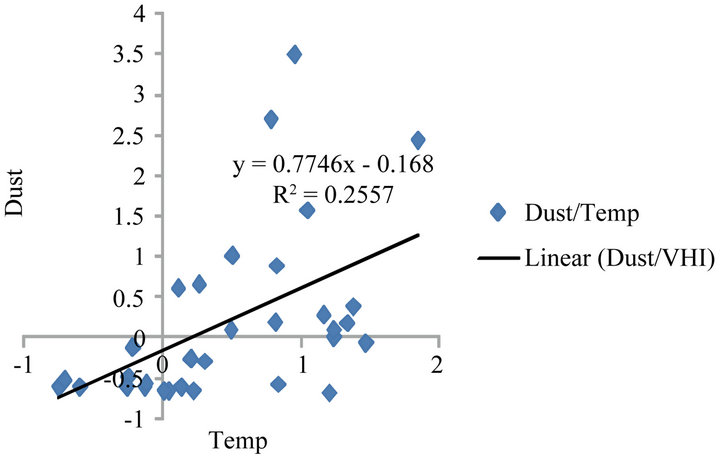 (b)
(b)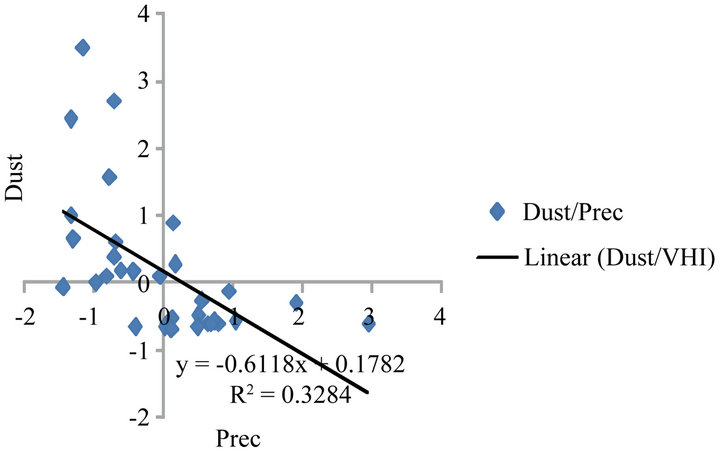 (c)
(c)
Figure 14. Linear correlation between dust storm eventsover west and southwest of Iran-with the VHI, precipitation, temperature-in the main dust source areas-during 31 years (1980-2011).
seasonal changes of the relationships between the drought variables and the dust storms. This analysis indicates that the dust storms significantly correlate to precipitation, the VHI and temperature during spring and summer months (Figure 15). As from May to August because of decreasing in precipitation and increasing in temperature that result in losing the soil moisture and increasing the vegetation stress over Iraq and Syria, the dust events grow in the west and southwest of Iran. As it
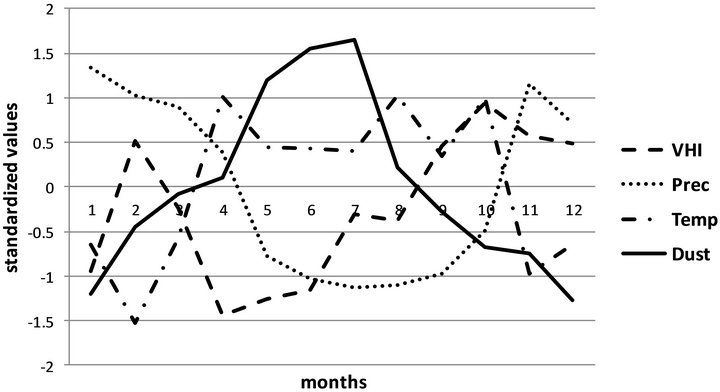
Figure 15. Monthly standardized values of the VHI (dash), precipitation (round dot), temperature (dash dot) and dust frequency (solid) during 1980-2011 (VHI, precipitation and temperature values in the dust-source areas of Iraq and Syria. The values of dust frequency from the 3 chosen synoptic stations of Iran).
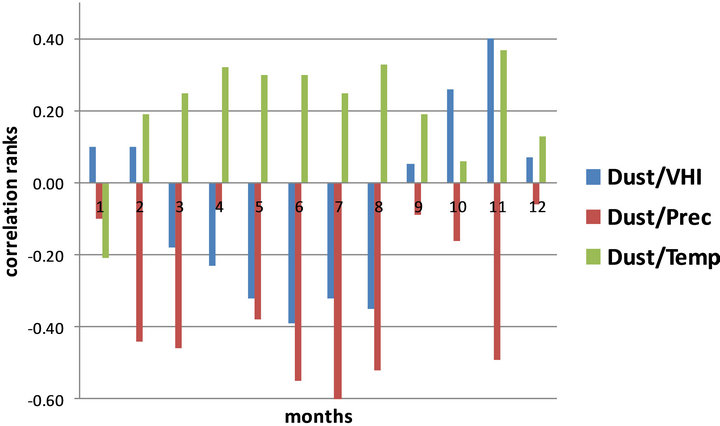
Figure 16. Monthly correlation ranks between the dust storms events with the VHI, precipitation and temperature during 1980-2011 (VHI, precipitation and temperature values in the dust-source areas of Iraq and Syria. The values of dust frequency from the 3 chosen synoptic stations of Iran).
is shown by Figure 16, the warm and dry months of year averagely indicate the high and significant correlations (Figure 16). In these months the mean ranks have been estimated for: dust and VHI −0.35, dust and precipitation −0.52, dust and temperature about +0.30. While, through cold and rainy months dust storms decrease gradually, as the soil feeds sufficiently the moisture and the soil particles become more heavy and viscid than to be lifted into the atmosphere.
4. Conclusions
Respect to the topography (that includes soil types, land cover, …) and climate of some certain areas in Iraq and Syria we recognized a high potential of dust production over them, as by association of the wind direction and velocity in the warm/dry months could transport the dust over west of Iran (as the area of downwind of the sources) and caused a lot of problems related to health, environment, economy, etc. In the recent decade because of the persistent and widespread droughts, surface warming and the dryness expansion especially over southwest of Asia the dust production areas have been extended and their potential to raise dust storms has been increased. With taking into consideration the long-term variations of precipitation, temperature and the VHI, and comparing them to the dust events we found 50% - 58% correlation ranks. At the same time monthly analysis shows significant correspondences in the warm months of year. Also the significant changes have been more evident between the drought variables and the dust events from 1996 to 2011 comparing to 1980-1995.
These output results evidently indicate the role of droughts and dryness over the dust source areas to increase the dust events over western parts of Iran, however the anthropogenic effects seem to be crucial important in the desertification progress and consequently in the dust rising over the Middle East especially through the water reservation and dam construction in the upstream extremely in the recent decade.
Thus, the merged conditions from the natural and anthropogenic causes that increased intensively the dust and air pollutant in the western provinces of Iran warn a serious multilateral problems in the coming years.
REFERENCES
- C. Morales, “Saharan Dust,” Scope 14, John Wiley & Sons, New York, 1979, 297 p.
- N. J. Middleton and Q. Z. Chaudhary, “Severe Dust Storm at Karachi,” Weather, Vol. 43, No. 8, 1988, pp. 298-301. doi:10.1002/j.1477-8696.1988.tb03943.x
- U. Dayan, J. Heffter, J. Miller and G. Gutman, “Dust Intrusion Events into the Mediterranean Basin,” Journal of Applied Meteorology, Vol. 30, No. 8, 1991, pp. 1185- 1199. doi:10.1175/1520-0450(1991)030<1185:DIEITM>2.0.CO;2
- C. M. Liu and S. S. Ou, “Effects of Tropospheric Aerosols on the Solar Radiative Heating in a Clear Atmosphere,” Theoretical and Applied Climatology, Vol. 41, No. 3, 1990, pp. 97-106. doi:10.1007/BF00866432
- E. E. Wheaton and A. K. Chakravarti, “Dust Storms in the Canadian Prairies,” International Journal of Climatology, Vol. 10, No. 8, 1990, pp. 829-837. doi:10.1002/joc.3370100805
- T. Nihlen and S. O. Lund, “Influence of Aeolian Dust on Soil Formation in the Aegean Area,” Zeitschrift fur Geomorphologie, Vol. 393, 1995, pp. 341-361.
- H. Kutiel and H. Furman, “Dust Storms in the Middle East: Sources of Origin and Their Temporal Characteristics,” Indoor and Built Environment, Vol. 12, No. 6, 2003, pp. 419-426. doi:10.1177/1420326X03037110
- R. A. Bagnold, “The Physics of Blown Sand and Desert Dunes,” Methuen & Co., London, 1941, 265 p.
- D. A. Gillette, “Environmental Factors Affecting Dust Emission by Wind Erosion,” In: C. Morales, Ed., Saharan Dust, Scope 14, John Wiley & Sons, New York, 1979, pp. 71-91.
- R. Greeley and J. D. Iversen, “Wind as a Geological Process on Earth, Mars, Venus and Titan,” Cambridge University Press, Cambridge, 1985, 333 p. doi:10.1017/CBO9780511573071
- S. Solomon, D. Qin, M. Manning, Z. Chen, M. Marquis, K. B. Averyt, M. Tignor and H. L. Miller, “Contribution of Working Group I to the Fourth Assessment Report of the Intergovernmental Panel on Climate Change,” Cambridge University Press, New York, 2007.
- J. M. Sun, M. Y. Zhang, T. S. Liu, “Spatial and Temporal Characteristics of Dust Storms in China and Its Surrounding Regions, 1960-1999: Relations to Source Area and Climate,” Journal of Geophysical Research, Vol. 106, No. 10, 2001, pp. 10325-10333. doi:10.1029/2000JD900665
- Z. Zhou, “Blowing-Sand and Sandstorm in China in Recent 45 Years,” Quaternary Sciences, Vol. 21, No. 1, 2001, pp. 9-17.
- W. H. Qian, L. S. Quan and S. Y. Shi, “Variations of Dust Storm in China and Its Climatic Control,” Journal of Climate, Vol. 15, No. 10, 2002, pp. 1216-1229. doi:10.1175/1520-0442(2002)015<1216:VOTDSI>2.0.CO;2
- L. Natsagdorj, D. Jugder and Y. S. Chung, “Analysis of Dust Storms Observed in Mongolia during 1937-1999,” Atmospheric Environment, Vol. 37, No. 9-10, 2003, pp. 1401-1411. doi:10.1016/S1352-2310(02)01023-3
- Y. Kurosaki and M. Mikami, “Recent Frequent Dust Events and Their Relation to Surface Wind in East Asia,” Geophysical Research Letters, Vol. 30, No. 14, 2003, pp. 1726-1736. doi:10.1029/2003GL017261
- Y. Shao and J. J. Wang, “A Climatology of Northeast Asian Dust Events,” Meteorologische Zeitschrift, Vol. 12, No. 4, 2003, pp. 175-183. doi:10.1127/0941-2948/2003/0012-0187
- N. J. Middleton, “Dust Storms in the Middle East,” Journal of Arid Environments, Vol. 10, 1986, pp. 83-96.
- A. P. Cracknell, “The Advanced Very High Resolution Radiometer (AVHRR),” Geological Magazine, Vol. 134, No. 6, 1997, pp. 877-883.
- F. Kogan, L. Salazar and L. Roytman, “Forecasting Crop Production Using Satellite Based Vegetation Health Indices in Kansas, United States,” 2012, in Press.
- F. Kogan, “Global Drought Watch from Space,” Bulletin American Meteorological Society, Vol. 78, No. 4, 1997, pp. 621-636. doi:10.1175/1520-0477(1997)078<0621:GDWFS>2.0.CO;2
- P., Xie and P. A. Arkin, “Global Precipitation: A 17-Year Monthly Analysis Based on Gauge Observations, Satellite Estimates, and Numerical Model Outputs,” Bulletin of the American Meteorological Society, Vol. 78, No. 11, 1996, pp. 2539-2558. doi:10.1175/1520-0477(1997)078<2539:GPAYMA>2.0.CO;2
- J. E. Janowiak and P. Xie, “CAMS_OPI: A Global Satellite-Raingauge Merged Product for Real-Time Precipitation Monitoring Applications,” Journal of Climate, Vol. 12, No. 11, 1999, pp. 3335-3342. doi:10.1175/1520-0442(1999)012<3335:COAGSR>2.0.CO;2
- R. W. Reynolds, “A Real-Time Global Sea Surface Temperature Analysis,” Journal of Climate, Vol. 1, No. 1, 1988, pp. 75-86. doi:10.1175/1520-0442(1988)001<0075:ARTGSS>2.0.CO;2
Appendix
A station observation based global land monthly mean surface air temperature dataset at 0.5 × 0.5 latitude-longitude resolution for the period from 1948 to the present was developed recently at the Climate Prediction Center, National Centers for Environmental Prediction. This data set isdifferent from some existing surface air temperature data sets in: 1) using a combination of two large individual data sets of station observations collected from the Global Historical Climatology Network version 2 and the Climate Anomaly Monitoring System, so it can be regularly updated in near real time with plenty of stations and 2) some unique interpolation methods, such as the anomaly interpolation approach with spatially-temporally varying temperature lapse-rates derived from the observation based Reanalysis for topographic adjustment. You can find the complete manuscript through: ftp://ftp.cpc. ncep.noaa.gov/wd51yf/GHCN_CAMS/Resource/cpc_globalT.pdf
NOTES
*Mojtaba Zoljoodi (first author): Chairman and associate professor of ASMERC; Ali Didevarasl (second author): Senior expert of ASMERC; Abbas ranjbar saadatabadi (third author): assistant professor of ASMERC.
#Corresponding author.
1National Oceanography and Atmospheric Administration (NOAA), National Center for Environmental Prediction (NCEP), Climate Prediction Center (CPC), Climate Anomaly Monitoring System (CAMS).