Atmospheric and Climate Sciences
Vol.3 No.1(2013), Article ID:27563,8 pages DOI:10.4236/acs.2013.31007
Influence of Solar Cycle Variations on Solar Spectral Radiation
National Research Institute of Astronomy and Geophysics, Helwan, Egypt
Email: UsamaAliRahoma@Yahoo.com, Rabab_helal@yahoo.co.uk
Received September 17, 2012; revised October 29, 2012; accepted November 6, 2012
Keywords: Sunspot Number; Solar Radiation Spectrum; Total Solar Irradiance; Global Solar Radiation; Meteorological Parameter; Solar Cycle
ABSTRACT
The climatic changes associated with solar variability are largely caused by variations in total solar irradiance and solar spectral irradiance with solar activity. Thus the spectral composition of solar radiation is crucial in determining atomspheric structure. The variations in solar spectrum depend on the varied solar spots. Recently, evidence for a strong effect of solar activity on terrestrial isolation on ground-based measurements carried out by the National Research Institute of Astronomy and Geophysics (NRIAG), Helwan, Egypt (lat. 29˚52'N and long. 31˚20'E) during (1990-2000) were presented. Specifically, a strong increase of terrestrial isolation with sunspot number as well as a decline of the solar spectrum with solar activity was reported. Daily measurements of the solar radiation between 280 nm and 2800 nm were made by Eppley Pyranometer and Pyrheliometer instruments. The decreasing at the range 280 - 530 nm and 530 - 630 nm are represented less than 50% of direct solar radiation and the stability of at the range 630 - 695 nm and 695 - 2800 nm it mean that; some of difference radiation is appear in diffused radiation which allow to height of the temperature as much as the largest associated with significance as it appears from the curves of relative humidity.
1. Introduction
There have been many arguments as to whether or not the eleven-year sunspot cycle affects our weather and climate. There is also a substantial change in the portion of the solar spectrum, with direct impacts primarily in the stratosphere [1,2]. The effect of solar activity variations on earth’s climate remains an important, yet somewhat a controversial issue. There is now a broad consensus that there is a small, but discernible influence of solar variability on the climate on decadal and longer time scales [3]. The effect of these changes on temperature noted by some researchers [4], comes in coincidence with the change in solar irradiance. Furthermore, there are claims that the sunspot cycle is associated with changes in storm tracks and rainfall [5]. How could this happen with so little change in total energy? The impact of the solar cycle on precipitation in the model experiments arises from different mechanisms, involving solar irradiance changes. Although the individual dark sunspots reduce sun’s total radiative output, the sun tends to be bright when there are many sunspots and other factors such as plages and faculae affect the solar brightness. Reference [6,7] observed that the rise phase of cycle 23 (2000-2010) has fewer sunspots and faculae than that of the rise of cycle 22 (1990-2000), but the total solar irradiance measurement indicates similar radiative output as during the rise of cycle 22. This observation brings up the question of whether the solar radiative variability is affected by factors other than sunspots, faculae and enhance network. There are four common types of models [8] that relate the solar output to the solar cycle: 1) the constant quiet sun model; 2) the activity envelope model; 3) the solar diameter model; and 4) the umbra-penumbra ratio model. These types of model will be discussed in more detail later. Reference [9], support for a link between the solar cycle and climate variability as the inclusion of a solar cycle term improved the fit between the global mean surface temperature and a simulation. Reference [10] argued that changes in total solar irradiance have contributed at minimum ~10% - 30% of the global surface warming from 1980 to 2002 [11], where the total solar irradiance estimates for cycle 22 - 23 are higher than cycles 21 - 22 by 0.45 ± 0.10 W/m2. It seems very unlikely that the variable overall solar output itself is responsible for whole degrees of temperature change on Earth; generally, it’s changing at most by 0.1 percent which should correspond to a tenth of degree only. If the solar activity makes a big difference, then it is through the effects of higher relative variations of the portion of the solar spectrum. Aim of work, discussed the variations of different spectral bands of solar radiation between 280 nm and 2800 nm depending on the varied solar spots.
2. Apparatus and Data Gathering
Measuring apparatus was installed on the terrace of solar laboratory at National Research Institute of Astronomy and Geophysics (NRIAG) (lat. 29˚52'N and long. 31˚20'E), located on plateau about 30 km south of Cairo. All sensors were installed on the roof-top in a position relatively free from any external obstruction, and readily accessible for inspection and general cleaning. In this study, broadband filters were used to measure quantities of normal radiation at different bands. The filters used in this study were Schott filters (2 mm thickness), whose cutoff wavelengths were determined using a spectrophotometer. Their main characteristics (e.g., filter reference, interval bands and reduction factor) are given in Table 1. These filters were arranged on a rotatable disk and mounted on an Eppley normal incidence pyrheliometer that measures the nearly collimated (i.e., parallel rays) radiation from the 0.5˚ diameter solar disk.
The uncertainty in the direct beam component is 0.5%, or about 5 W/m2 at 1000 W/m2 direct irradiance. Measurements of global radiation were carried out using Eppley high precision pyranometer that respond to radiation within a 2p steradian (hemispherical) field of view, which is sensitive in the wavelength range from 280 to 2800 nm, with calibration accuracy of better than ±3.5% for incidence angles between 30˚ and 70˚. This corresponds to −35 W/m2 error at midday with respect to 1000 W/m2 clear day signal and +14 W/m2 error in the morning or afternoon, with respect to a reasonable irradiance of 400 W/m2 at those times. Air temperature was measured using dry bulb, wet bulb and maximumminimum thermometers installed in a Stevenson screen. Relative humidity is derived from the dry and wet bulb temperatures from a hygrometric chart. Wind speed is measured by an automatic anemometers and wind direction using a standard wind vane. Cloud cover (C.C in Okta) is estimated visually, for eight sections of the sky, with 1 Okta representing one eighth of the sky. Ambient air temperature (T in ˚C), relative humidity (R.H in %), wind speed (WS in m·s−1) and wind direction (WD in degree) are listed in Table 2, as these parameters are the most relevant for interpretation of the results.
Sun Spots Number and Solar Irradiance Observations (TSI)
Sunspot data were obtained from the NOAA website [12], EUV data were obtained from the University of Southern California website [13], Lyman alpha data were obtained from the University of Colorado at Boulder ftp site [14]. Observations of TSI use radiometers which are based on the comparison of the absorbed solar radiation with electrical power; hence they are called “Electrically Calibrated Radiometers” or ECR. A detailed description of the radiometers presently used in space and their operation can be found in [15]. Figure 1: Comparison of are daily averaged values of the Sun’s total irradiance from radiometers on different space platforms as published by the instrument teams since November 1978. Note, that the VIRGO TSI is determined from both VIRGO radiometers (PMO6V and DIARAD), whereas the DIARAD TSI is only based on this one alone. Bottom panel: Sunspot number to illustrate the variability of solar activity for cycles 21, 22 and 23. Figure 2: Distribution of the sunspot number along the mentioned Period during which Gandorfer’s atlas sunspots number (source SIDC, Solar Influences Data analysis Center in Brussels) [5]. Figure 3 shows, the annual mean Northern Hemisphere (NH) temperature variations for 1750-1879 [16] and for 1880-2000 from [17]. After being smoothed by an 11- year running mean (lighter line), the model irradiances
Table 1. Filter characteristics.
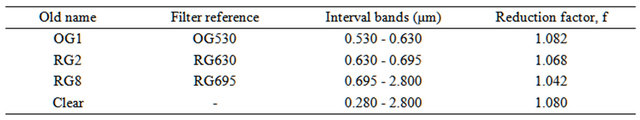
Table 2. Monthly variations of the meteorological data recorded at Helwan monitoring station.
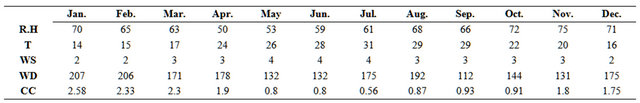
WD is the wind direction (0/360˚: north, 90˚: east, 180˚: south, 270˚: west).
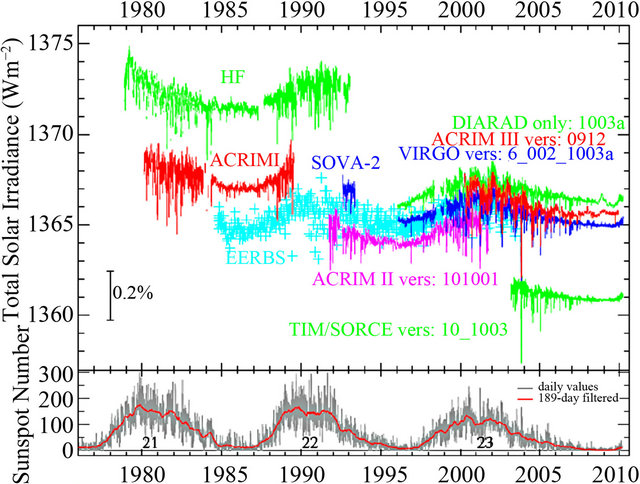
Figure 1. Comparison of are daily averaged values of the Sun’s total irradiance from radiometers on different space platforms as published by the instrument teams since November 1978.
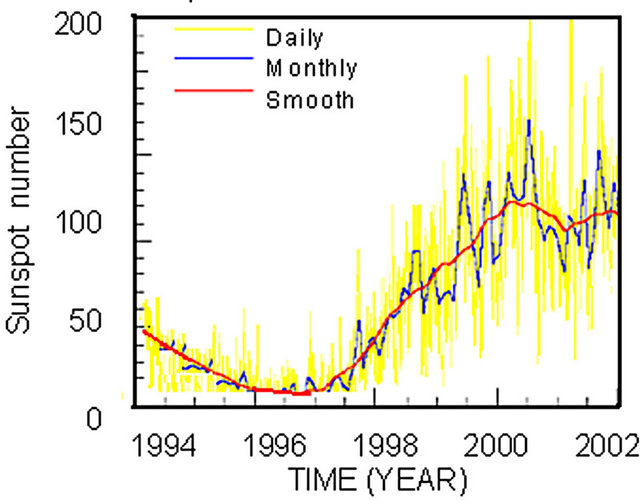
Figure 2. Distribution of the sunspot number along the mentioned Period during which Gandorfer’s atlas sunspots number (source SIDC, Solar Influences Data analysis Center in Brussels) [18].
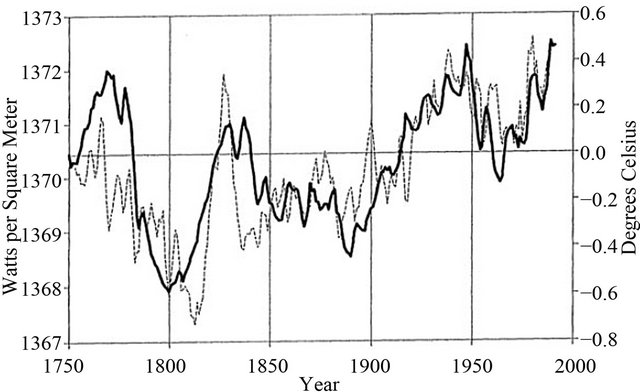
Figure 3. The annual mean Northern hemisphere temperature variations and solar irradiance Hansen and Lebedeff (1988).
are overlaid to show their similarity. Only a slight divergence of the two curves exists for the last few decades. The correlation between the solar indices and modeled solar irradiance with the Earth’s temperature displays a significant confidence level exceeding 99%. Apparently, the sun was dimmest near the Dalton Minimum around 1800, when many regions were very cold. Both 1812 and 1816 were particularly cold, and, in New England, 1816 was called the “year without a summer”. Despite the apparent good agreement between the shapes of the two curves in Figure 3, a serious problem remains for sun/ climate theories. The amplitude of the solar irradiance variations is only about 0.14% from 1880 to 1940. If the Earth’s climate responded with a 0.5˚ K warming, then the climate would be much more sensitive to solar forces than what most models imply. The direct effect of a 0.14% increase in solar irradiance could account for only about a 0.23˚ K increase. If the sensitivity to solar influences is 1.67˚ K then there is 1% increase in solar output (based on satellite observations for the last decade). The amplitude of the solar variations remains highly uncertain, with most estimates for the past century ranging from 0.14% to 0.38% [17].
The postulated solar-irradiance variations may explain a fraction of the Earth’s inter annual temperature variations, but their effects are most evident in long-term temperature trends on hemispheric and global spatial scales.
3. Result
Egypt is one of the Sun Belt countries endowed with high intensity of direct solar radiation ranging between 2000 - 3200 kWh/m2/year. The hourly values of direct solar radiation for Helwan at 30 Km south of Cairo are shown in Table 3. From this table we can see that the highest energy occurs in June, which follows the apparent position of the sun, while the lowest energy occurs during March. We also note that the direct solar radiation values decrease as the hour angle from the solar noon increases. This trend was noted along each month of the year, forming a characteristic feature.
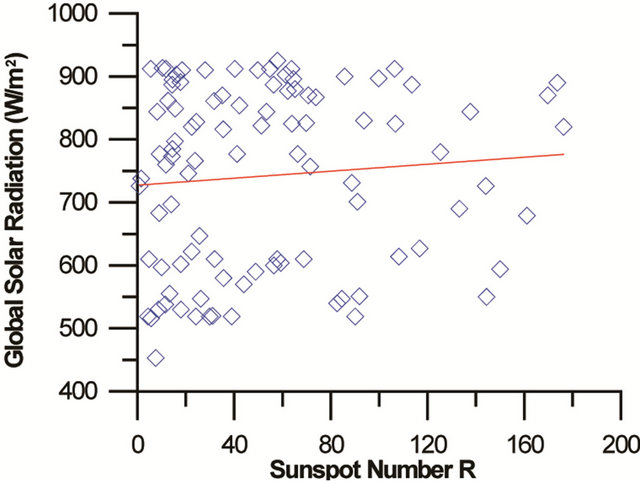
The main climatic features for global solar radiation can be briefly summarized as follows: there is an exceptional decrease in Cairo due to air pollution. In summer, there is no specific gradient. This is because all sites are affected by a high pressure cell which is characterized by stable and clear sky weather. We tested ten models to get the best model. From the results we found that, as shown by Figure 4(e) the global solar radiation, 280 - 530 nm, and (695 - 2800 nm) are heading towards the top. The results of measurements of direct solar radiation and all the bands we have in different ranges are going down. The emergence of low-observable global and direct solar radiation result of the total area affected by air pollutants, which led to the decline, equivalent to 2% - 4% of the actual value in general. Table 4 gives the coefficient of sinusoidal fit for different components of solar radiation global and direct with different bands represented. Figure 5 and Table 5 illustrate a rise in global radiation with the increase of solar activity (sunspot number) Figure
Table 3. Hourly values. Distribution of the direct normal solar radiation (W/m2).
 (a)
(a)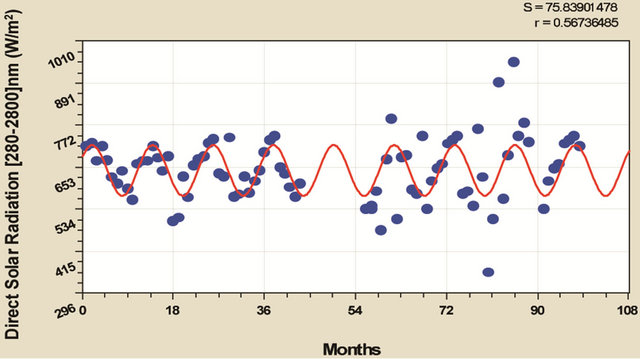 (b)
(b)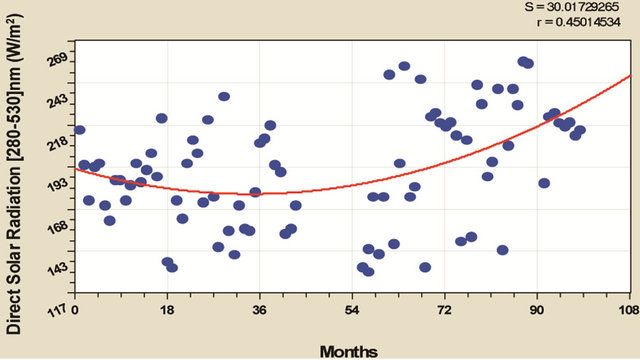 (c)
(c)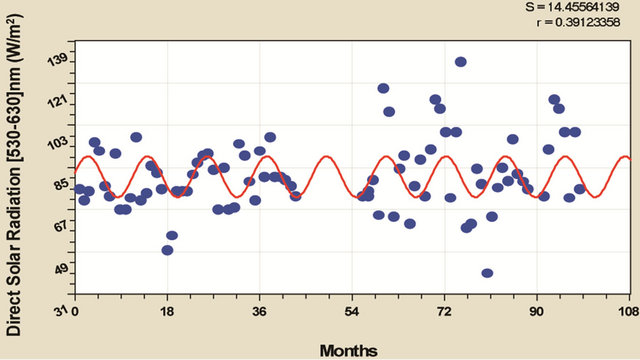 (d)
(d)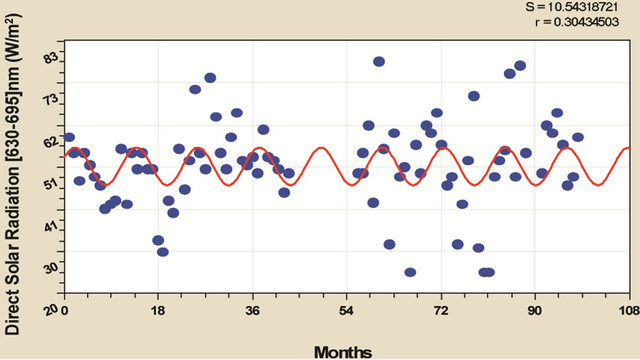 (e)
(e)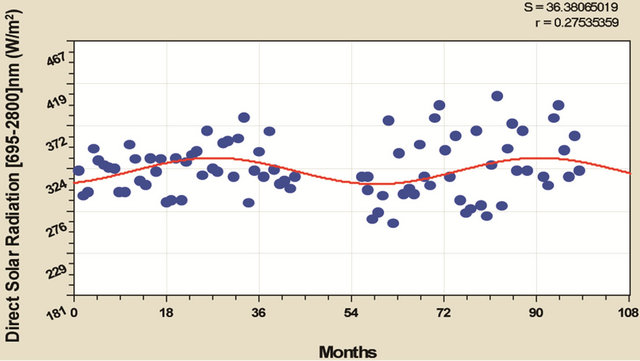 (f)
(f)
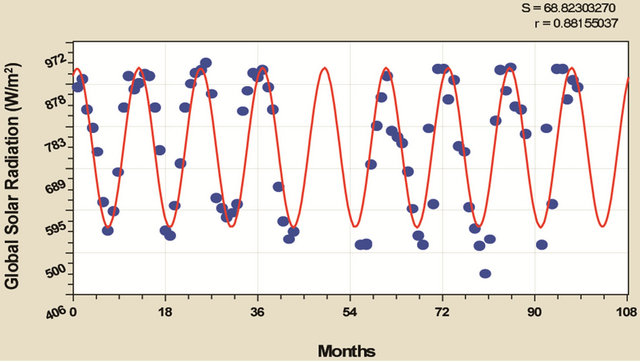
Figure 4. Monthly variation of component of solar radiation global (a), direct 280 - 2800 nm band (b), 280 - 530 nm band (c), 530 - 630 nm band (d), 630 - 695 nm band (e), 695 - 2800 nm band (f) through 1990-2000, Helwan, Egypt.
Table 4. Coefficient data of sinusoidal fit for different components of solar radiation; global and direct with different bands represented by the equation [y = a + b cos(cx + d)].
 (a)
(a)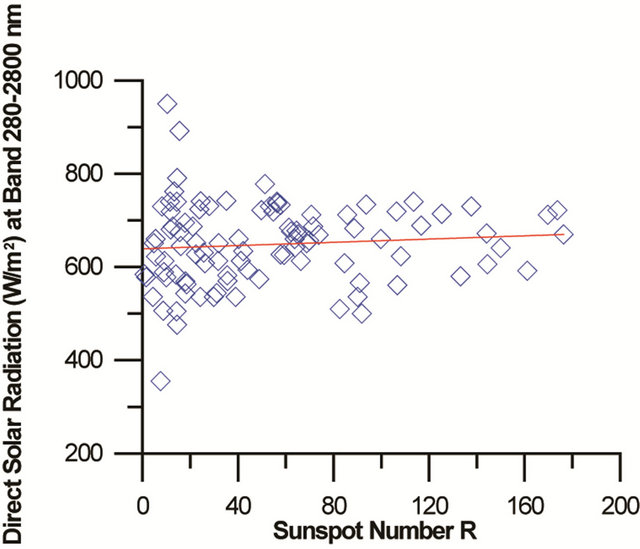 (b)
(b)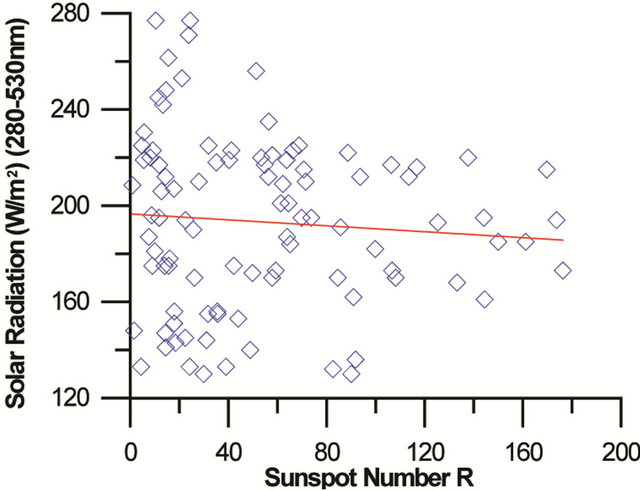 (c)
(c) (d)
(d)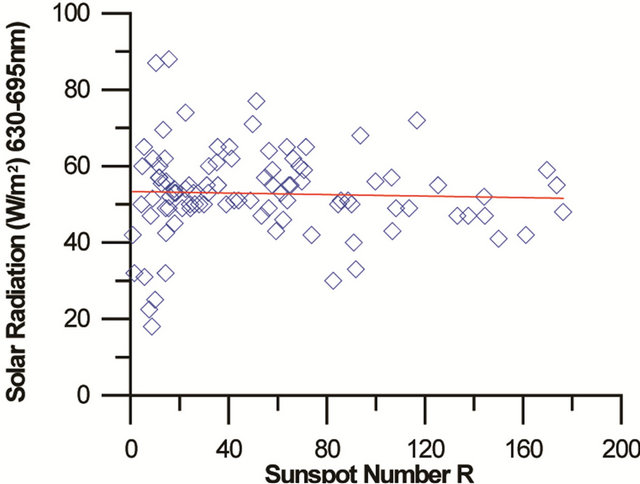 (e)
(e)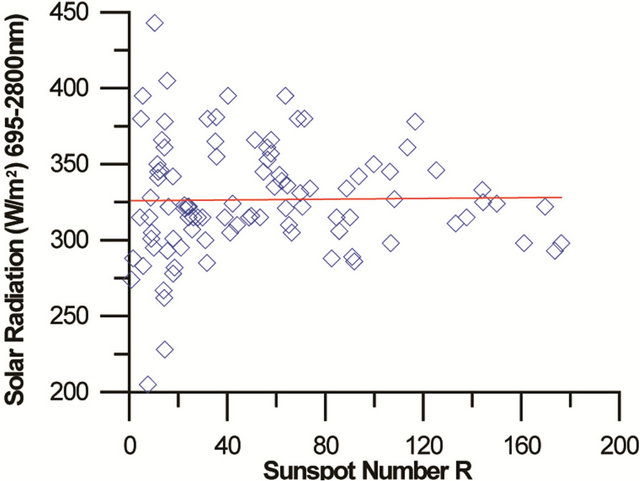 (f)
(f)
Figure 5. Monthly variation of component of solar radiation global (a), direct (b), 280 - 530 nm band (c), 530 - 630 nm band (d), 630 - 695 nm band (e), 695 - 2800 nm band (f) and sunspot number through 1990-2000, Helwan, Egypt.
5(a) in what follows a rise in temperature. In contrary to a conscious declination of incident direct radiation (Figure 5(b)). This behavior reflects the tendency of all spectral bands of direct solar radiation. A reduction in the degree of incident radiation is the largest at the ranges of 280 - 530 nm (Figure 5(c)) and 530 - 630 nm (Figure 5(d)). Table 4 gives us more coefficient data of sinusoiddal fit for different components of solar radiation; global and direct with different bands represented by the equation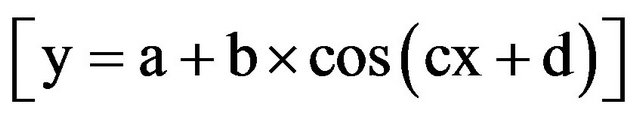 ; because this equation gives less error.
Figure 5 and Table 5, illustrate that the basic uncertainties in the best practical solar radiation data available today are on the order of 3% in direct beam, 5% in total global horizontal, 3% (+/−2) Watt in diffuse horizontal irradiance (measured with a black and white or corrected all-black pyranometer). A rise in sunspots is represented by the increasing curve tendency of global, direct solar radiation (280 - 2800 nm) (Figures 5(a) and (b)). Increase of sunspots are represented by the A reduction in the degree of incident radiation, the largest at the range 280 - 530 nm (Figure 5(c)) and 530 - 630 nm (Figure 5(d)) which are represented less than 50% of direct solar radiation. Stability are followed of the stages at the range 630 - 695 nm (Figure 5(e)) and 695 - 2800 nm (Figure 5(f)) which are represented around 50% from the direct solar radiation.
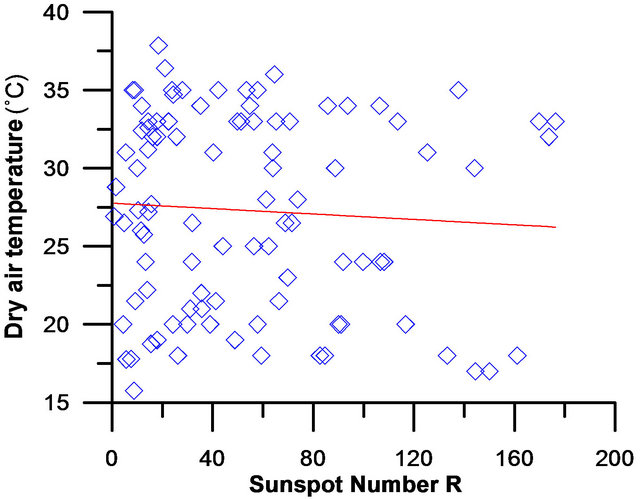
When considering the variables of weather and temperature and humidity (Figure 6), we found that: the level of reduction appears larger in the air temperature (Figure 6(a)), then appears to be more rise and can be clearly seen in the measurement of relative humidity (Figure 6(b)) as the degree of inclination of the curve in the positive direction of 0.45.
Table 5. Coefficient data of linear fit for different components of solar radiation; global and direct with different bands represented by the equation (y = a + bx).
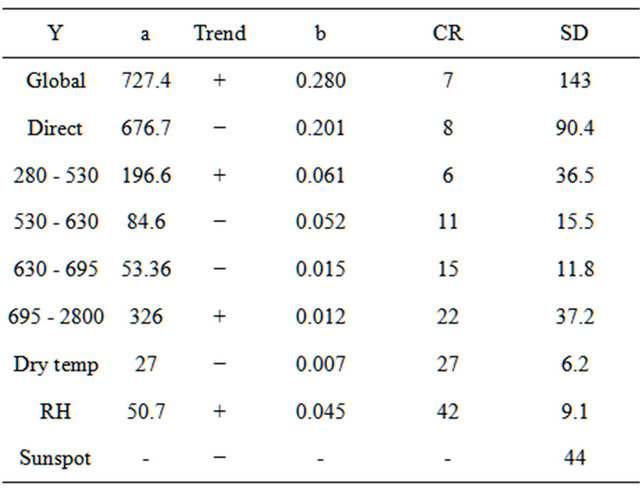
x = sunspot; CR = Correlation coefficient; SD = Standard deviation. (Result from Figures 5 and 6).
 (a)
(a)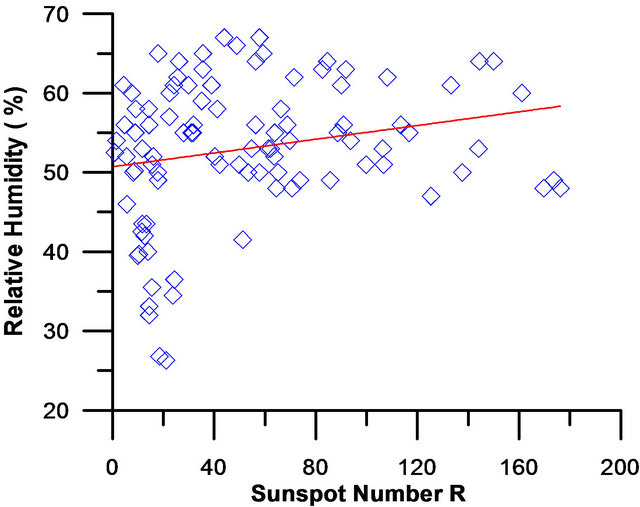 (b)
(b)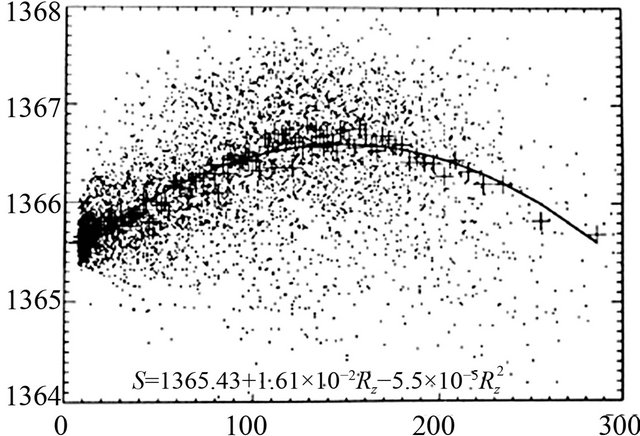 (c)
(c)
Figure 6. Monthly variation of meteorology component of dry temperature ˚C (a), relative humidity % (b), total solar irradiance [18] (c), and sunspot number, through 1990-2000, Helwan, Egypt.
Figure 6(c) shows, the second order fit of sunspot and TSI slow component (running averages) [19]. The total solar irradiance (TSI) varies by 0.1% - 0.2% over a solar cycle. This small fluctuation reflects stability of the solar photosphere as seen in the visible spectrum which extends from the blue at 400 nm to 800 nm [20].
From the Figures 5 and 6 we can see that; the decreasing at the range 280 - 530 nm (Figure 5(c)) and 530 - 630 nm (Figure 5(d)) are represented less than 50% of direct solar radiation and the stability of at the range 630 - 695 nm and 695 - 2800 nm it mean that; some of difference radiation is appear in diffused radiation which to high surface temperature of the Earth.
4. Discussion
Finally the apparent increase of the intensity of the direct solar beam with sunspot number is less. The data collected show a positive trend for global solar radiation, 280 - 530 nm, and infrared bands (695 - 2800 nm) while the data for daily variation and without the times affected by aerosols again exhibit no statistically significant trend with sunspot number. Note that, although statistically, the change of the intensity I of the direct solar beam with sunspot number R of dI/dR = 0.5 W/m2 indicated in Table 5 corresponds to a variation of 0.1% between R = 0 and R = 200, which is the order of magnitude for the variation of the total solar irradiance derived from satellite measurements shown in Figure 6(c) [19].
If the direction of solar radiation gives a negative trend and positive trend for the global radiation, it kills us to the conclusion that diffuse solar radiation gives the positive trend. If the bands 530 - 630 nm and 630 - 695 nm are in the negative trend and bands 280 - 530 nm and 695 - 2800 nm in positive trend, it is logical to reverse the trend because the scope of this direct solar radiation that shows the bands 280 - 530 nm and 695 - 2800 nm affected by the climate impact of a large sunspots. This is reflected on the results of temperature and Relative humidity as shown in Table 5. This indicates the important result we got, the values of sunspots increase with the value of the bands 280 - 530 nm and infrared radiation 695 - 2800 and this in turn allow to increase the height of the temperature as much as the largest associated with significantly as appears from the curves of relative humidity.
5. Conclusion
Sunspots have a deep impact on the Solar radiation where it directly affects solar radiation either in the overall positive direction or in the negative direction. Sunspots have a direct impact and is reflected in the increasing effect of air temperature and negatively affected by relative humidity prophetess in the positive direction. The emergence of low-observable global and direct solar radiation are a result of the total area affected by air pollutants, seemed to decline, equivalent to 2% - 4% of the actual value in general from 1990 to 2000. The decreasing at the range 280 - 530 nm and 530 - 630 nm are represented less than 50% of direct solar radiation and the stability of at the range 630 - 695 nm and 695 - 2800 nm it mean that; some of difference radiation is appear in diffused radiation which allow to height of the temperature as much as the largest associated with significance as it appears from the curves of relative humidity.
REFERENCES
- P. Foukal, C. Fröhlich, H. Spruit and T. M. L. Wigley, “Variations in Solar Luminosity and Their Effect on the Earth’s Climate,” Nature, Vol. 443, No. 7108, 2006, pp. 161-166. doi:10.1038/nature05072
- J. D. Haigh, “The Sun and the Earth’s Climate,” Living Reviews in Solar Physics, Vol. 4, No. 2, 2007, p. 2298.
- M. Lockwood, “Solar Change and Climate: An Update in the Light of the Current Exceptional Solar Minimum,” The Royal Society (London), Series A, Vol. 466, No. 2114, 2010, pp. 303-329. doi:10.1098/rspa.2009.0519
- W. Weber, “Strong Signature of the Active Sun in 100 Years of Terrestrial Insolation Data,” Annalen der Physik (Berlin), Vol. 522, No. 6, 2010, pp. 372-381.
- G. Feulner and S. Rahmstorf, “On the Effect of a New Grand Minimum of Solar Activity on the Future Climate on Earth,” Geophysical Research Letters, Vol. 37, No. 5, 2010, Article ID: L05707.
- L. J. Gray, J. Beer, M. Geller, J. D. Haigh, M. Lockwood, K. Matthes, U. Cubasch, D. Fleitmann, G. Harrison, L. Hood, J. Luterbacher, G. A. Meehl, D. Shindell, B. van Geel and W. White, “Solar Influences on Climate,” Reviews of Geophysics, Vol. 48, No. 4, 2010, Article ID: G4001. doi:10.1029/2009RG000282
- G. Toma De and O. R. White, “From Solar Minimum to Solar Maximum: Changes in Total and Spectral Solar Irradiance,” APJ, Vol. 463, No. 45, 2000.
- D. V. Hoyt and K. H. Schatten, “The Role of the Sun in Climate Change,” New York Oxford, Oxford University Press, 1997.
- P. M. Kelly and T. M. L. Wigley, “Solar Cycle Length, Greenhouse Forcing and Global Climate,” Nature, Vol. 360, No. 6402, 1992, pp. 328-330. doi:10.1038/360328a0
- Scafetta and West, “Estimated Solar Contribution to the Global Surface Warming Using the Acrim TSI Satellite Composite,” Geophysical Research Letters, Vol. 32, No. 18, 2005, p. L18713.
- R. C. Willson and A. V. Mordvinov, “Secular Total Solar Rradiance Trend during Solar Cycles 21 - 23,” Geophysical Research Letters, Vol. 30, No. 5, 2003, pp. 1-3. doi:10.1029/2002GL016038
- C. Frohlich and J. Lean, “Solar Radiative Output and Its Variability: Evidence and Mechanisms,” The Astronomy and Astrophysics Review, Vol. 12, No. 4, 2004, pp. 273- 320. doi:10.1007/s00159-004-0024-1
- J. L. Lean and D. H Rind, “How Natural and Anthropogenic Influences Alter Global and Regional Surface Temperatures: 1889 to 2006,” Geophysical Research Letters, Vol. 35, No. 18, 2008, Article ID: L18701, doi:10.1029/2008GL034864,2008.2307
- N. Scafetta, “Climate Change and Its Causes, a Discussion about Some Key Issues,” SPPI Original Paper, Science and Public Policy Institute, Haymarket, 2010, pp. 1-56.
- C. Fröhlich, “Solar Radiometry,” In: M. C. E. Huber, J. L. Culhane, A. Pauluhn, J. G. Timothy, K. Wilhelm and A. Zehnder, Eds., Observing Photons in Space ISSI, Scientific Reports SR-009, ESA Communications, Noordwijk, 2010, pp. 525-540.
- B. S. Groveman and H. E. Landsberg, “Simulated Northern Hemisphere Temperature Departures: 1579-1880,” Geophys. Research Letters, Vol. 6, No. 10, 1979, pp. 767-769. doi:10.1029/GL006i010p00767
- J. E. Hansen and S. Lebedeff, “Global Surface Air Temperatures: Update through 1987,” Geophysical Research Letters, Vol. 15, No. 4, 1988, pp. 323-326. doi:10.1029/GL015i004p00323
- T. Wenzler, “Reconstruction of Solar Irradiance Variations in Cycles 21-23 Based on Surface Magnetic Fields,” Ph.D. Thesis, Eidgenössische Technische Hochschule, Zürich, 2005.
- T. Wenzler, S. K. Solanki and N. A. Krivova, “Reconstructed and Measured Total Solar Irradiance: Is there a Secular Trend between 1978 and 2003?” Geophysical Research Letters, Vol. 36, 2009, Article ID: L11102. doi:10.1029/2009GL037519
- M. Vázquez and A. Hanslmeier, “Ultraviolet Radiation in the Solar System,” Springer Netherlands, Dordrecht, 2006.