Atmospheric and Climate Sciences
Vol. 2 No. 1 (2012) , Article ID: 17127 , 8 pages DOI:10.4236/acs.2012.21007
Assessment of Distribution and Composition of Quarry Mine Dust: Case of Pomona Stone Quarries, Harare
Department of Environmental Science, Bindura University of Science Education, Bindura, Zimbabwe
Email: *immacforever@yahoo.co.uk
Received August 18, 2011; revised September 29, 2011; accepted October 18, 2011
Keywords: Dust; PM10; PM2.5; Quarry Mine; Receptor
ABSTRACT
The study aimed at assessing the distribution and composition of dust produced at Pomona Stone Quarry mine in Harare, Zimbabwe. The source contribution to ambient PM2.5 and PM10 dust levels were quantified and their spatial distribution from the quarry to the receptor (community). The study also analysed the pH of soils around the mine, SiO2 and Al2O3 levels in quarry dust. Data was collected through direct observations, personal communications, experiments, soil and dust sampling and analyses. Dust sampling was done in January, April and August, to assess the effect of meteorological conditions on dust concentrations in two phases. Phase 1 was conducted during plant shut down (baseline measurements) while phase 2 was carried out during full plant operations (normal operating conditions), to assess the effect of quarry operations on the surrounding areas. Within the quarry production processes, crushing stage was the most dust emitting stage. Phase 1 dust results showed that both respirable (PM2.5) and inhalable (PM10) dust at all stages were below the legal limit, thus below 35 mg/m3 (respirable) and 180 mg/m3 (inhalable). Highest dust levels (209.9 mg/m3 inhalable and 69.01 mg/m3 respirable) were recorded in August, followed by April (206.9 mg/m3 inhalable and 67.52 mg/m3 respirable) then January (206.82 mg/m3 inhalable and 65.27 mg/m3 respirable). At all stages, highest dust concentrations for both parameters were recorded near the plant and decreased with increasing distance from the plant ( ranging from 209.9 mg/m3 - 19.41 mg/m3 inhalable and 69.01 mg/m3 - 14.23 mg/m3 respirable). This was attributed to the effect of particle size. August recorded the biggest area for both parameters falling within the non-permissible category, followed by April then January. The findings also revealed that the quarry dust contained higher levels of SiO2 (0.752 mg/cm3) which were 7 times higher than the recommended 0.1 mg/cm3 (NSSA). Low Al2O3 levels of 0.102 mg/cm3 were recorded and this was considered as environmentally safe. Soils were slightly acidic-alkaline and the t-test results at 95% confidence interval showed no significant difference between the results from site A and B (p = 0.526). It was concluded that quarry dust from Pomona had no significant effects on soil pH but possible health impacts on the receiving community. The study recommended that dust suppression systems such as water sprays, vegetation, air nets and enclosed production process must be implemented to curb dust emissions.
1. Introduction
1.1. Background
The extraction of minerals from surface mines and quarries produces significant fugitive dust emissions as a result of site activities such as blasting, road haulage, loading, crushing and stockpiling. Dust generated from surface mining sites is the result of a force applied to bulk material for economical extraction, handling, processing, storage and transportation [1]. If unmanaged, these emissions can cause serious environmental, health and toxicological, safety and operational effects impacting on both site personnel and the wider community [2]. Dust generation and its dispersion has also been found to be a major concern in air quality modeling of opencast mines that requires monitoring, protection and control of air pollution for sustainable development of mining industry [3].
1.2. Scope of the Study
The study quantified the source contribution to ambient PM2.5 and PM10 dust levels and their spartial distribution from the Pomona stone quarry to the receptor (community). The study also analysed the pH of soils around the mine, Silicon Dioxide (SiO2) and Aluminium Dioxide (Al2O3) levels in quarry dust. According to the records from Mt Pleasant clinic Out Patience Department, 17 Vainona residents have been treated for dust related diseases at Mt Pleasant clinic within a period from January 2009 to September 2009.
2. Methodology
The Pomona Quarry Mine is a private mining company established in 1951 and currently owned by Mr. T. Campbell and family. The mine covers an area of about 20 hectares. It is located in Hatcliffe Extension (17˚44'22.47"S, 31˚4'34.52"E) about 15 km Northeast of the Harare central business district. The study was a descriptive investigation in the category of survey research. Stratified random sampling and simple random sampling were used when selecting sampling points (Figure 1). The techniques used to collect data included personal communications, direct observations, soil and dust sampling. Dust sampling was done in 3 replicate stages in 2010. Stage 1 was carried out during the period of January, stage 2 in April and stage 3 in August. The temporal variation was to assess the effect of climate on dust concentration and distribution. At each stage, dust was collected in two phases during operations and shutdown periods.
Thirty six sampling points were marked from the different distance interval (one sampling point from each transect). The average dust level was used to represent dust levels of each interval. The results from phase 2 were then extrapolated to represent dust levels in all land uses and in all directions. This is based on the fact that the maximum dust levels are predominantly recorded along the direction of wind, so phase 2 results serves as the maximum dust levels which can be recorded in all directions from the quarry in the surrounding land uses.
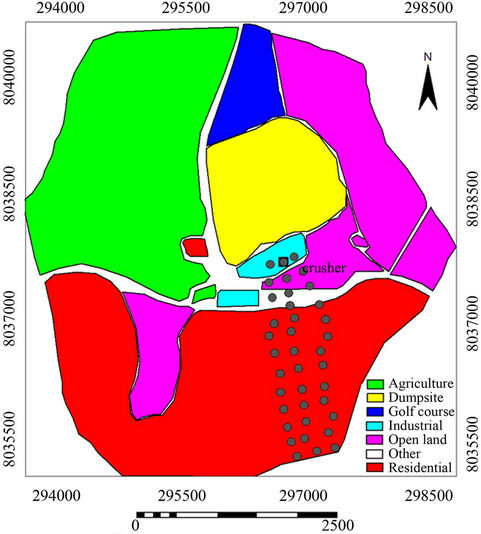
Figure 1. Study area map showing sampling points.
Chemical analyses of dust were done to check on the toxicity of dust from the quarry, so as to predict its possible impacts on human health and the environment. A Casella dust sampler and a GPS were used to collect dust onto the filters and to mark the sampling points respectively [4].
3. Results
The results showed sources of dust as the crushing and screening stages, with primary crushing being the most dust emitting stage. It was difficult to separate dust specifically from the crushers and from the screens as the two are closely located.
3.1. January Dust Level Results
The results in Figure 2 indicate that dust measurements under baseline conditions fall within the safe environmental hazard category (permissible levels) below 35 mg/m3 and 180 mg/m3 for respirable and inhalable dust respectively [4]. The R2-value for both parameters (0.4031 for inhalable and 0.0092 for respirable dust) were all below 0.5 which shows that there is no relationship between dust levels and distance from the crusher.
The results indicated that respirable dust levels recorded within the radius of 1200 m from the crusher and inhalable dust levels recorded within the radius of 400 m from the crusher were well above the limits and were regarded as environmentally unsafe [5,6]. The highest concentrations for both parameters were recorded near the crusher (66.67 mg/m3 for respirable and 212.12 mg/m3 for inhalable). It was observed that the respirable dust levels at the crusher were almost double the recommended “environmental safe emissions” [7].
A decreasing trend in dust levels with increasing distance from the crusher was noted on both parameters as shown by the trend lines. The R2-values for both respirable (0.9918) and inhalable (0.9768) were all above 0.5 which show a strong and statistically significant relationship between dust levels and distance from the crusher. By subtracting phase 1 dust levels from phase 2 dust levels (Figures 2 and 3), we remove any other sources of dust

Figure 2. Dust levels with distance from the crusher during normal working periods.
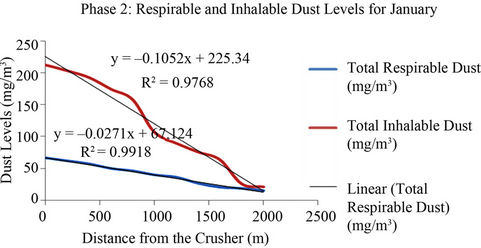
Figure 3. Inhalable and respirable dust with distance from the crusher.
and remain with actual dust generated by Pomona (Figure 4). This is the actual contribution of Pomona after all other dust from other sources identified in phase 1 was removed.
The results also showed a strong decreasing trend in dust levels with increasing distance from the plant as like in phase 2 results. (R2 = 0.9763 for inhalable and 0.9904 for respirable dust) which resembles a strong relationship between dust levels and distance from the crusher. The April results represent the ambient PM2.5 and PM10 dust concentrations during Pomona shut down. The January results showed that dust measurements under baseline conditions fall within the safe environmental hazard category (permissible levels) below 35 mg/m3 and 180 mg/m3 for respirable and inhalable dust respectively (R2 = 0.1841 for inhalable and 0.0343 for respirable). This shows that there is no significant relationship between dust levels and distance from the crusher (Figure 5).
Results showed increase in dust levels parameters as compared to the results for January (Figure 6). The highest inhalable dust (212.10 mg/m3) and respirable dust concentrations (68.92 mg/m3) were recorded near the crusher whilst the lowest dust concentrations (48.40 mg/m3 inhalable and 23.02 mg/m 3 respirable dust) were recorded on distance interval 2000 m. There was an increase in the area falling within the non-permissible category as compared to those recorded for January. A strong decreasing trend in dust levels with increasing distance from the crusher was also noted. Figure 7 were the actual contribution of Pomona after all other dust from other sources was removed. Just like phase 2 results, a strong decreasing trend in dust levels with an increase in distance from the crusher was also noted (R2 = 0.9799 (inhalable); 0.9915 for respirable dust).
The results in Figure 8 represent the ambient PM2.5 and PM10 dust concentrations during Pomona shut down. These served as baseline dust concentrations and they were non attributable to Pomona quarry operations. Like for January and April, the findings reveal that during Pomona shut down dust levels were also below the legal limit (environmentally safe) [8,9]. The R2-values (0.0708 for inhalable and 0.0008 for respirable dust) shows no relationship between dust levels and distance from the crusher.
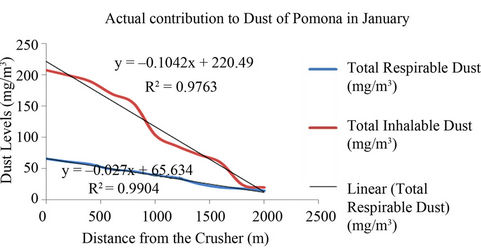
Figure 4. Actual contribution results of Pomona to ambient PM2.5 and PM10 dust concentrations for January.
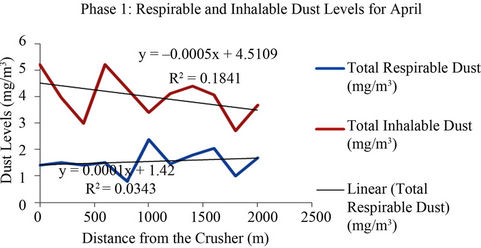
Figure 5. Phase 1 average dust level results per distance interval for April.
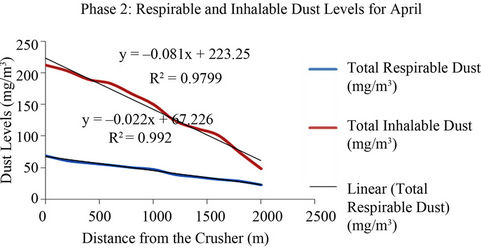
Figure 6. Dust levels per distance interval for April phase 2.
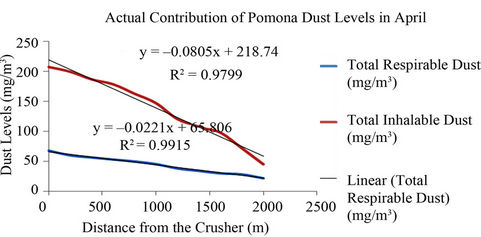
Figure 7. Average dust level results with varying distance intervals for August.
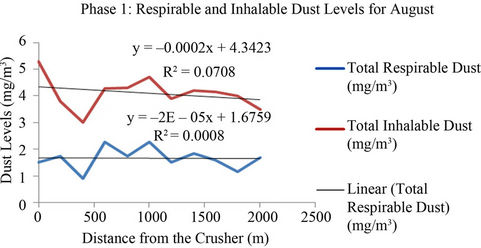
Figure 8. Phase 1 dust levels for August.
The results showed an increase in the spatial distribution of dust particles and an increase in dust levels as compared to the results recorded for January and April. Highest concentrations for inhalable dust (215.2 mg/m3) and 67.2 mg/m3) for respirable dust were recorded near the crusher. These were regarded as environmentally unsafe [8,9]. Lowest concentrations for inhalable dust (65.2 mg/m3) and 26.0 mg/m3 for respirable dust were recorded on distance 2000 m. Again like during phase 2 for January and April, a strong decreasing trend in dust levels with increasing distance from the crusher was also noted. R2 values of 0.96 (inhalable) and 0.99 (respirable) showed a strong relationship between dust levels and distance from the crusher. The ratio of respirable dust particles to inhalable dust particles also decreases with increasing distance from the crusher as in January and April.
Figure 9 shows the actual contribution results of Pomona to ambient PM2.5 and PM10 dust concentrations for August measurements. The results represent the actual contribution of Pomona to ambient air dust. They showed a slight decreasing difference in dust levels as compared to phase 2 results in Figure 10. A strong decreasing trend in dust levels with increasing distance from the crusher was noted (R2 = 0.9586 for inhalable dust and 0.9908 for respirable dust). The area of each land use type falling within each legislative category.
All phase 1 (baseline) measurements for both respirable (PM2.5) and inhalable (PM10) dust at all stages was below the legal limits of 35 mg/m3 for respirable and 180 mg/m3 for inhalable dust [10]. This means that at all stages, during phase 1 all land uses fall within the permissible category (environmentally safe category). The contribution of other sources besides Pomona Quarry to ambient PM2.5 and PM10 dust particles is environmentally safe and their chances for causing adverse health and environmental effects are very slim. Higher dust levels above the limit was recorded during phase 2 within the radius of 1000 m from the plant and within this radius, parts of the residential areas are covered. The causes of higher values were greatly attributed to the vicinity of the sampling points to the plant processing area where dust levels were greatly affected by vehicular movements and production processes.
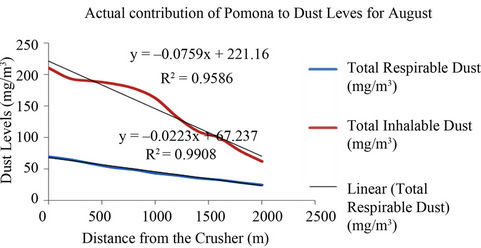
Figure 9. Actual dust levels contributed by Pomona only in August.
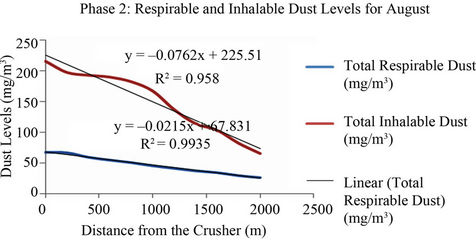
Figure 10. Dust level results with distance intervals for August phase 2.
Dust levels within this radius pose greater human health risks to those living within this area. People are at risk of developing dust related diseases such as silicosis, lung cancer, lung irritation and asthma [11]. To curb dust emissions and to reduce its effects on human health and the environment, this study suggest that dust control measures must be greatly improved at the plant (source). This can be through the implementation of atomised water mist dust suppressions or airborne dust captures around the whole plant. Driveways or roads into the mine and into the plant where heavy vehicles use can also be tarred, paved regularly or treated with crust forming chemicals to reduce fugitive dust as a result of vehicular movements [12]. According to Reference [13] this has been done on Sharift Coal Mine in Russia and the results show a reduction in fugitive dust emission by about 60% - 70%. August recorded the highest dust concentrations in all parameters, followed by April then January. Variations in dust levels between the stages were attributed to the effects of seasonality. January in Zimbabwe falls within the rainy season, August in the dry season and April is intermediate.
According to Reference [14], seasonality influences meteorological conditions such as humidity and rainfall that can act independently or synergistically to influence the behaviour of dust particle dispersion. Humidity which is high in January due to the prevailing rainy conditions in this month causes the adsorption of dust particles to water vapour. Adsorption of dust particles to water vapour increases the particle mass and size. This will cause it to fall, thus affecting its dispersion [14]. The low dust levels in January and April can be attributed to this effect.
Rainfall which is also high in January affect dust levels by increasing the moisture content of the raw materials at the quarry mine. According to Reference [15], if stones contain considerable moisture, their tendency of emit dust will be reduced by at least half. The study suggested that, wet dust suppression systems can be implemented at the primary crusher to reduce the effect of seasonality on the dryness of raw materials which will affect dust levels. These will spray water to the raw materials before it enter into the production process. This dust control measure has been used in many mines around the world. The recent results (March 2010) being from Lafarge Zimbabwe, a cement manufacturing company, where the suppression systems were implemented and cause a reduction in dust levels around the plant by 70% - 80%.
Comparing phase 2 results before and after the subtraction of phase 1 results, a slight decreasing difference in dust levels and area falling within each legislative category was noted. The difference between the two results is not significant. This is because all the areas that fall within the non-permissible and permissible category during phase 2 remain unchanged.
The findings in phase 2 showed a decreasing trend in dust levels with increasing distance from the plant. They also showed a rapid decrease in inhalable dust levels as compared to respirable dust levels. The ratio between the two parameters at all stages decreases as the distance from the plant increases. This shows the effect of particle size on dust distribution. Reference [13] revealed that larger particles fallout at a closer distance from the source whilst finer suspended particles will remain airborne almost indefinitely due to the dynamic nature of air currents and thermal activities.
Even though there were no significant changes in the production process, production level and raw material used during the period of study, phase 2 areas falling within the non-permissible category for both parameters increases at each stage. August recorded the bigger area falling within the non-permissible category on both parameters, followed by April and then January. This was attributed to the effect of wind speed. Wind is the transport media for dust. Dust can be carried for longer distances when the wind speed is high [13]. In Zimbabwe, August is the month where highest average wind speed is recorded hence influences the dispersion of dust particles to greater distances. This implied that more people were exposed dust and were at risk of developing respiratory diseases.
3.2. Chemical Analysis Results
The results showed the SiO2 levels (0.752 mg/cm–3) to be seven times higher than the recommended 0.1 mg/cm–3 (WHO standards). This poses greater health risks to those exposed to it. However, Al2O3 levels (0.102 mg/cm–3) were very low and considered as environmentally safe. Figure 11 below shows the soil pH from the analyses. The soil pH results were very acidic to slightly alkaline. The lowest pH level recorded was 4.9 whilst 8.1 was the highest pH level from site A. The lowest pH level recorded from site B was 4.9 whilst 7.6 was the highest. Tested at 95% confidence interval, the t-test results for the equality of means shows no significant difference between results from site A and results from site B (p = 0.526).
The results for the two chemically analysed elements showed the concentration of SiO2 (0.752 mg/cm–3) to be seven times higher than the recommended limit (0.1 mg/cm3) whilst low concentrations of Al2O3 (0.102 mg/cm–3) were recorded. This was attributed to the mineralogy and chemical properties of the raw materials (granite rocks). According to Chappell (2001), SiO2 occupy much of the greater portion with 76.3% whilst Al2O3 occupies 10.4% and the remaining 13.3% being shared among K2O, Na2O, CaO, FeO, Fe2O3, TiO2, P2O5 and MnO. People who are exposed to quarry dust are at a greater risk of developing silica induced diseases such as silicosis.
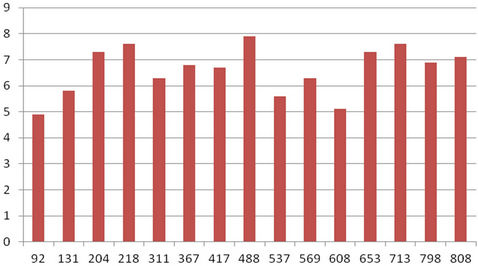
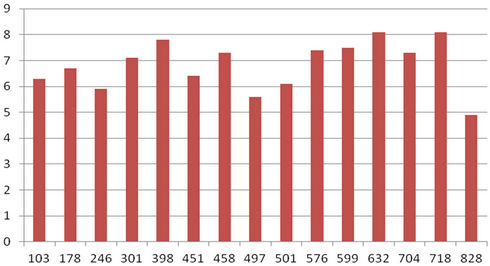
Figure 11. pH trends (y-axis) varying with distance (x-axis) from site A (left) and site B (right).
The soil pH results showed no significant difference between samples collected from site A and samples collected from site B (p = 0.526). Dust from Pomona does not have significant effects on soil pH. This might be due to dust containing little amounts of chemical elements that have an effect on soil pH.
3.3. Area Coverage Analyses
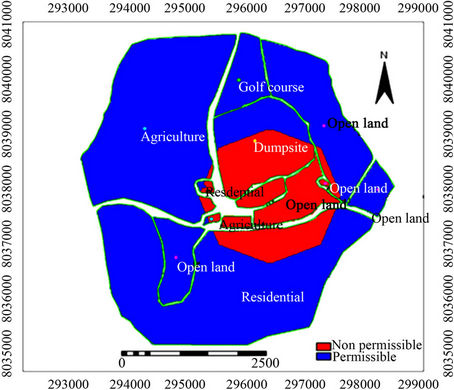
The area of each land use type falling within each legislative category before and after the subtraction of phase 1 results from phase 2 results is shown in Figure 12. A slight decreasing difference in the area falling within the permissible and non-permissible category was noted between phase 2 results and the final results. The area falling within the non permissible category was recorded highest in August, followed by April then lastly January for both respirable and inhalable dust (Figure 13).
The permissible category (blue area)-dust levels are below 180 mg/m3. The nonpermissible category (red area)
 (a)
(a)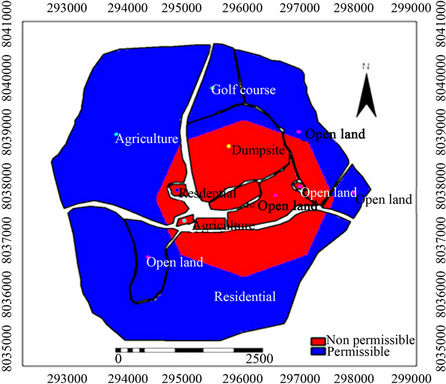 (b)
(b) (c)
(c)
Figure 12. Areas falling within each legislative category (permissible or non-permissible) for all the stages in January (a), April (b) and August (c) for Site A.
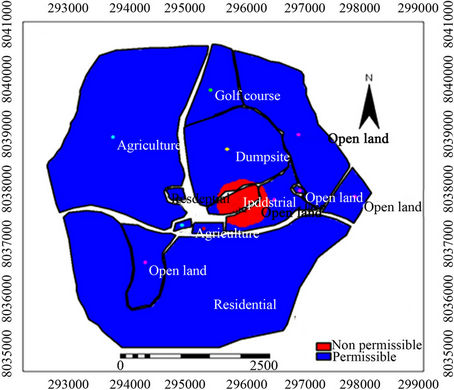 (a)
(a)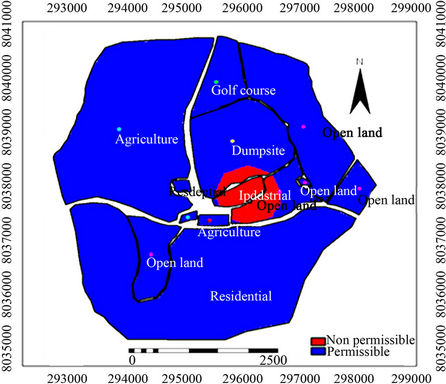 (b)
(b)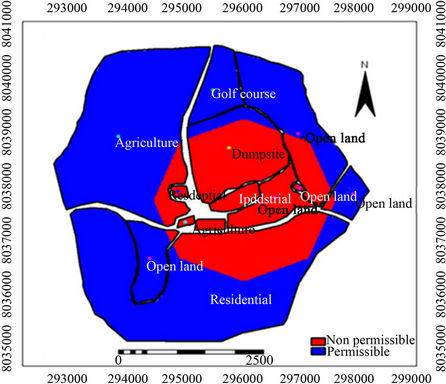 (c)
(c)
Figure 13. Study area maps showing the area falling within the non-permissible and permissible category according to respirable dust levels in January (a), April (b) and August (c) for Site B.
dust levels are above 180 mg/m3. The area was calculated starting at the plant, which is marked with a black dot on the map. The area shaded with red (non-permissible) is regarded as environmentally unsafe and people living within this area are at greater risk of developing dust related diseases.
4. Conclusions and Recommendations
4.1. Conclusions
Dust levels recorded during plant operation on all stages indicate that Pomona Quarries is the major source of dust to the surrounding community. It was also observed that of all the land uses which were under study, the whole industrial area, a small portion of the dumpsite, open land and residential fall within the non-permissible category. Pomona operations have the potential of causing dust related diseases such as asthma and lung cancer to those living within the residential areas falling under nonpermissible category. The study also concluded that quarry dust from Pomona contains SiO2 higher enough to cause health problems to those who are exposed to it. The study also concluded that, the amount of Al2O3 and other elements found in granite rocks were in small amounts such that they cannot cause any adverse effects on human health and on soil pH. Quarry dust from Pomona causes no significant effects to the pH of soils around the mine.
4.2. Recommendations
Adequate personal protective equipment (PPE) for employees is recommended to reduce occupational health risk. Dust masks, respirators and goggles should be provided and training on their use is a necessity. Medical health check-ups for mine workers must be carried out periodically, to ensure workers health. Atomised water mist dust suppressions, airborne dust capture through water sprays and wet dust suppression systems can be implemented in the plant. Driveways/road into the mine and into the plant where heavy vehicles use can be tarred or paved regularly to reduce fugitive dust into the atmosphere. Efforts should be channelled to work towards implementing an enclosed production process as this reduce or totally control dust emissions at the source so that it will not escapes into the environment. Annual and seasonal monitoring programme for dust emissions should be undertaken to assess the effect of different meteorological conditions on PM2.5 and PM10 dust levels in the surrounding community.
Good housekeeping as well as Resource Efficiency and Cleaner Production (RECP) technologies can be employed to reduce leakages and raw material losses along the production line consequently reducing emission of dust. Vegetation (trees like Eucalyptus trees) can be planted around the mine to act as windbreaks so as to reduce the wind speed. Reduced wind velocity allows larger particles to settle to the ground hence reduce its spatial distribution [1]. A detailed chemical analysis of the chemical properties and fractional compositions of quarry dust from Pomona is necessary to investigate any precursors of toxicological significance. The actual concentrations of all the chemical elements in quarry dust must be established.
The individual techniques need to be integrated into coherent strategy [10]. A dust control strategy should encompass a number of techniques, using the ones that are most appropriate for the situation. Each of the techniques used in the strategy requires careful thought and planning, thorough implementation and ongoing management [11]. The study recommends the strategies to be pro-active and effective and not just a paper exercises. They must be kept active and regular check-ups must be done to ensure that all measures are as effective as on the day they were first applied.
5. Acknowledgements
Thanks to Bindura University of Science Education, SIRDC and Pomona Stone Quarry Mine..
REFERENCES
- M. R. Beychock, “Fundamentals of Stack Gas Dispersion,” 4th Edition, Author-Published, 2005.
- T. Billerica, “Open Cast Mining in Western Europe,” Department of Mining Research, Cambridge University, Cambridge, 1998.
- Casella Ltd., “User Manual: Sampling Heads and Accessories for the Monitoring of Aerosols and Vapours,” Kempston, 2006.
- B. W. Chappell and A. J. R. White, “Two Contrasting Granite Types: 25 Years Later,” Australian Journal of Earth Sciences, Vol. 48, No. 4, 2001, pp. 489-499. doi:10.1046/j.1440-0952.2001.00882.x
- Environmental Protection Agency (EPA), “Air Quality Criteria for Particulate Matter,” Research Triangle Park, Vol. 10, 1999, p. 46.
- Environmental Protection Agency (EPA), “Executive Summary,” Air Quality Criteria for Particulate Matter, Research Triangle Park, Vol. 1, 2006, p. 95.
- Government of South Africa, “South African Ambient Air Quality Standards of 2009,” Pretoria, 2009.
- Government of Zimbabwe, “Environmental Management Act Chapter 20:27,” Harare, 2002.
- Government of Zimbabwe, “Environmental Management (Atmospheric Pollution Prevention Regulations) Statutory Instrument 72 of 2009,” Harare, 2009.
- G. Jones and M. Morgan, “Toxicity of Airborne Dust Generated by Opencast Coal Mining,” Paldi University, Paldi, 2003.
- A. Lodhi, “Particulate Matter (PM) Concentration and Source Apportionment,” Pakistan Space and Upper Atmosphere Research Commission, Lahore, 2009.
- D. Paleczny and M. Chenje, “The State of the Environment in Zimbabwe in 2005,” Ministry of Environment, Harare, 1998.
- Sciences Scope, Vol. 4, No. 3, 2009.
- T. Michigan, “Air Pollution Control Rules,” Prentice-Hall, Englewood Cliff, 2003.
- F. Morrall, “Dust Control Technologies,” British Ceramic Confederation, Federation House, Stoke, 2006.
NOTES
*Corresponding author.