Atmospheric and Climate Sciences
Vol. 2 No. 2 (2012) , Article ID: 18827 , 10 pages DOI:10.4236/acs.2012.22020
Geostatistical Analysis of Rainfall Temperature and Evaporation Data of Owerri for Ten Years
Department of Geosciences, School of Science, Federal University of Technology, Owerri, Nigeria
Email: echubos@yahoo.com
Received October 5, 2011; revised December 1, 2011; accepted December 19, 2011
Keywords: Evapotranspiration; Rainfall; Temperature; Oscillations; Precipitation; Surface Runoff; Recharge; Water Balance
ABSTRACT
Rainfall, evaporation and temperature data of Owerri for ten years (Figure 1) (1998-2007) were acquired. The data were analyzed using standard statistical measures and climatological normal (Figure 2). The results show that the rainfall pattern exhibits some oscillations indicating annual bimodal distribution of rainfall. The temperature reached its lowest value of 27.75˚C in 1999. Thereafter, a steady increase in temperature was noticed. From 2002, some variation in evaporation data was observed. The potential evapotranspiration shows some correlation with temperature. This variation in weather parameters may be attributed to climate change.
1. Introduction
The study area, Owerri Nigeria, lies within Latitude 5˚45′N - 5˚20′N and Longitude 6˚45′E - 7˚05′E, (Figure 3). It is experiencing rapid population growth which has caused and will continue to cause great stress on the groundwater resources. The water balance of a place, be it an agricultural field, watershed or urbanized area can be determined by calculating the input, output and storage changes of water on the ground surface. The major input of water is from precipitation and the major output is by evapotranspiration [1]. Thornthwaite and Mather (1962) pioneered the water balance approach to water resources analysis which includes availability, sustainability and the underlying hydrologic processes which provide planning and management. Observed changes in water balance of an area over a given time can be used to assess the effect of climate variability and human activities on water resources. Also the comparison of water balance from different areas allows the effect of factors such as geology, soil, vegetation and land use on the hydrologic cycle to be quantified.
2. Climatology and Geology of the Area
The study area is within the rain forest belt of Nigeria. Two distinct conditions (i.e. wet and dry seasons) exit. These two regimes are derived from the different air masses prevailing over the country at different times of the year namely; the dry northeasterly air mass of Saharan origin and the humid maritime air mass originating from the South Atlantic. The rainfall pattern in the area is oscillatory and usually has two peaks within the year. The peaks vary between June and September. The annual rainfall ranges from 1600 to 2900 mm. The wet season begins in April and ends in October with a short recess in August usually referred to as August break. The dry season starts in November and ends in March. Monthly temperature is highest in February with a value of 30.1˚C while the lowest is 26.7˚C which is recorded in August. The study area, Owerri, lies geologically within the Benin Formation (Figure 3). This formation is made up of friable sands with intercalations of clay and shale. The sand units are mostly coarse grained pebbly, poorly sorted and contains lenses of fine-grained sands [2] (Short and Stauble 1967).
3. Basic Theory
The study of hydrological cycle deals with the transfer of water from one state to another [3] (Ward, 1967). The transformation involved in the various stages includes evaporation and transpiration, moisture transport, condensation, precipitation and runoff [4] (Oguntoyinbo 1987). Hydrologic cycle is evaluated by means of a water balance studies (Figure 4) and (Figure 5) which have four components namely: Precipitation, Evapotranspiration (i.e. the return of water to the atmosphere by surface evaporation and plant transpiration) surface runoff (negligible in areas of negligible slopes) and lastly, groundwater recharge. These components may add water to an


Figure 1. Rainfall vs potential evapotranspiration for 1998.

Figure 2. Rainfall vs potential evapotranspiration for 1999.
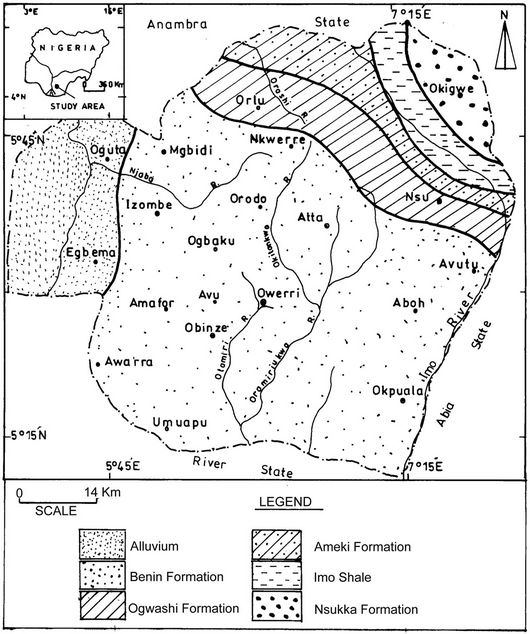
Figure 3. Location/geology map.

Figure 4. Rainfall vs potential evapotranspiration for 2000.

Figure 5. Rainfall vs potential evapotranspiration for 2001.
environment, these are called inputs (rainfall). They may remove water from an environment, these are called outputs (evaporation). Water may be held in an environment, these are called storage. The water balance of a particular environment for a set period of time is expressed mathematically as the continuity equation: Input − Output = Change in Storage.
A decrease in storage is called a deficit while an increase in storage is called a surplus. A general study of the water balance in Nigeria [5] (Obasi, 1972) shows that water deficit provides measure of drought and gives basic information relevant to irrigation. The water surplus data provide essential information relating to ground water levels and runoff to stream [1]. Thornthwaite and Mather (1962) published a set of water balance data for 104 West African Stations.
4. Methodology
The rainfall data were acquired using the rain gauge equipment installed at the Owerri Municipal Meteorological Station. Likewise the temperature data for the period under study (1998-2007) were recorded with the maximum and minimum thermometers at the same meteorological station (Figures 6 and 7). The thermometers were kept in a standard Shelf known as Stephenson screen. The most standard method of measuring evaporation is by using a class “A” Pan with a diameter of 1.2 m kept within the soil at a depth of 250 mm. It protruded above the ground to a height of 150mm. The water level in the pan was kept at 50 mm - 75 mm from the rim. All the data acquired viz; rainfall, temperature and evaporation are shown in Tables 1-3 respectively.
5. Data Analysis and Interpretation
Potential evaporation estimation involved the use of some known empirical techniques. The potential evapotranspiration was estimated by considering the number of daylight hours and number of days in the month [1] (Thornthwaite and Mather 1962). Statistical analysis of the data was carried out. An estimate of the potential evapotranspiration, calculated on a monthly basis, is given by:
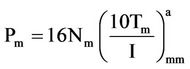
where m is the months 1, 2, 3, , 12;
, 12;
Nm is the monthly adjustment factor related to hours of daylight;
Tm is the monthly mean temperature (C);
I is the heat index for the year;
a is an empirical constant.
Given the monthly mean temperatures from the measurements at a climatological station, an estimate of the potential evaporation for each month of the year was calculated.

Figure 6. Rainfall vs potential evapotranspiration for 2002.

Figure 7. Rainfall vs potential evapotranspiration for 2003.
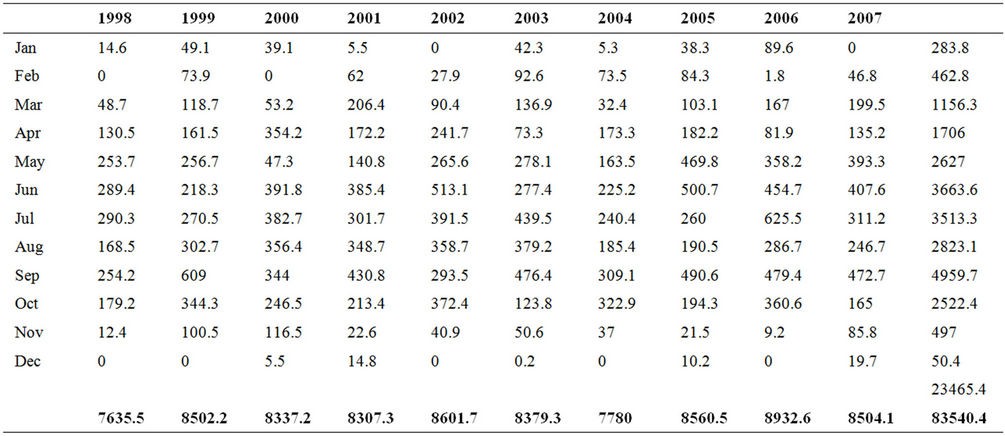
Table 1. Rainfall data 1998-2007.

Table 2. Temperature data 1998-2007.
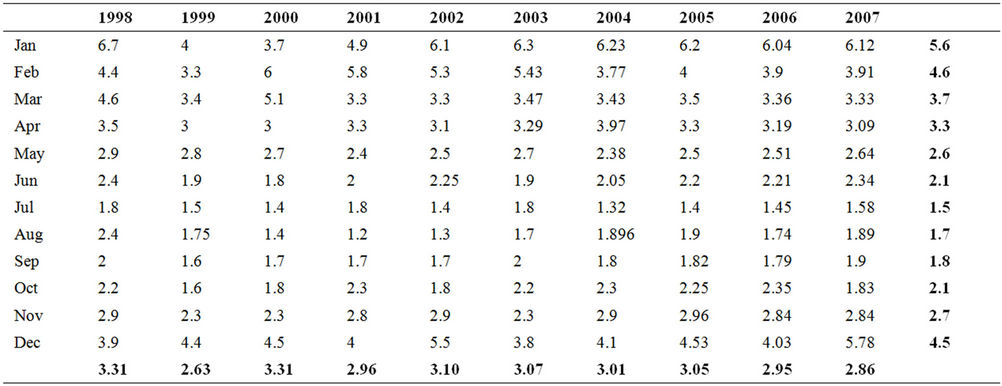
Table 3. Evaporation data 1998-2007.
5.1. Rainfall
The mean monthly rainfall over the years consists of two peaks i.e. June and September with a drop in the precipitation around August. While November, December, January, February and March indicate dry season (Figure 5).
The rainfall pattern in the area over the period of ten years is oscillating, (Figure 5).
5.2. Potential Evapotranspiration
The mean annual potential evapotranspiration for the period of study is convex shaped upward with July and August having the lowest evapotranspiration. April to October are usually wet period and they indicate period of ground water recharge. The mean annual rainfall is 2346 mm while mean annual potential evapotranspiration is 1300 mm. January, February, March, November and December are usually periods of water deficit with a mean annual value of 340 mm of water being evaporated annually.
A mean annual value of 1385.78 mm of water is surplus (See Tables 1-3).
The time series/moving average method was applied to the data and the results are presented in Tables 4-6.

Table 4. Evaporation time series.
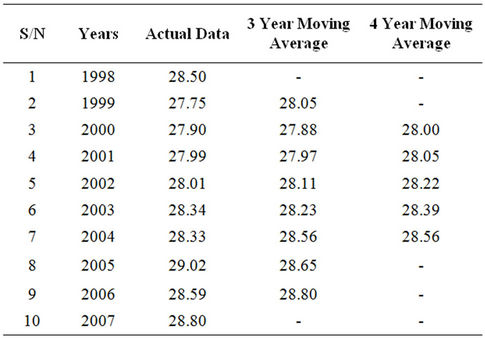
Table 5. Temperature time series.
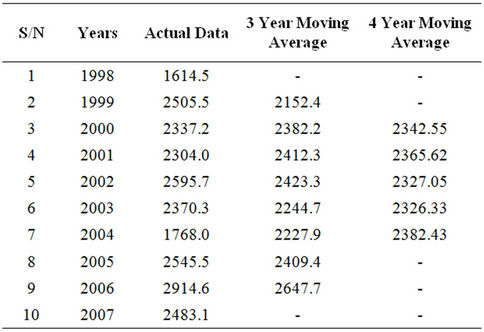
Table 6. Rainfall time series.
6. Result and Discussion
6.1. Rainfall
The analysis of the rainfall results shows that the mean annual rainfall for Owerri, ranges from 1641.5 mm to 2914.6 mm. The climatological normal rainfall for Owerri was computed to be 2346.0 mm, (Figure 3). Four years fell below the normal. From 2004, the rainfall was constantly above the normal. The rainfall pattern exhibited some oscillation between 1998 and 2007 with a peak value in 2006, (Figure 5). June, July and September are usually the peak of rainfall within the study. It then looks like a bimodal distribution, (Figure 4).
6.2. Temperature
The climatological normal for temperature within this period was computed and estimated to be 28.32˚C, (Figure 9). The mean annual temperature within this period of study varied between 28.50˚C in 1998 and 29.80˚C in 2007, (Figure 8). It can be observed that from 2001, the mean annual temperature was above the climatological normal temperature (Figure 9). This implied that the temperature of the area was increasing at the rate of 0.17˚C per year, (Figure 8).
The lowest temperature of 27.75˚C was recorded in 1999. Since then a steady increase has been observed, (Figure 9). Climatological normal value was reached in 2003. From subsequent years, the temperature had been above normal and in fact on the increase. The constant increase in temperature above the climatological normal has been attributed to human impact on the climate and the environment which includes increase in population, urbanization and deforestation.
6.3. Evapotranspiration
The climatological normal for evaporation within this period of study was computed as 3.02 +ml. The class A

Figure 8. Rainfall vs potential evapotranspiration for 2004.

Figure 9. Rainfall vs potential evapotranspiration for 2005.

Figure 10. Rainfall vs potential evapotranspiration for 2006.

Figure 11. Rainfall vs potential evapotranspiration for 2007.
pan evaporation within this period ranges from 2.63 +ml to 3.31 +ml. The fairly constant variation in evaporation from 2002 indicates deforestation. This can also be seen from the correlation coefficient, that the evaporation was poorly correlated. Over the years a correlation coefficient of 0.27 was calculated. The monthly evaporation over the years is convex upward showing that evaporation decreases from January to July and increases from August to December, (Figure 10).
The empirical determination of potential evapotranspiration using temperature values and the estimation of the climatological normal showed that the climatological normal for potential evapotranspiration was 109.5 mm. Five values fall below the normal. This shows that the potential evapotranspiration was increasing over the years. Analysis using correlation coefficient shows that the correlation coefficient between potential evapotranspiration and temperature is 0.96 indicating that it is strongly correlated. The continuous rise in potential evapotranspiration from 2003 above the climatological normal (Figure 11) shows an increase in temperature and thus a very high evaporation and transpiration from plants.
7. Conclusions and Recommendation
From the results of this study, the period of water surplus within this study area extended from March to October. Rain water is available for recharge of aquifers. Urbanization could increase surface runoff by creating more impervious surfaces such as highways etc. Temperature also increased due to urbanization which increased the carbon dioxide emitted into the atmosphere. Attempts should be made to improve on the drainage system so as to cater for the increasing runoff caused by urbanization. This will minimize flooding disaster.
Flowers and trees should be planted within the metropolis to compensate for the amount of carbon dioxide emitted into the atmosphere. The amount of green house gases emitted through human activities should be checked in order to reduce unnecessary warming of the atmosphere.
REFERENCES
- C. W. Thornthwaite and J. R. Mather, “Average Climate Water Balance Data of the Continents. Part 1,” Africa Publication in Climatology, Vol. 15, No. 2, 1962, pp. 68- 92.
- K. C. Short and A. J. Stauble, “Outline of Geology of Niger Delta,” Bulletin of American Association of Petroleum Geologist, Vol. 57, No. 5, 1967, pp. 761-779.
- R. C. Ward, “Principles of Hydrology,” Mc-GrawHill, London, 1967, p. 216.
- J. S. Oguntoyinbo, “Heat and Water Balance Studies in Nigeria,” The Role of Hydrology and Hydrometeorology in the Economic Development of Africa, Vol. 301, No. 2, 1987, pp, 1-9.
- G. O. P. Obasi, “Water Balance in Nigeria,” Nigeria Metrological Service Quarterly Met. Magazine, Vol. 2, No. 2 1972, pp. 91-127.