International Journal of Astronomy and Astrophysics
Vol. 2 No. 1 (2012) , Article ID: 18182 , 13 pages DOI:10.4236/ijaa.2012.21007
Surface Photometry and Dynamical Properties of Lenticular Galaxies: NGC3245 as Case Study
1Astronomy Department, Faculty of Science, King Abdul Aziz University, Jeddah, Saudi Arabia
2Astronomy, Space Science, Meteorology Department, Faculty of Science, Cairo University, Giza, Egypt
3Physics Department, National Research Center, Giza, Egypt
4Mathematics Department, College of Science for Girls, King Abdul Aziz University, Jeddah, Saudi Arabia
Email: khadiga@sci.cu.edu.eg
Received January 17, 2012; revised February 18, 2012; accepted February 28, 2012
Keywords: Surface Photometry; Dynamical Galaxies
ABSTRACT
In this paper, surface photometry and dynamical properties of Lenticular galaxies will be developed and applied to NGC3245. In this respect, we established new relation between the intensity distribution I and the semi-major axis a Moreover, some basic statistics of both independent and the dependent variables of the relation are also given. In addition to the I(a) relation , the Sérsic r1/n model is applied for the intensity profile I(r) resulting in an estimation of the effective radius, re, and the surface brightness it encloses, µe. Both relations (I(a) and I(r)) are accurate as judged by the precision criteria which are: the probable errors for the coefficients , the estimated variance of the fit and the Q value (the square distance between the exact solution and the least square estimated solution) where all very satisfactory. Correlation coefficients between some parameters of the isophotes are also computed. Finally as examples of applications of surface photometry we determined the dynamical properties: mass, density, potential distributions, as well as distributions of escape and circular speeds in terms of Sérsic model.
1. Introduction
Surface photometry is a bidimensional broadband technique to quantitatively describe the light distribution of extended objects like galaxies and HII regions. It is a technique rather than a distinct field of research. Reynolds [1] was the first one to try applying surface photometry on galaxies so it is considered as one of the oldest techniques in modern astronomy [2].
Surface photometry is extremely important since it helps us to get information on galactic colors and its implied ages and metallicity gradients [3], stellar populations [4-7], dust content and its extinction [5,8-11], and structure, formation and evolution of galaxies [12,13].
Surface photometry is usually based on fitting ellipses to the isophotes of galaxies especially for ellipticals and lenticulars whose their isophotes show little deviation from being perfect ellipses. Several software packages and tools can perform surface photometry; among them are GALPHOT [14], GASPHOT [15], GALFIT [16], GIM2D [17], and ISOPHOTE.
The package that concerns us here is the ISOPHOTE. The ISOPHOTE’s principle task is the ELLIPSE task which does the essential role of fitting the elliptical isophotes to the galaxy image. In addition to ELLIPSE, ISOPHOTE includes some “parameter set” tasks that control the process of ELLIPSE execution and other tasks that test the ELLIPSE performance by examining its results. The algorithm upon which ELLIPSE is based and how to deal with the various tasks is well described in [18] and [19]. The result of applying ELLIPSE task is a table containing the variation of many important quantities, like intensity, ellipse shape parameters, and Fourier coefficients which quantify the amount by which isophotes deviate from perfect ellipses, with semi-major axis. The most important parameter, on which we are interested here, is the intensity distribution. The first goal of this paper, is the establishment of a new relation to describe the intensity profile I(a), in contrast to the usual trials of describing I(r).
On the other hand, intensity profile I(r) plays an important role in finding the distributions density, mass, and potential which play a key role in the understanding of the galactic dynamics. We will derive these dynamical properties in terms of intensity profile I(r), which is the second goal of this paper. This is done by fitting it by a suitable model. A number of models have been put to describe the relation I(r), easily obtained from I(a), the most accepted ones are the Sérsic model for bulges and the exponential law for disks.
In the present paper, we applied the surface photometry on the g-band image of the galaxy NGC 3245 obtained from the Sloan Digital Sky Survey (SDSS). The resulted data are shown in Appendix B. Its intensity profile is well fitted by the Sérsic model at n = 2.9, then , we Substituted by Sérsic formula in our derivations for dynamical properties.
NGC 3245 (UGC 5663) is a late S01 galaxy. It is composed of an extremely bright, mildly active nucleus surrounded by a lower-surface brightness (but still very bright), smooth lens ending with a diffuse, faint outer envelope. The nucleus is spherical while both the lens and the envelope have an E5-like flattened structure [20-22]. Jian Hu [23] suggested the coexistence of a central classical bulge and outer boxy bulge in this galaxy since he found it as a boxy one with bulge Sérsic index ~4. Using measurements of surface brightness fluctuations, Tonry i [24] determined its distance modulus as 31.6 ± 0.20 (a distance of 20.9 Mpc) [25].
Section 2 describes the basic formulations including the linear least-square modeling of data and some basic statistics. Section 3 presents the new relation for I(a). Section 4 gives a brief description on the Sérsic model and the results of fitting. In Section 5, we derive in detail various dynamical quantities in terms of I(r). The conclusion is given in Section 6. Finally, statistical analysis of ELLIPSE output data is shown in Appendix A.
2. Basic Formulations
2.1. Linear Model Analysis of Observational Data in the Sense of Least-Squares Criterion
Let z be represented by the general linear model of the form  where
where  are linearly independent functions of x. Let c be the vector of the exact values of the c's coefficients and
  the least-squares estimators of c obtained from the solution of the normal equations of the form
  The coefficient matrix
  is symmetric positive definite ,that is , all its eigen values
 are positive. Let
  denotes the expectation of f and
  the variance of the fit, defined as:
 (1)
(1)
where
 (2)
(2)
N is the number of observations, y is the vector with elements  and
and  has elements
 . The transpose of a vector or a matrix is indicated by the superscript “T”. According to the least-squares criterion, it could be shown that [26]
1) The estimators  by the method of least-squares gives the minimum of
 .
.
2) The estimators  of the parameters c, obtained by the method of least-squares are unbiased; i.e.
3) The variance–covariance matrix  of the unbiased estimators
  is given by:
 (3)
(3)
4) The average squared distance between  and c is:
 (4)
(4)
Finally it should be noted that if the precision is measured by the probable error  then
then
 (5)
(5)
2.2. Coefficient of Correlation
A coefficient of correlation is a statistical measure of the degree to which two variables x and y (say) are related to each other. In case of a linear equation, the coefficient of correlation is (e.g. [27])
 (6)
(6)
where

 indicates that the two variables are totally correlated, R = 0, no relationship between them, and
  indicates that there is a trend between the two variables x and y. The sign of R indicates whether y is increasing or decreasing when x increasing, while its magnitude indicates how well the linear approximation is.
2.3. Some Basic Statistics
For data analysis of the present paper we used some basic statistics of these are:
1) Descriptive statistic; 2) Location Statistics; 3) Dispersion statistics; 4) Shape statistics.
2.4. Autocorrelation
Autocorrelation is important in time series analysis. Let  be the autocorrelation at lag k. An estimate of
  is [28]:
 (7)
(7)
where  is the mean of the data
 .
.
3. New Relation between I and a of the Lenticular Galaxy NGC3245
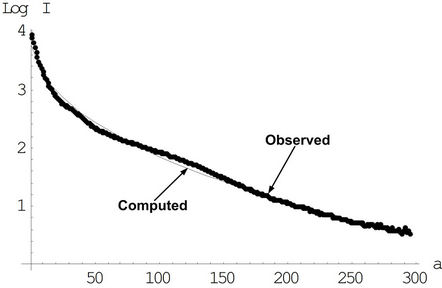
In what follows, new relation describing the intensity profile along the semi-major axis, I(a) for the lenticular galaxy NGC3245 will be established in the sense of least–squares criterion of Section 2.1. The data used for this relation are the first two columns of Table I of Appendix B resulted by applying the IRAF ELLIPSE task on the SDSS g-band image of the galaxy.
Moreover, some basic statistics of independent variable (a) and the dependent variable (I) of this relation are given in Appendix A.
The relation and its error analysis are:
3.1. The Fitted Equation
 .
.
3.2. The c’s Coefficients and Their Probable Errors

 .
.
3.3. The Probable Error of the Fit
 .
.
3.4. The Average Squared Distance between c and 
 .
.
3.5. The Observed and Computed Data
4. Sérsic Model
The intensity distribution along the equivalent radius can be expressed by Sérsic model [29,30]

where re is the effective radius, the radius encloses half of the whole of the galaxy, Ie is the intensity at this radius, and bn can be given by the expression

Detailed deduction and approximation of bn is discussed in Graham & Driver [31] ([32]).
Starting by the above expression of I(r), Caon et al. [33] converted Sérsic’s equation to the following formula that describes the surface brightness distribution

by using the formula

hence, by definition, µe is the surface brightness at re.
By fitting the intensity profile of the SDSS g-band image of NGC3245 by Sérsic model we found that the profile is well fitted at n = 2.9.
Using the first three columns of Table I of Appendix B with  we get for fitting the intensity profile I(r) by Sérsic model in the sense of least-squares criterion of Section 2.1. the following:
4.1. The Fitted Equation
 .
.
4.2. The c’s Coefficients and Their Probable Errors


4.3. The Probable Error of the Fit

4.4. The Average Squared Distance between c and 

4.5. The Observed and Computed Data

From the values of c1 and c2, we get the effective radius re = 18.95″, whereas µe = 17.5578 mag/arcsec2.
5. Dynamical Properties
The dynamical properties of galaxies can be easily obtained if the intensity profile along radius I(r) is available. As I(r) is the main output from the surface photometry technique, distributions of properties like density, mass, potential, escape and circular velocities can be found as follows:
5.1. Density Distribution
The density distribution is given by

where γ is the mass to light ratio.
Sérsic defined I(r) as

If we defined k = bn/re1/n and A = ebn, Sérsic equation can be written as

Then, ρ(r) can be written as

5.2. Mass Distribution
The mass enclosed by a given radius r is
 .
.
Substituting by the formula of ρ(r)
 .
.
Putting , and
, and , then M(r) becomes
 .
.
Let us consider the general integral
 .
.
Integrating, by parts, we get.

Substituting for Q0, Q1, Q2 , we can deduce the relation

going back to the initial values of R and m, the final mass descriptive equation is resulted.

If n is a positive fraction , then we have to consider  where [t] is the greatest integer
  (for our case n is taken as 3).
5.3. Distribution of Potential
The potential in terms of ρ(r) is given by

where G is the gravitational constant.  can be regarded as

where


by following similar integration steps as that done for mass,  (r) equals

substituting by both expressions of  and
and , the final equation of
  is
is

5.4. Distribution of Escape Speed
The escape speed  is given by

substitution by  results in

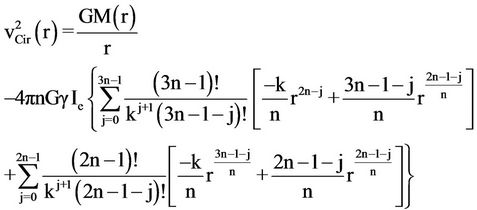
5.5. Distribution of Circular Speed

by substituting for the expression of  and differentiation, we get
6. Conclusions
In this paper, surface photometry is applied on the lenticular galaxy NGC 3245 as a case study to resulting in the new relation Log I(a) = c1 + c2 a0.44 , we hope to generalize this relation in the future by applying a large descriptive sample of galaxies.
Since the intensity profile I(r) is well fitted by the Sérsic r1/n model where n = 2.9, we derived relations for various dynamical properties in terms of Sérsic model, strengthening the usefulness of the surface photometry technique.
Both relations, I(a) and I(r), are accurate as judged by a given precision criteria based on linear least-squares fitting criterion. Correlation coefficients between some parameters of the isophotes are also computed.
REFERENCES
- R. H. Reynolds, “The Light Curve of the Andromeda Nebula (NGC 224),” Monthly Notices of the Royal Astronomical Society, Vol. 74, 1913, pp. 132-136.
- S. Okamura, “Surface Photometry of Galaxies,” Publications of the Astronomical Society of the Pacific, Vol. 100, No. 627, 1988, pp. 524-544. doi:10.1086/132201
- H. Wu, Z. Shao, H. J. Mo, X. Xia and Z. Deng, “Optical and Near-Infrared Color Profiles in Nearby Early-Type Galaxies and the Implied Age and Metallicity Gradients,” The Astrophysical Journal, Vol. 622, No. 1, 2005, pp. 244-259. doi:10.1086/427821
- L. Searle, W. L. W. Sargent and W. G. Bagnuolo, “The History of Star Formation and the Colors of Late-Type Galaxies,” The Astrophysical Journal, Vol. 179, 1973, pp. 427-438. doi:10.1086/151882
- R. F. Peletier, E. A. Valentijn, A. F. M. Moorwood and W. Freudling, “The Distribution of Dust in Sb’s and Sc’s—K-Band Infrared Imaging of a Diameter Limited Sample of 37 Galaxies,” Astronomy and Astrophysics Supplement, Vol. 108, 1994, pp. 621-641.
- D. R. Silva and R. Elston, “Probing Radial Age/Metallicity Degeneracy in Early-Type Galaxies,” The Astrophysical Journal, Vol. 428, No. 2, 1994, pp. 511-543. doi:10.1086/174263
- A. S. Gusev, “Multicolor CCD Photometry of Six Lenticular and Spiral Galaxies. Stellar Population of the Galaxies,” Astronomy Reports, Vol. 50, No. 3, 2006, pp. 182- 193.
- R. Evans, “The Variation of the Scalelengths of Galaxies at Different Wavelengths,” Monthly Notices of the Royal Astronomical Society, Vol. 266, No. 2, 1994, pp. 511- 523.
- R. F. Peletier, E. A. Valentijn, A. F. M. Moorwood, W. Freudling, J. H. Knapen and J. E. Beckman, “The Extinction by Dust in the Outer Parts of Spiral Galaxies,” Astronomy & Astrophysics, Vol. 300, No. 1, 1995, p. L1.
- R. S. de Jong, “Near-Infrared and Optical Broadband Surface Photometry of 86 face-on Disk Dominated Galaxies. III. The Statistics of the Disk and Bulge Parameters,” Astronomy & Astrophysics, Vol. 313, 1996, pp. 45-64.
- K. Ganda, R. F. Peletier, M. Balcells and J. Falcón-Barroso, “The Nature of Late-Type Spiral Galaxies: Structural Parameters, Optical and Near-Infrared Colour Profiles and Dust Extinction,” Monthly Notices of the Royal Astronomical Society, Vol. 395, No. 3, 2009, pp. 1669- 1694. doi:10.1111/j.1365-2966.2009.14658.x
- J. A. L. Aguerri, A. M. Varela, M. Prieto and C. Muñoz-Tuñón, “Optical Surface Photometry of a Sample of Disk Galaxies. I. Observations and Data Reduction,” The Astrophysical Journal, Vol. 119, No. 4, 2000, pp. 1638- 1644.
- L. A. M. Tasca and S. D. M .White, “Quantitative Morphology of Galaxies from the SDSS. I. Luminosity in Bulges and Discs,” Astronomy & Astrophysics, Vol. 530, 2011, p. 106.
- W. Freudling, “A Package for Surface Photometry of Galaxies,” Proceedings of 5th ESO/ST-ECF Data Analysis Workshop, Garching, 26-27 April 1993, p. 27.
- E. Pignatelli, G. Fasano and P. Cassata, “GASPHOT: A Tool for Galaxy Automatic Surface PHOTometry,” Astronomy & Astrophysics, Vol. 446, No. 1, 2006, pp. 373- 388.
- C. Y. Peng, L. C. Ho, C. D. Impey and H. Rix, “Detailed Structural Decomposition of Galaxy Images,” The Astrophysical Journal, Vol. 124, No. 1, 2002, pp. 266-293.
- F. R. Marleau and L. Simard, “Quantitative Morphology of Galaxies in the Hubble Deep Field,” The Astrophysical Journal, Vol. 507, No. 2, 1998, pp. 585-600. doi:10.1086/306356
- R. I. Jedrzejewski, “CCD Surface Photometry of Elliptical Galaxies. I-Observations, Reduction and Results,” Monthly Notices of the Royal Astronomical Society, Vol. 226, No. 1, 1987, pp. 747-768.
- B. Milvang-Jensen and I. Jørgensen, “Galaxy Surface Photometry,” Baltic Astron, Vol. 8, 1999, pp. 535-574.
- A. Sandage, “The Hubble Atlas of Galaxies,” Carnegie Institution of Washington, Washington, 1961.
- G. De Vaucouleurs and A. De Vaucouleurs, “Reference Catalogue of Bright Galaxies,” University of Texas, Austin, 1964.
- A. Sandage and J. Bedke, “The Carnegie Atlas of Galaxies,” Vol. I, Carnegie Institution of Washington, Washington, 1994.
- J. Hu, “The Black Hole Mass-Stellar Velocity Dispersion Correlation: Bulges versus Pseudo-Bulges,” Monthly Notices of the Royal Astronomical Society, Vol. 386, No. 4, 2008, pp. 2242-2252. doi:10.1111/j.1365-2966.2008.13195.x
- J. L. Tonry, A. Dressler, J. P. Blakeslee, E. A. Ajhar, A. B. Fletcher, G. A. Luppino, M. R Metzger and C. B. Moore, “The SBF Survey of Galaxy Distances. IV. SBF Magnitudes, Colors, and Distances,” The Astrophysical Journal, Vol. 546, No. 2, 2001, pp. 681-693. doi:10.1086/318301
- A. J. Barth, M. Sarzi, H. Rix, L. C. Ho, A. V. Filippenco and W. W. Sargent, “Evidence for a Supermassive Black Hole in the S0 Galaxy NGC 3245,” The Astrophysical Journal, Vol. 555, No. 2, 2001, pp. 685-708. doi:10.1086/321523
- Z. Kopal and M. A. Sharaf, “Linear Analysis of the Light Curves of Eclipsing Variables,” Astrophysics and Space Science, Vol. 70, No. 1, 1980, pp. 77-101.
- J. Meeus, “Astronomical Algorithms,” Willmann-Bell, Inc., Richmond, 2000.
- G. E. P. Box and G. M. Jenkins, “Time Series Analysis, Forecasting and Control,” Holden-Day, San Francisco, 1976.
- J. L. Sérsic, “Atlas de Galaxies Australes,” Observatorio Astronomico, Cordoba, 1968.
- J. L. Sérsic, “Influence of the Atmospheric and Instrumental Dispersion on the Brightness Distribution in a Galaxy,” Boletin de la Asociacion Argentina de Astronomia, Vol. 6, 1963, p. 41.
- A. W. Graham and S. P. Driver, “A Concise Reference to (Projected) Sérsic R1/n Quantities, Including Concentration, Profile Slopes, Petrosian Indices, and Kron Magnitudes,” Publications of the Astronomical Society of Australia, Vol. 22, No. 2, 2005, pp. 118-127. doi:10.1071/AS05001
- F. Jiang, S. Huang and Q. Gu, “Surface Photometry and Radial Color Gradients of Nearby Luminous Early-Type Galaxies in SDSS Stripe 82,” Research in Astronomy and Astrophysics, Vol. 11, No. 3, 2011, pp. 309-326.
- N. Caon, M. Capacciolo and M. D’Onofrio, “On the Shape of the Light Profiles of Early Type Galaxies,” Monthly Notices of the Royal Astronomical Society, Vol. 265, No. 4, 1993, p. 1013.
Appendix A
Analysis of the Semi-Major Axis a and the Intensity I of the Lenticular Galaxy NGC3245
I-Coefficients of correlation between ellipse task parameters Correlation coefficient between a & I= –0.430894 Correlation coefficient between a & e= 0.201083 Correlation coefficient between a & Pa = –0.240178
Correlation coefficient between a & e = –0.81832 Correlation coefficient between a & Pa = 0.860549 Correlation coefficient between a & Pa = –0.662681 II-Statistics of the semi-major axis a II-1-Basic Descriptive Statistics
• The mean = 148
• The median (central value) = 148
• The variance = 7276.67 II-2-Location Statistics
• The geometric mean = 109.9175238162870485
• The harmonic mean = 47.0803
• The root mean square = 170.751 II-3-Dispersion Statistics
• The Variance of sample mean = 24.6667
• The standard error of sample mean = 4.96655
• The coefficient of variation = 0.576374
• The mean deviation = 73.7492
• The median deviation = 74
• Sample range = 294 II-4-Shape Statistics
• Skewness = 0
• The Pearson skewness 2 = 0
• The kurtosis = 1.79997
• The kurtosis excess = –1.20003 III-Statistics of the intensity I III-1-Basic descriptive statistics
• The mean = 269.584
• The median (central value) = 31.7
• The Variance = 842620 III-2-Location Statistics
• The Geometric mean = 38.8341456925116324
• The harmonic mean 13.3765
• The root mean square = 955.217 III-3-Dispersion statistics
• The variation of sample mean = 2856.34
• The standard error of sample mean = 53.4447
• The coefficient of variation = 3.40503
• The mean variation = 375.968
• The median variation 27.12
• Sample range = 8644.82 III-4-Shape statistics
• Skewness = 6.23942
• The Pearson skewness 2 = 0.777447
• The kurtosos = 46.9564
• The kurtosos excess = 43.9564 IV-Antocorrelation of the semi-major axis V-Autocorrelation of the intensity
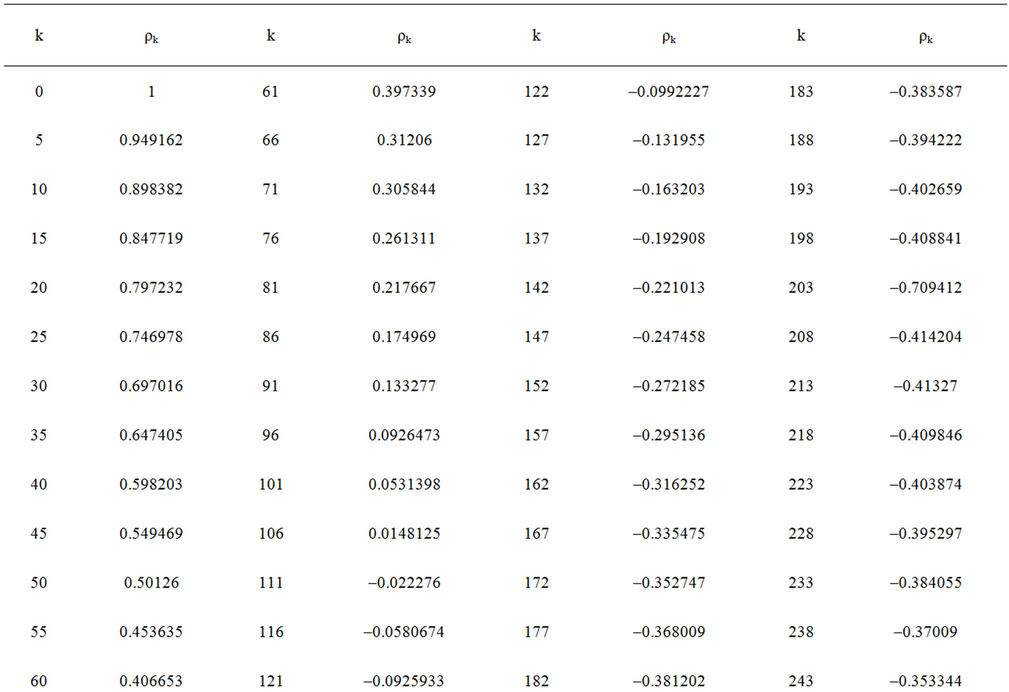

Table 1. Autocorrelation of the semi-major axis.
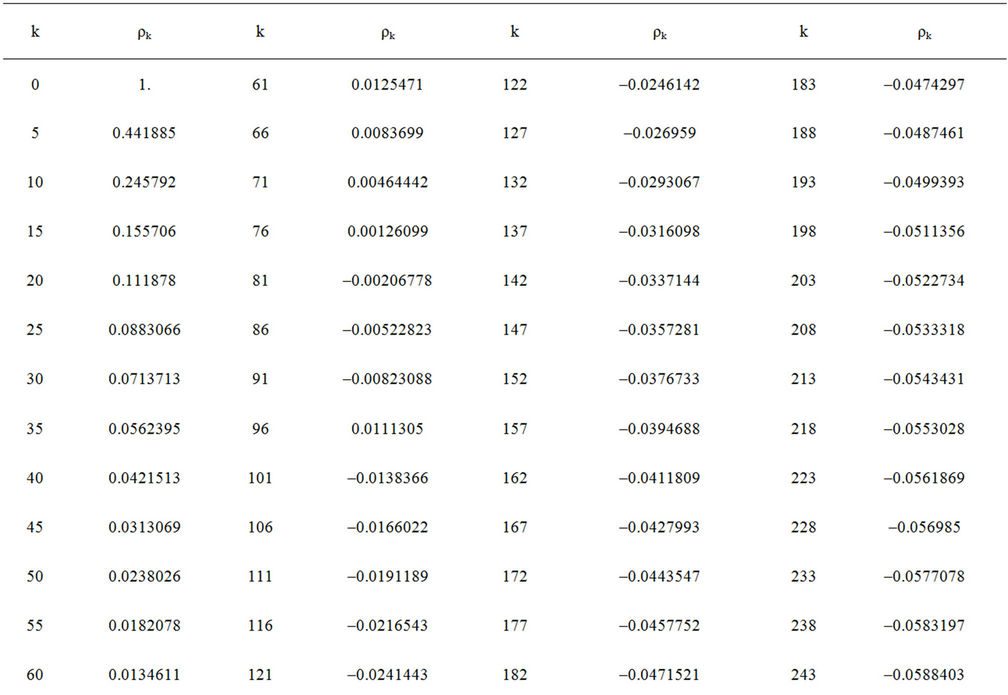
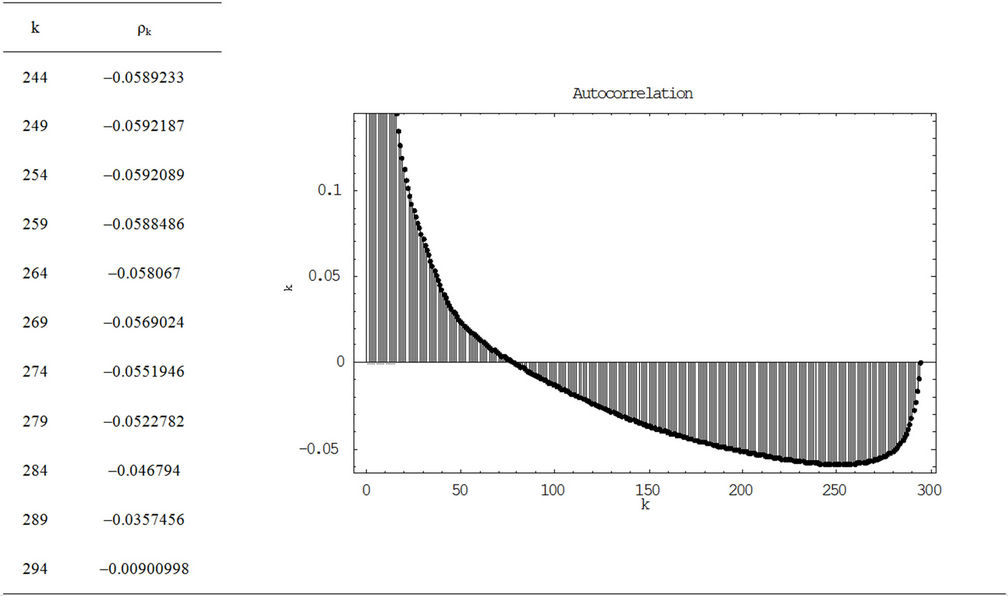
Table 2. Autocorrelation of the intensity.
Appendix B
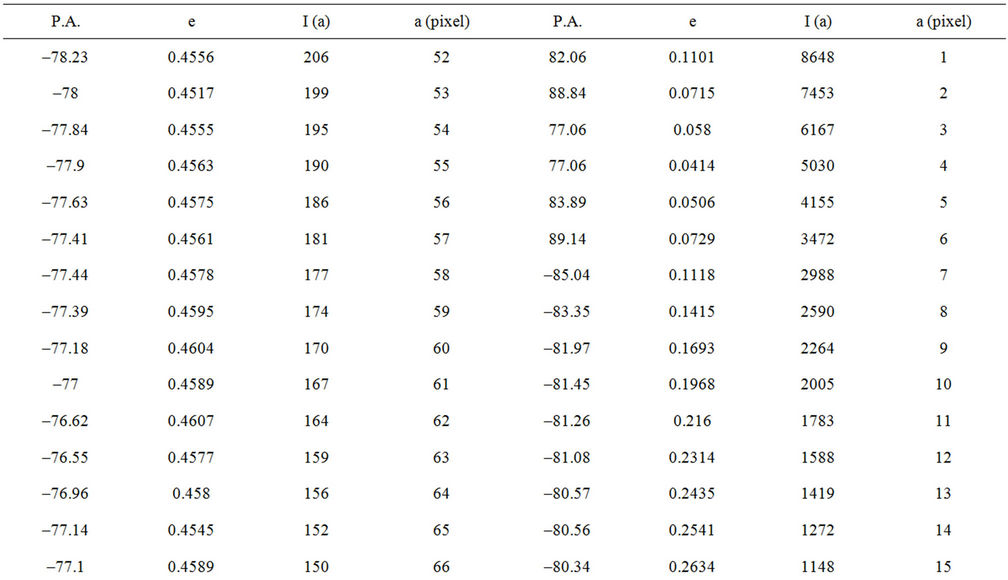

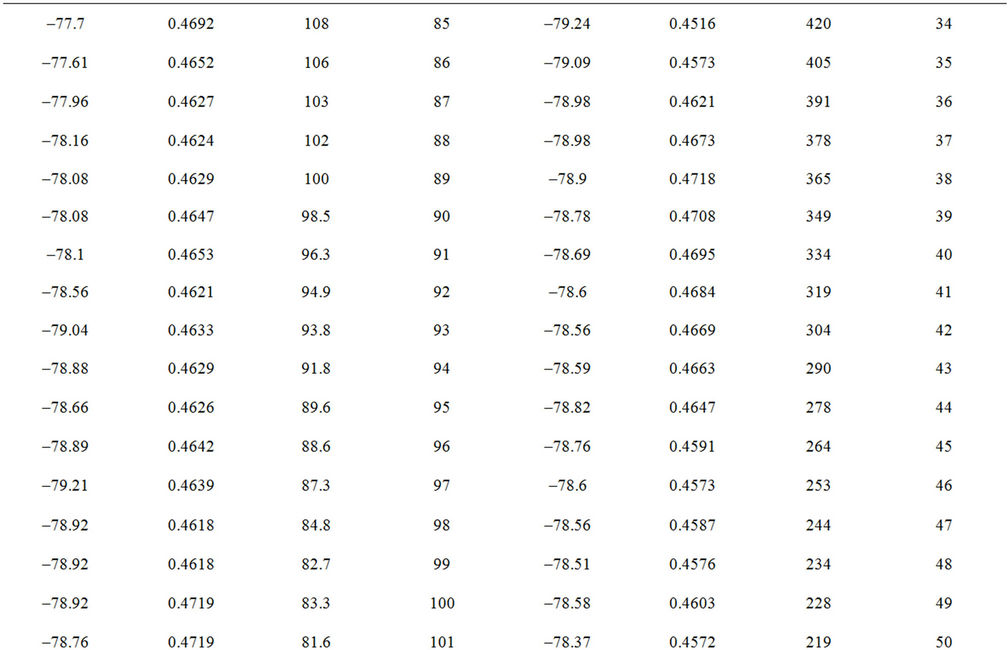


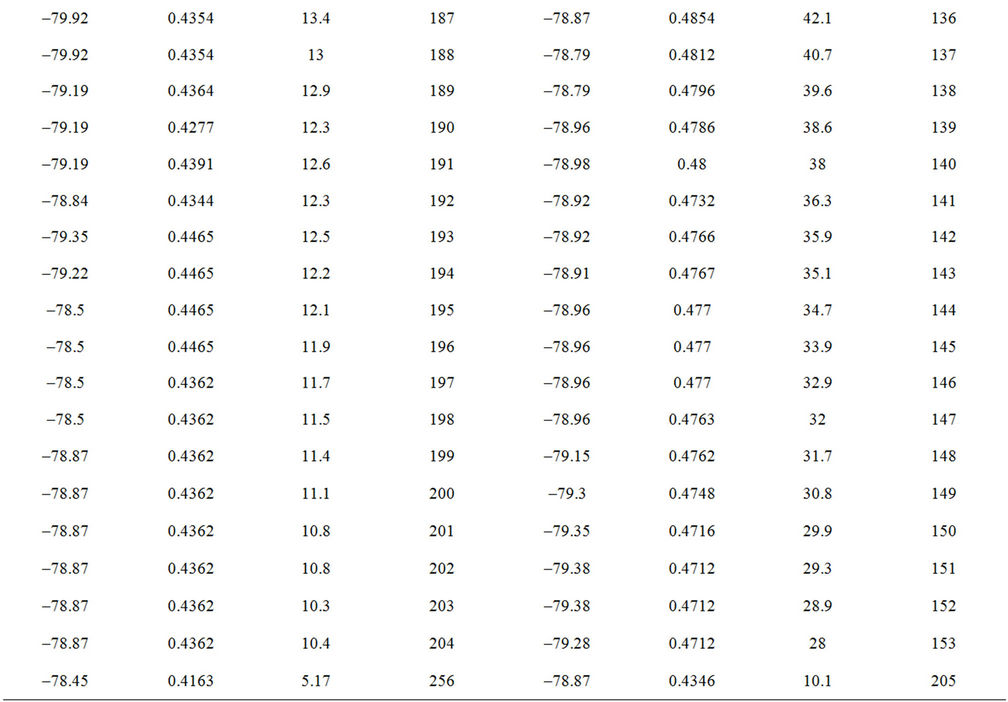
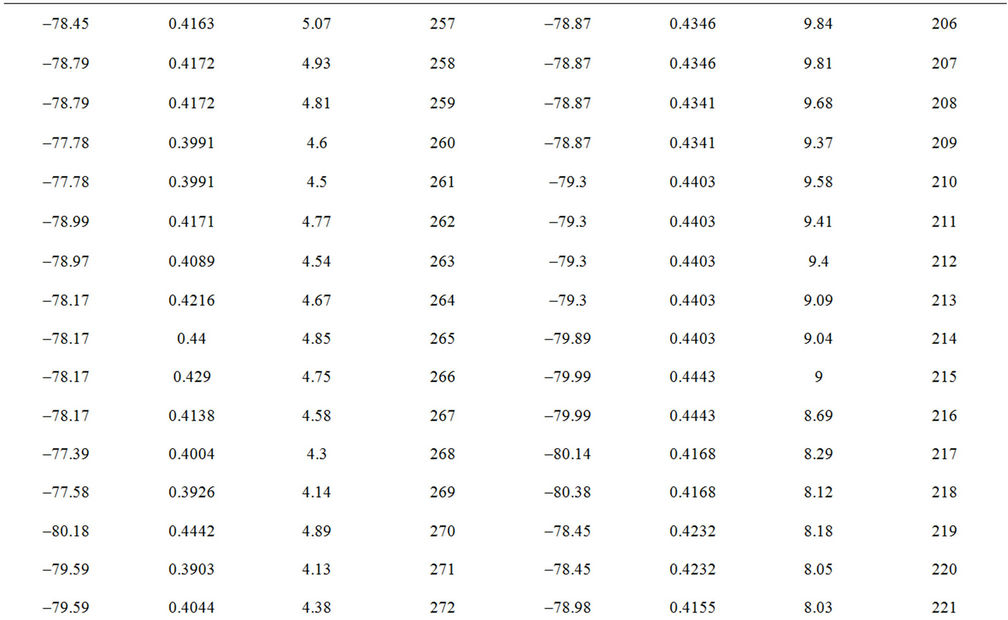
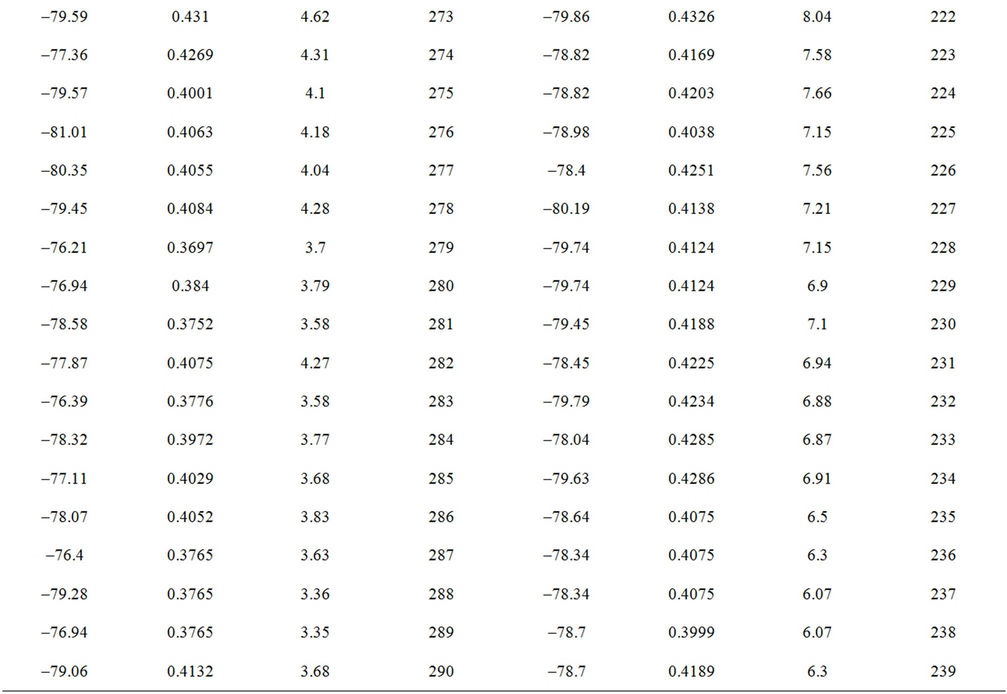
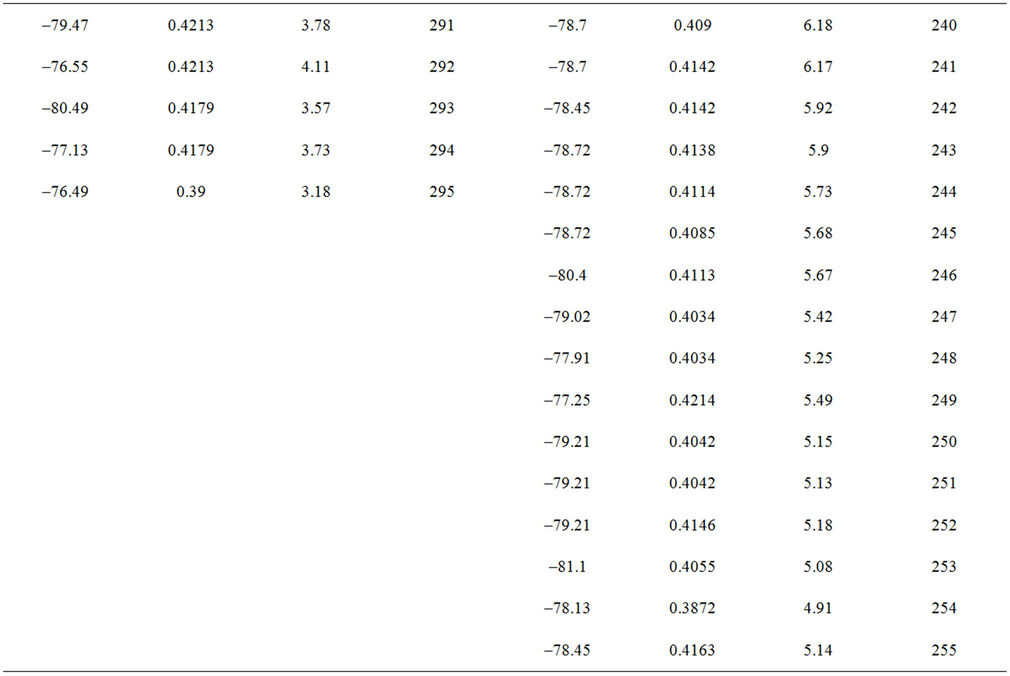
Table I. Data resulted by ELLIPSE task. Shows the Detailed Distribution of the Intensity I, ellipticity e, and Position angle P.A. along the semi-major axis a, as resulted by The IRAF ELLIPSE task. Semi-major axis is described by pixels where 1 pixel = 0.396″ for the SDSS.

