Journal of Diabetes Mellitus
Vol.2 No.3(2012), Article ID:22188,5 pages DOI:10.4236/jdm.2012.23049
Effects of Metformin and Pioglitazone on impaired glucose tolerance patients—An open level prospective study
![]()
1Burdwan Medical College, Burdwan, India; *Corresponding Author: goutameswar09@gmail.com
2Malda Medical College, Malda, India
3Mednipore Medical College, Midnapore, India
Received 9 June 2012; revised 11 July 2012; accepted 23 July 2012
Keywords: Impaired Glucose Tolerance; Metformin; Pioglitazone
ABSTRACT
Introduction: Impaired glucose tolerance (IGT) often leads to type 2 diabetes (T2DM) and macro vascular disease; and usually associated with insulin resistance. Pioglitazone and metformin are commonly used insulin sensitizers (IS); and can prevent or delay the development T2DM and macro vascular disease. This study was deployed to search the better IS between these two in relation to plasma glucose and lipid control; and physical parameter altering effect. Materials and Methods: 100 IGT patients selected randomly from outpatients department following prefixed inclusion and exclusion criteria. Pioglitazone and metformin were administered sequentially. Washout period was 2 weeks. Total follow up period was 24 weeks. Results: 70 IGT patients had completed the study. Metformin had reduced plasma glucose (fasting & postprandial), lipids and physical parameters significantly (p < 0.05) more than Pioglitazone. Discussion: Metformin, a hepatic insulin sensitizer, is more effective than PPAR-ϒ agonist Pioglitazone in the treatment of IGT; and this is due to the expression of PPAR-ϒ is more in adipose tissue but postprandial utilization of plasma glucose is more in muscle tissue.
1. INTRODUCTION
Impaired glucose tolerance (IGT) represents a transient stage [1] of hyperglycemia above the conventional normal range and lower than the level considered for diagnostic of diabetes [2]. It has high risk of developing type 2 diabetesmellitus (T2DM) [3] and arterial disease [4]. It is often associated with insulin resistance (IR) and hyperinsulinemia [1]; and reduction of IR improves glucose metabolism allowing the endogenous insulin to be more effective [5,6]. Treatment of IR at the stage of IGT by life style intervention and/or use of drugs like metformin [7] and thiazolidinedione [5] can prevent the development of type 2 diabetes. It has been postulated that treatment of IR may slow the development of atherosclerosis and macro vascular diseases [6]. Metformin and Pioglitazone are commonly used insulin sensitizers (IS). They facilitate the insulin action in target organs; improve glucose control and some other beneficial effects in relation to the metabolism which has health promoting effect. Therefore a comparative, prospective study had been planed in a same cohort of patients administering metformin and Pioglitazone sequentially with an aim to find out better IS. The objectives of this study were to assess and compare the 1) blood glucose lowering effect 2) lipid modifying effect 3) waist circumference and waist hip ratio altering effect of metformin and Pioglitazone.
2. MATERIALS AND METHODS
This study was conducted in the departmernnt of general medicine, pharmacology and biochemistry of Burdwan medical college, Burdwan, WB in the year 2009 and 2010 for a period of six months. Study design was open level out patient department based randomized self controlled sequential interventional prospective study. 100 IGT adult patients of both sexes having post glucose plasma glucose level between 140 - 199 mg% after 2-hour of taking 75 grams of glucose load with blood insulin level normal or above normal [1] were randomly selected for this study. The exclusion criteria was unable to give written informed consent, renal impairment, hepatic disease, heart failure, lactic acidosis, alcoholics, pregnancy, female subjects planning for pregnancy, subjects having chronic hypoxic lung disease, taking low calorie diet, h/o long standing repeated fasting and receiving medication which can cause hyperglycemia. This study was approved by the institutional ethics committee. Written informed consent was taken from all the subjects prior to the onset of study.
Study parameters: Fasting plasma glucose (fpg), postprandial plasma glucose (pppg), fasting lipid profiles, Body Mass Index, body weight, plasma insulin, Glycosylated hemoglobin (HbA1c),serum glutamic pyruvate transaminase (SGPT), thigh circumference, waist circumference, hip circumference, serum lactic acid, serum pyruvic acid and per capita monthly income.
The adverse reaction of the study drugs were assessed by monitoring for adverse events, changes in vital signs, abnormalities on physical examination, and significant changes in laboratory parameters. Patients were trained and instructed to report symptoms that were suggestive of hypoglycemia. All biochemical laboratory assessments were done at the department of biochemistry, Burdwan medical college.
Study was conducted by following the Helsinki declaration 1975 and Indian Council of Medical research guideline. Subjects were asked to follow the stipulated stable diet and exercise pattern and to maintain these patterns throughout the study. After a period of 4 wks of stipulated diet and exercise fasting and postprandial plasma glucose (fpg & pppg), fasting serum lipid profile, SGPT, lactic acid, pyruvic acid and physical parameters (like waist, hip and thigh circumference) were measured as base line for all these study patients. Then Pioglitazone (pio) was started at a dose of 15 mg/d initially and dose was escalated to 30 mg/d by 2 wks and keeping pio at same dose for 12 weeks all the physical and biochemical parameters were measured. Pio was withdrawn from the patients for two weeks (washout period). Metformin was then started after that washout period at a dose of 850 mg/day and dose was increased up to 850 mg thrice daily (2550 mg/day) after 2 weeks. Then all the parameters were measured after 12 weeks maintaining metformin at the same dose. All the data were collected and analyzed critically.
Statistics: all the data has been presented here in tabular form with mean, standard deviation, and proportion (%) accordingly. Data was analyzed by employing paired t-test and X2—test using spss verson-17 soft ware. p-value ≤ 0.05 had been considered as statistically significant for all cases.
3. RESULT
70 out of 100 study subjects had completed the study. Therefore these 70 study subjects had been considered for analysis. Their demographic profile has been stated in Table 1.
Pioglitazone and metformin had been given to these study subjects sequentially and the observed Effects have been given in Table 2.
Pioglitazone and metformin had reduced both fpg and pppg significantly (p < 0.001) individually from the base line but metformin had reduced fpg and pppg significantly (p < 0.001) more (mean reduction 12.42 ± 4.48 mg/dl 95%CI 10.81 - 14.03 for fpg and mean reduction 17.37 ± 9.23 mg/dl 95%CI 14.19 - 20.54 for pppg) than Pioglitazone. Metformin had reduced the total cholesterol, LDL-c, triglyceride and waist circumference; and raised HDL-c significantly more than Pioglitazone. Reduction of thigh and hip circumference, and waist hip ratio were not statistically significant. Pioglitazone had raised the mean SGPT level significantly (p < 0.001) more than metformin but did not cross the upper limit of normal (40 u/L). Metformin had elevated the serum lactic acid level from base line by 0.12 mg/dl but it was not statistically significant (p = 0.06).
Adverse effects which were observed following administration of Pioglitazone and metformin among 70 IGT study subjects, are given in Table 3.
Flatulence, dyspepsia, distaste, loss of appetite was significantly more with metformin than pioglitazone. But all these sign and symptoms were mild and had disappeared shortly during treatment.
4. DISCUSSION
IGT has a high risk of progressing toT2DM [1]; and is responsible for developing arterial disease [4] and related
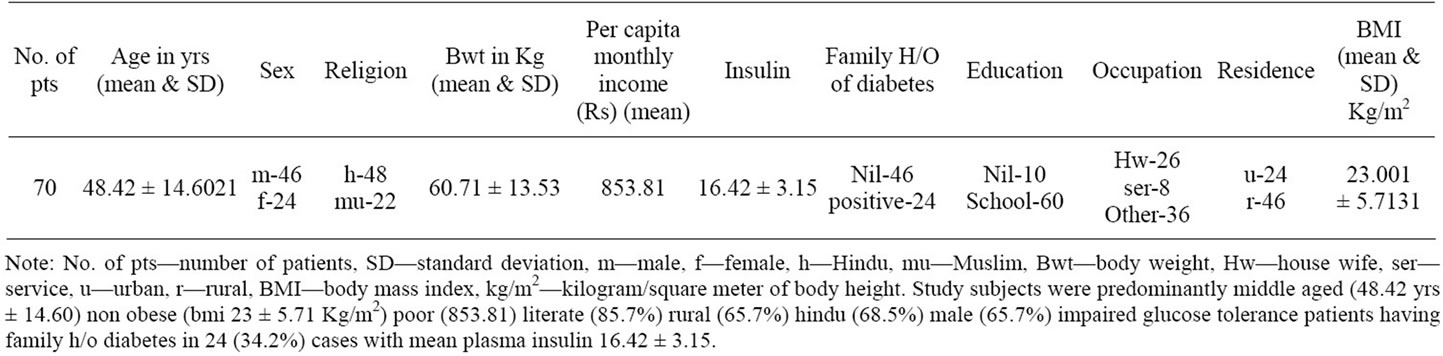
Table 1. Demographic profile of the study subjects.
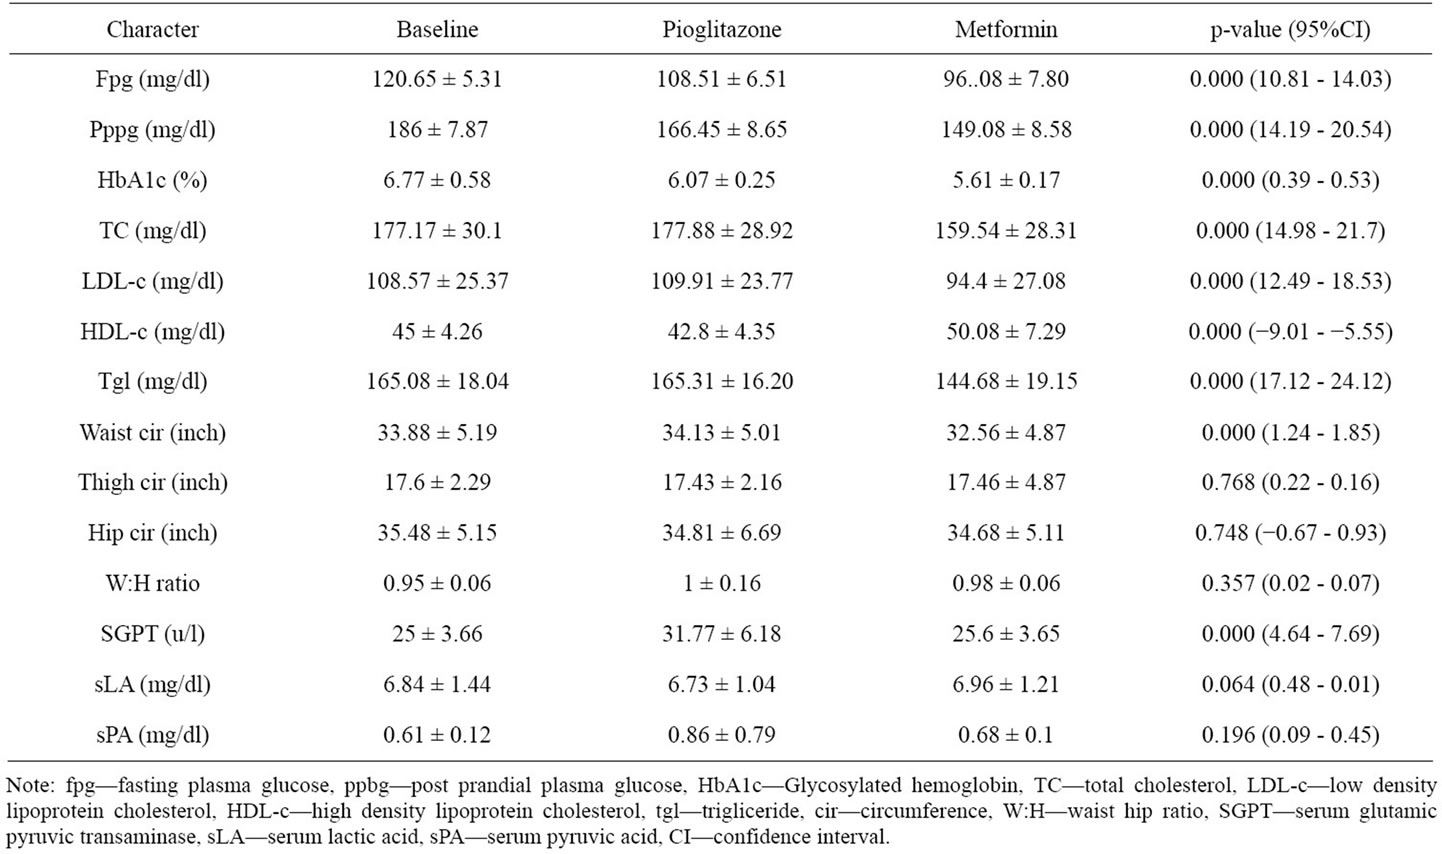
Table 2. Change of values of different parameters from baseline after administration of Pioglitazone and metformin.
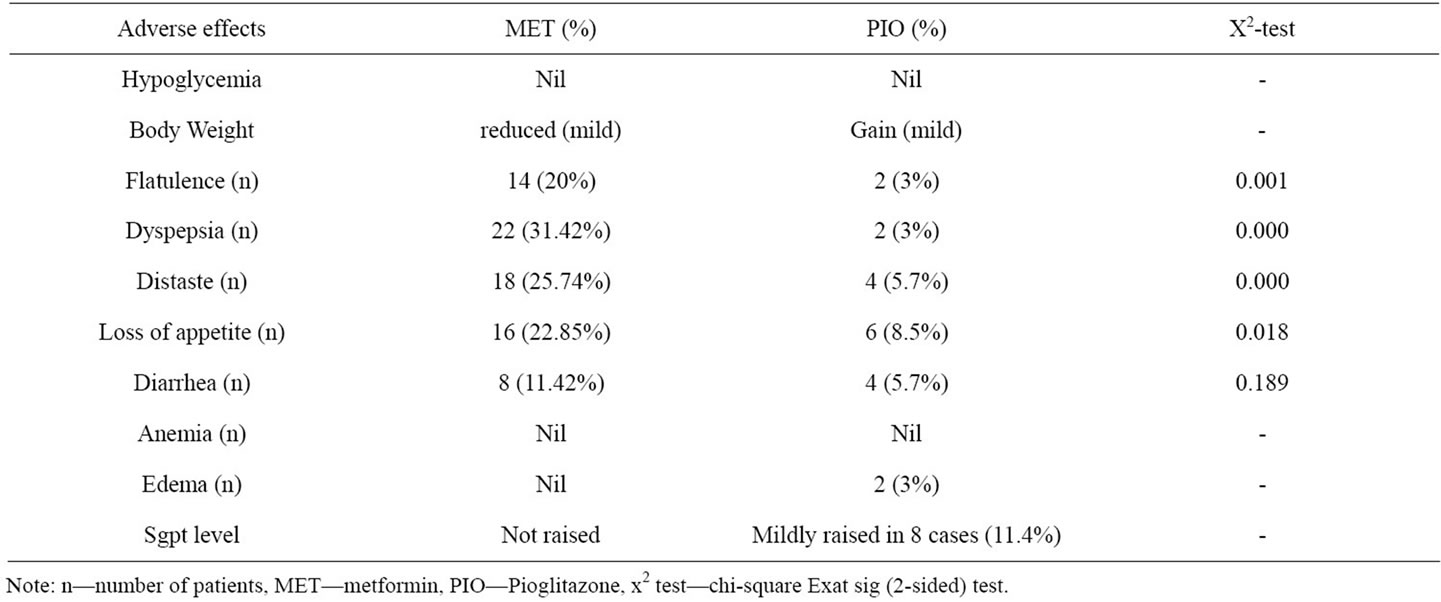
Table 3. The adverse effects following administration of metformin and pioglitazone.
to dyslipidemia. Insulin resistance plays a major role in the development and progression of IGT and T2DM [8,9]. Treatment of IGT prevents or delays the development of T2DM and related complications. IGT is often associated with hyperinsulinemia [1] and elevated concentration of insulin can cause insulin resistance by down regulating insulin receptors and desensitizing post receptor pathways [10]. Suppression of insulin secretion in insulin resistant persons results in increased insulin sensitivity [11]. Initial treatment of IGT is the life style interventions such as exercise, dietary measures, body weight reduction and increased physical activity [8]. But non compliance to it is the great problem. Insulin sensitizes improve insulin resistance, facilitate insulin action, rarely cause hypoglycemia, act in presence of insulin which is not deficient in IGT. Pioglitazone and metformin are two commonly used insulin sensitizers with different pharmaco kinetic and pharmaco dynamic profile. Therefore this study was deployed to compare the glycemic and lipid control effect; and physical parameters altering capacity of metformin and Pioglitazone with an aim to find out better IS.
Study setting was medical out patient department of a rural tertiary care hospital. This was the reason for high (30%) dropout rate, 2 wks interval follow up and male predominance in this study; contrary to the usual female preponderance. The patients had mainly hyperinsuliemia. Some (34.2%) had positive family history of T2DM and it is corroborating with popular belief.
Thiazolidinediones have the greatest efficacy in reducing insulin resistance, metformin is second and AGIs are third [12]. But in this study metformin had reduced fpg, pppg, total cholesterol, LDL-c, triglyceride and waist circumference significantly (p < 0.001) more than Pioglitazone. This is because metformin predominantly suppress hepatic glucose production (hepatic gluconeogenesis), increases insulin sensitivity, enhances skeletal muscle glucose uptake [13] (by phosphorylation of GLUT-4 enhancer factor),increases fatty acid oxidation [12,14,15], decreases glucose absorption from gut, cause GLUT-4 deployment to plasma membrane resulting insulin independent glucose uptake [16]. Where as Pioglitazone act as PPAR-ϒ agonist on adipose tissue, muscle cell and liver; modulate the transcription of insulin responsive genes involved in the control of glucose production, transport and utilization; improve insulin sensitivity [15]. It is not clear whether improvement of IR is a direct effect or indirect to adipokines (adiponectin) effects or combination of both [15]. Again skeletal muscle is the major site for postprandial glucose disposal but PPAR-ϒ is expressed primarily at highest level in adipose tissue [14].
Pioglitazone had raised the mean SGPT level significantly (p < 0.001) more than metformin but did not cross the upper limit of norma l (40 u/L). Metformin had elevated the serum lactic acid level from base line by 0.12 mg/dl but it was not significant (p = 0.06). Minor symptoms like flatulence dyspepsia, loss of apetite, distaste were more with metformin. But all these had disappeared during study period. Again Pioglitazone has the potentiality to produce anemia, bone fracture, weight gain, bladder cancer (animal model in rat) on long term use [15]. Therefore from this study it can be concluded that the metformin is a potentially better option because of improved effectivity in glycemic and lipid control; and favorable safety profile in treating IGT and preventing T2DM.
![]()
![]()
REFERENCES
- Bennett, P.H. and Knowler, W.C. (2010) Definition, diagnosis, and classification of diabetes mellitus and glucose homeostasis. In: Kahn, C.R., King, G.L., Moses, A.C., Weir, G.C., Jacobson, A.M. and Smith, R.J., Eds., Joslin’s Diabetes Mellitus, 14th Edition, Walter Kluwer Pvt. Ltd., New Delhi, 331-339.
- Gavin, J.R., III, Albert, K.G.M.M., Davidson, M.B., et al. (1997) Report of the expert committee on the diagnosis and classification of diabetes mellitus. Diabetes Care, 20, 1183-1197.
- Edelstein, S.L., Knowler, W.C., Bain, R.P., et al. (1997) Predictors of progression from impaired glucose tolerance to NIDDM: An analysis of six prospective studies. Diabetes, 46, 701-710. doi:10.2337/diabetes.46.4.701
- The DECODE Study Group, European Diabetes Epidemiological Group. Diabetes epidemiology: Collaborative analysis of diagnostic criteria in Europe (1999) Glucose tolerance and mortality: Comparison of WHO and American Diabetes association diagnostic criteria. Lancet, 354, 617-621. doi:10.1016/S0140-6736(98)12131-1
- Buchanon, T.A., Xiang, A.H., Peters, R.K., et al. (2001) Protection from type 2 diabetes persists in the TRIPOD cohort eight months after stopping trogitazone. Diabetes, 50, 327.
- Isommaa, B., Almgren, P., Hericson, M., et al. (1999) Chronic complications in patients with slowly progressing autoimmune type 1 diabetes (LADA). Diabetes Care, 22, 137-1353. doi:10.2337/diacare.22.8.1347
- Knowler, W.C., Barret-Connor, E., Fowler, S.E., et al., Diabtes Prevention Program Group (2002) Reduction in the incidence of type 2 diabetes with life style intervention or metformin. The New England Journal of Medicine, 346, 393-403.
- The Diabetes Prevention Progression Research Group (2002) Reduction in the incidence of type 2 diabetes with life style intervention of metformin. The New England Journal of Medicine, 346, 393-403. doi:10.1056/NEJMoa012512
- Groop, L. (2000) Genetics of the metabolic syndrome. British Journal of Nutrition, 83, S39-S48.
- Olefsky, J.M., Revers, R.R., Prince, M., et al. (1985) Insulin resistance in non-insulin dependent (type II) and insulin dependent (type I) diabetes mellitus. Advances in Experimental Medicine and Biology, 189, 176-205.
- Ratzmann, K.P., Ruhnke, R. and Kohnert, K.D. (1983) Effect of pharmacological suppression of insulin secretion on tissue sensitivity to insulin in subjects with moderate obesity. International Journal of Obesity, 7, 453- 458.
- Buse, J.B., Polonsky, K.S. and Burant, C.F. (2008) Type 2 diabetes mellitus. In: Kronenberg, H.M., Melmed, S., Polanski, K.S. and Larsen, P.R., Eds., Williams Textbook of Endocrinology, 11th Edition, Volume 1, Elsevier Inc., Saunders, 1330-1389.
- Long, Y.C. and Zierath, J.R. (2006) AMP—Activated protein kinase signaling in metabolic regulation. Journal of Clinical Investigation, 116, 1776-1783. doi:10.1172/JCI29044
- Powers, A.C. (2011) Diabetes mellitus. In: Longo, D.N., Kasper, D.L., Jameson, J.L., Fauci, A.S., Hauser, S.L. and Loscalzo, J., Eds., Harrison’s Principles of Internal Medicine, 18th Edition, Volume 2, McGraw-Hill Companies, Inc., New York, 2968-3009.
- Powers, A.C. and D’Alessio, D. Endocrine pancreas and pharmacotherapy of diabetes mellitus and hypoglicemia. In: Brunton, L.L., Chabner, B.A. and Knollmann, B.C., Eds., Goodman & Gillman’s the Pharmacological Basis of Therapeutics, 12th Edition, McGraw-Hill Companies, Inc., New York, 1237-1273.
- Musi, N., Hirshman, M.F., Nygren, J. et al. (2002) Metformin increases AMP-activated protein kinase activity in skeletal muscle of subjects with type 2 diabetes. Diabetes, 51, 2074-2081. doi:10.2337/diabetes.51.7.2074