Low Carbon Economy
Vol. 3 No. 3A (2012) , Article ID: 25887 , 4 pages DOI:10.4236/lce.2012.323016
The “District Heating Wall”: A Synergistic Approach to Achieve Affordable Carbon Emission Reductions in Old Terraced Houses
![]()
1Energy Team, AECOM, Edinburgh, UK; 2School of the Built Environment, Heriot-Watt University, Edinburgh, UK; 3Building Engineering Team, AECOM, Edinburgh, UK.
Email: Claire.frost@aecom.com
Received October 31st, 2012; revised December 2nd, 2012; accepted December 10th, 2012
Keywords: CO2 Emissions; Energy Efficiency; District Heating; External Wall Insulation; DHWall; Dynamic Thermal Modelling; Pipe Sizing
ABSTRACT
One effective method to help the UK achieve GHG emission reduction targets is to reduce and decarbonise the heat demand of solid-walled terraced houses, as there are over 2.5 million such buildings making up a significant proportion of the whole building stock. Currently measures are achieved separately: the heat demand could be reduced by application of External Wall Insulation (EWI) or decarbonised through low carbon heat supplied by District Heating Networks (DHN). However, when installed individually, both these technologies face economic cost barriers. This study presents a novel solution that combines district heating pipes into external wall insulation—the District Heating Wall (DHWall) —and provides a systematic and quantitative assessment on its effects on the heating loads and its associated carbon emissions and capital costs. First a dynamic thermal model was developed to predict the heat demand of a case study terraced house with and without EWI. Two district heating networks were then sized to transport the required heat to the house-conventional and DHWall. The DHWall was compared to existing options and initial design parameters calculated. The study found application of EWI reduced space heating demand by 14%. The DHWall could reduce mains pipe inside diameter by 47% and reduce network pipe lengths by 20% and require no civils cost. Together these factors reduced DH capital costs by 76%. For one terraced house, the DHWall saved 34 tonnes of carbon over a 20-year period compared to 8tonnes saved by EWI alone. Such savings were achieved at 39% of the cost/tonne. The mains pipe of the DHWall was calculated to have an inside diameter of 32.6 mm. The minimum insulation thickness required for solid walls to reach U-values of 0.3 W/m2K was calculated to be 120 mm of mineral wool or 65 mm of phenolic foam. The study concludes the DHWall has potential to contribute to GHG emission reductions by increasing market penetration of DH and EWI and should be investigated further.
1. Introduction
Heat for domestic dwellings accounts for 26% of total UK energy demand and over 21% of UK carbon emissions [1]. 91% of dwellings have central heating, with the majority (87% in 2006) gas fired and less than 1% of heat is from renewable sources [2].
There are approximately 2.5 million pre-1919 terraced homes in England, with the majority having solid wall construction [3]. As part of the UK strategy to reduce residential sector emissions by 12% by 2020, the Committee on Climate Change proposed 2 million such homes should be insulated by 2020 [4]. BRE analysis indicates that installing Solid Wall Insulation (SWI) offers the greatest potential savings of all the insulation measures possible for the overall housing stock [5]. SWI can either be applied to the exterior of the property (external wall insulation or EWI) or to the interior of the property (internal wall insulation or IWI). In 2008 there were about 25,000 - 35,000 SWI installations in the UK of which 60% were EWI. Costs of SWI are generally high and this is a significant barrier to wider uptake [6].
Placing insulation on inner side of the walls (internal wall insulation-IWI) blocks heat from reaching the existing wall and so reduces the thermal mass of the construction. In addition, this construction could lead to problems with interstitial condensation, water retention and cold bridging. On the other hand, placing insulation on outer side of the walls (external wall insulation-EWI) maintains the thermal mass of the construction therefore the construction loses heat more slowly. The EWI system can also improve structural integrity and weather-tightness of the building. In addition the internal room dimensions are maintained-important when treating small properties-and there is less disruption to residents during installation [6].
Visual impact issues were found to be a defining characteristic of EWI at a recent major conference on the insulation of Scottish solid masonry walls [6]. EWI could have a positive impact if the original appearance of a property is poor, or would struggle to get planning permission for a listed building in a conservation area.
EWI systems were found to use a range of insulation materials varying in thermal conductivities, from mineral wool with =0.036 W/mK [7] to phenolic foam = 0.02 W/mK [8].
EWI tends to be more expensive than IWI. EWI for an individual mid-terrace house as part of a multiple installation campaign is estimated to cost £5908 [9]. The cost of materials can vary by around 20%, and for EWI materials account for 30% - 40% of total install costs [6]. Additional costs for EWI may include scaffolding, re-siting pipes and moving of wall appendages like satellite dishes.
District Heating (DH)—where heat is produced centrally and hot water is piped to buildings-can improve the efficiency of energy use and provide the flexibility to accommodate heat from a variety of sources such as low carbon biomass and Energy from Waste.
In the UK it achieves only low market penetration: 2% versus Finland (49%) and Denmark (60%). Poyry identified the main economic barrier facing new DH projects in the UK as being high upfront capital costs [1]. For District Heating Network (DHN) development, the civil engineering work required for laying pipes attributes roughly half of these costs. Civils costs include traffic management for closed roads, excavating, backfilling and resurfacing trenches and rerouting of services. If these costs were addressed, and under the correct market conditions, DH in the UK could supply 14% of heat demand [1].
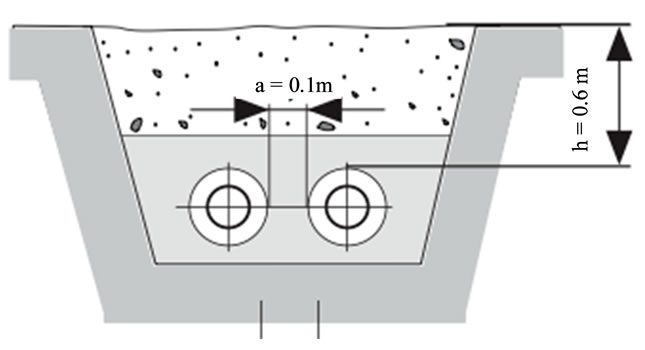
The conventional DH Local Network design for a terraced street would have the mains pipe buried under the road, with individual branches connecting each house [1]. An obvious way of reducing the Civils cost of DHN is to route the mains pipe so that the road is not dug up. This could be achieved by routing pipes through gardens or roof-spaces [1]. However pre-1919 small terraced houses, where the door opens on to the street, don’t have the option of garden-routing and many will require installation of SWI. Instead, the mains pipe could be routed through EWI. This is the concept of the DHWall [10] (Figures 1, 2).
The proposed benefits from the DHWall are:
• Avoided construction work = reductions in capital costs
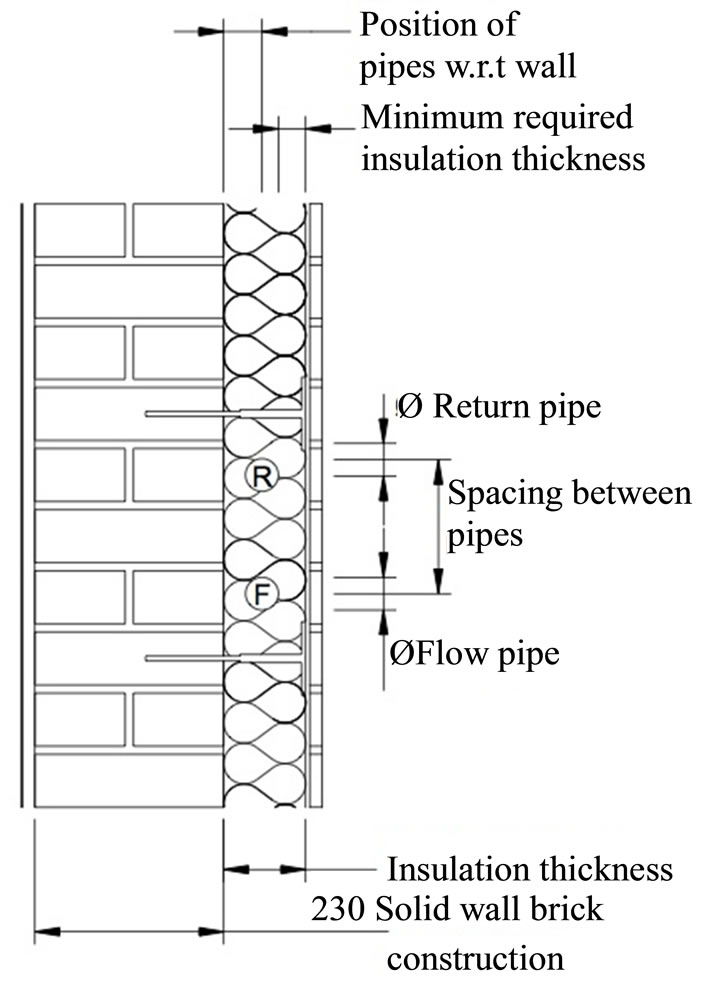
Figure 1. The DHWall concept. Tf = 80˚C and Tf = 55˚C. Mains pipe diameters, i.d. = 32.6 mm. Insulation thickness was 120 mm or 65 mm depending on material.

Figure 2. Peak space heating days for the EXISTING and EWI models.
• Shorter pipework lengths = reductions in capital costs and heat losses.
• Reduced demand = reduced pipe diameters = reduced costs.
• Enables EWI installation.
This project aims to demonstrate the proposed benefits and confirm initial design parameters as well as highlight potential design issues. The methodologies used to develop each model will be accounted in next section. The findings will be discussed then conclusions and recommendations for further work given.
2. Methodology
The methodology includes selection of a study case and development of models to calculate quantitatively the benefits of the DHwall system comparing against the conventional DH approach for that case.
The study case was terraced street in the northern England, a cluster of AECOM’s DH development (Figure 3). Its selection was based following reasons:
• Near to Staffordshire University (an anchor load).
• Reasonable street length.
• Uniform number of terraced houses either side of the street.
• Relatively plain existing façades.
• Obvious dwelling boundaries on OS Map.
The first three reasons can be thought of as DH suitability criterion. It was thought the visual impact of applying EWI to terraces would be less for those terraces that do not have intricate brick facades. Some terrace designs were noted to have passageways from street to back garden, these created unobvious dwelling boundaries on the OS Map. Such a design represents a deviation from the standard terraced house. The last two can therefore be considered to be EWI suitability criterion.
The RockWool BrickShield system was chosen for the wall insulation from a survey due to the following reasons:
• An insulation thickness of 100 mm, the expected minimum thickness is required to treat solid brick walls [7].
• The manufacturer had installed systems in Stoke-onTrent and technical data was available.

Figure 3. Small terraced houses in Stoke-on-Trent, UK.
• The product is faced with brickslips, which could minimise visual impact.
Two models were developed for predicting values for the quantitative comparison:
1) A building thermal model-to quantify heat demand of a terrace with and without EWI.
2) A network model-to find the network requirements to transport the heat to the terrace predicted by the building model.
2.1. The Building Thermal Model to Calculate Heat Loads of the Dwelling
The heat demands in this study included space heating and domestic hot water supply, both are time dependent variables throughout a year and calculation had to include their peak values as well as annual ones. In addition, the model should be able to calculate the effects of embedding hot water pipes into the fabric of the building model, to enable future design of the DHWall should the DHWall concept prove viable. Hence Dynamic thermal modeling-one of the three levels of CIBSE recognised modeling-was used in this exercise [11], and the program was IES-VE-Pro [12].
As a commercially available dynamic modelling software IES-VE-Pro is widely used in both research and commercial design. It treats a building as a multi-zonal system, models all major thermal processes and solves the coupled heat and mass transfer equations with an accuracy that primarily depends on the quality of input data [13]. Hence it allows a “virtual building” to be built which simulates its thermal performance. In addition to the prediction of thermal properties, heating and cooling loads and energy consumptions, it also offers a diverse range of analyses such as the plants efficiency and carbon emissions.
2.1.1. The Geometry of Case Study House
The OS Map gave a dimensioned footprint of the house. The width of 3.7 m was used to classify the house as being a “small” terraced house; having no ground floor hallway. Assuming the house to be built pre-1919, plans for houses that were built in 1900 (Figure 4) were used to determine the internal layout of rooms [14]. Only one house was dynamically simulated but the adjacent terraces were all included in the model so that their influence on solar gains were included in the heat calculation.
2.1.2. Constructions of the External Walls
Two thermal models were created differing only by the constructions assigned to the front external wall. One is the existing conditions (without insulation) whilst the other is after renovation (with insulation on the outer side
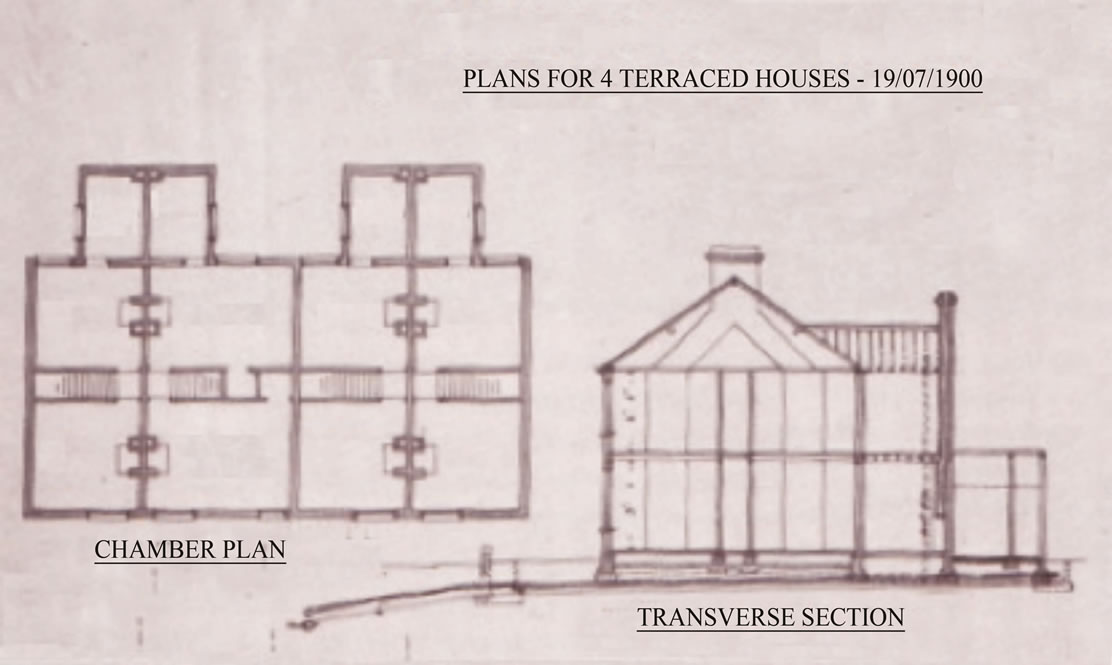
Figure 4. Floor plans and cross-section for four houses built in Norwich in 1900 [14].
of the wall). Table 1 shows an overview of U-values used for the major building elements.
A typical U-value of 2.33 W/m2K for existing external walls was used [15]. The author reports the in-situ Uvalues for existing buildings and compares these to Uvalues calculated by BuildDesk v3.4, where the constructions are based on in-situ thicknesses and thermal conductivity values from BS/EN 12524. The author reveals that in 73% of cases the U-values are over-estimated in the calculating software. Therefore a decision was made to use the in-situ U-value for existing external wall constructions. This was to replicate real life as much as possible (Table 2).
Building Regulations Part L1B states that the improved U-value must achieve 0.30 W/m2K when the area to be renovated is greater than 50% of the surface of that element [16]. The IES model assumes that 100% of the surface area of the front external wall is covered in EWI and so a target U-value of 0.3 W/m2K was used.
The selected insulation slab has a thermal conductivity of 0.036 W/mK. However the BrickShield system uses Rockwool Façade Ultra insulation [17] and it is assumed this has the same thermal conductivity. The insulation thickness was tweaked to obtain the target U-value shown in Table 2.
2.1.3. Other Details
We assumed the building has undergone draft stripping work. Infiltration rates for the EXISTING and EWI models were therefore set to 0.25 ACH, half of the suggested infiltration rate in 2000 Building Regulations.
The standard National Calculation Methodology (NCM) domestic profiles for occupancy, lighting gains and misc
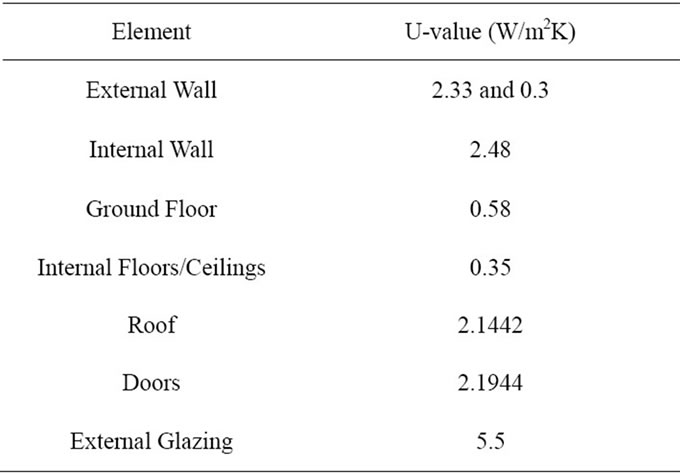
Table 1. U-values assigned to building model constructions.
gains were applied to the relevant rooms.
The heating system, that is the radiator circuit, was set at 90% efficiency. The heating systems were applied to rooms as Table 3. To enable an adequate comparison with a DH supplied Heat Exchanger (HEX) the DHW system had no water storage.
The Fuel and Electricity Order 1980 prohibits the use of fuels or electricity to heat premises above 19˚C [11]. Therefore the internal design temperature was set to 19˚C and Birmingham weather data was used.
2.1.4. Verification of IES Modelling Results
Normally a computer model needs validation to confirm its robustness. Verification was carried out to compare the total annual gas demand, the key output of the sample house with the benchmark data from DECC in (Figure 5), as a full scale validation of this type was difficult.
The total gas demand was calculated using:
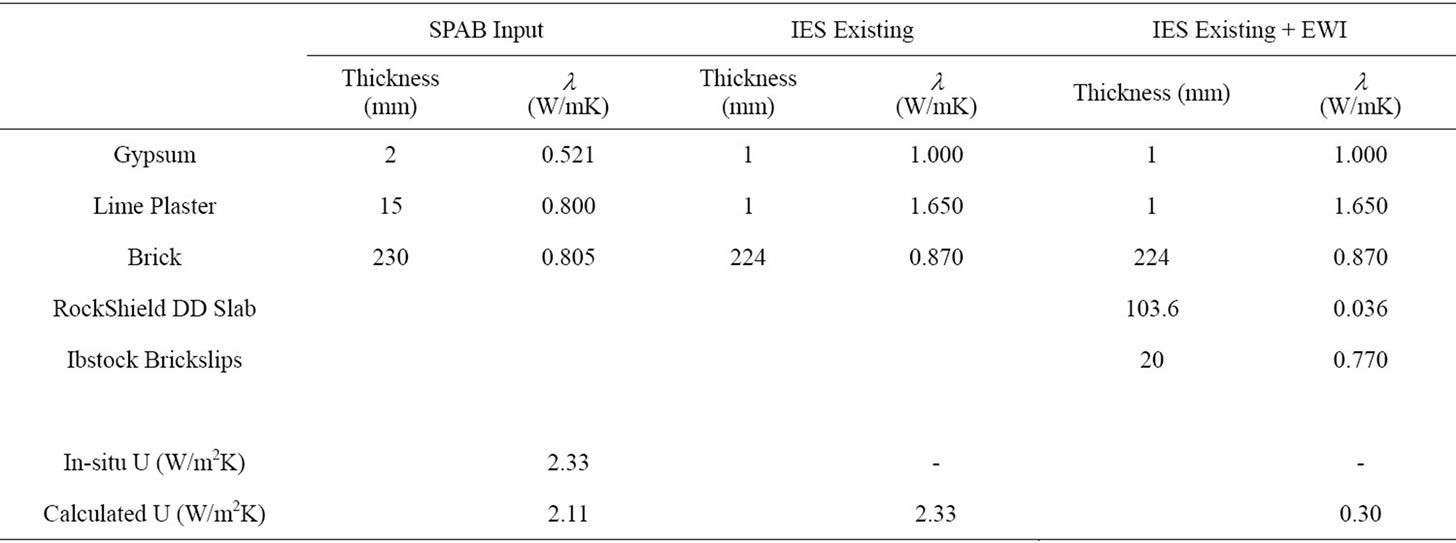
Table 2. U-values used for external walls. The thickness and thermal conductivities were tweaked to obtain overall target Uvalues. For EXISTING model U-value of 2.33 W/m2K from [15] and for EWI model 0.3 W/m2K from [16].
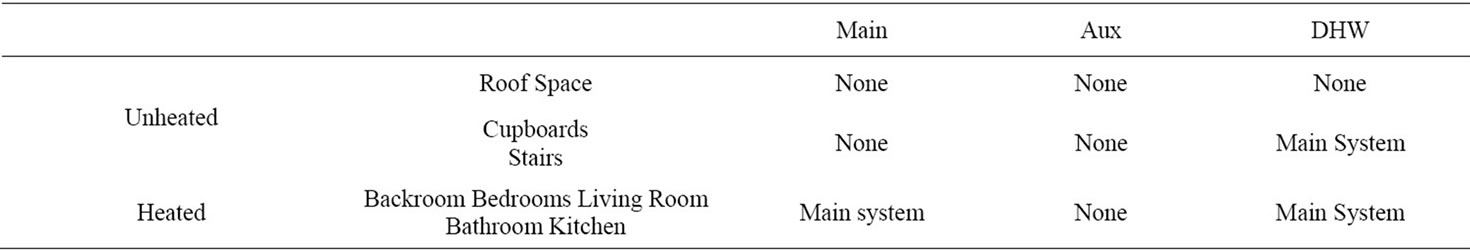
Table 3. Heating systems applied to different spaces (DHW system based on floor area so cupboard and stairs included).

Figure 5. Gas consumption of the EXISTING model compared to LLSOA gas consumption data for the area [22] and UK-wide consumption statistics for houses having similar characteristics [23].
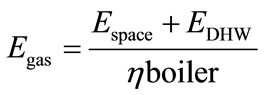 (1)
(1)
The annual efficiency was set to 85%, the average found in a field trial measuring the actual performance of condensing boilers [18].
2.2. The Network Model
2.2.1. Methods to Calculate Heat Loads in DH Design
In district heating, local networks are linked to district networks which may also serve larger buildings. To finding the heat load a DHN is designed to serve, the following steps are to be taken. Geographic Information Systems (GIS) heat maps are used to identify the zones that could be served by local networks. For example DECC’s recently released heat map can be used to identify areas of high heat demand density [19]. The viable heat density threshold is expressed as an average annual power density of 3000 kW/km2 [1,20]. Within those areas anchor loads-those buildings having a high heat demand, and that are key to development of a DHN-are identified. The peak hourly loads (kW) and annual energy use (kWh) for the identified zones are then found. To do this, energy use factors-annual energy consumption factor (kWh/m2) and hourly energy load factor (kW/m2 and floor areas for each land use in the zone are calculated [21]. Energy use factors are locality specific if they are estimated from local consumption data. The average domestic gas consumption is 13,576 kWh for the LLSOA covering the case study area [22].
Historically, annual space and water heating factors for different building types found in tables could then be used to find the energy factors. However the average building type varies in age, building materials and operating characteristics considerably among localities so locality-specific data is the first choice. In addition, energy consumption data of high resolution is now made publicly available by DECC as part of the drive to achieve national energy policy objectives [23].
2.2.2. Network Layouts
Two network layouts were developed for the project: conventional DH (Figure 6) and DHWall (Figure 7). Based on the physical street parameters shown in Table 4 two pipe sizes were designed for:
• the street-pipe-supplying all heat demand of street;
• the house-pipe-serving each individual house.

Figure 6. Conventional DH layout with streetpipe buried under road and housepipes branching off to individual houses. The flow pipe is indicated by red and the return pipe by blue.
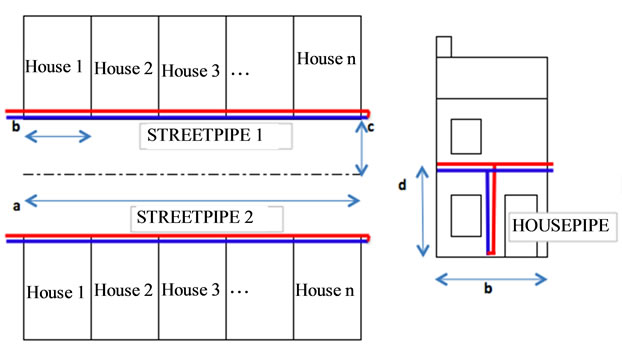
Figure 7. DHWall with streetpipe integrated into EWI and housepipe dropping down to serve individual houses.
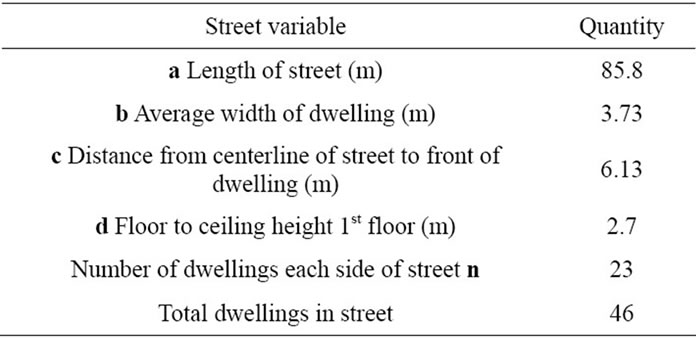
Table 4. Guildford Street characteristics.
2.2.3. Design Peak Load
The following describes the procedure for converting the domestic heat demand to heat required from the network.
Domestic hot water demand is required at different times for different houses. To account for this the standard practice is to apply a diversity factor to the DHW load [21,24]. A diversity formula that works in practice is the Danish diversity factor [25]. For 46 houses the individual house diversified DHW demand is 4.34 kW. However this would only be required for a short amount of time, for example a ten minute shower. As the Heat Exchanger (HEX) prioritises DHW it would be able to cover such loads with little impact on its ability to supply space heat. Therefore the following calculations are done on space heating demand only.
Figure 8 shows full carrying capacity is only required on a few days per year. To design for this load would result in an oversized system. In line with manufacturer’s guidance [26], a smaller peak design load was selected, using a “well-sizing factor” of 80%. Inspection of Figure 8 found this to result in only 20 hours per year of undersupply. Table 5 shows the evolution of the peak space heating demand to the heat required from the network. The peak load for the house was then multiplied by the number of houses to find peak load for a street.
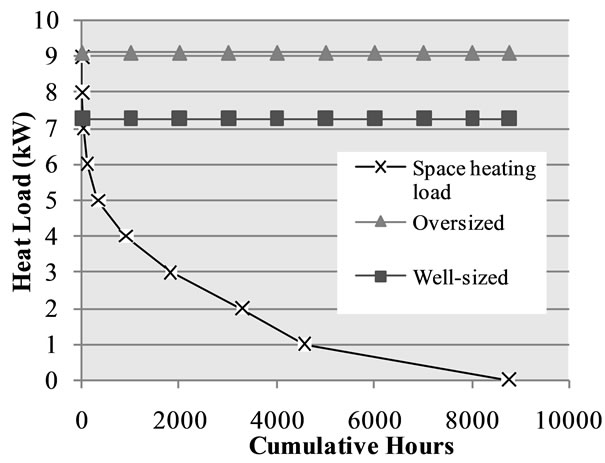
Figure 8. Load duration curve for the EXISTING model (including HEX efficiency). To avoid an over-sized network the peak design load was reduced by the “well-sizing factor”.
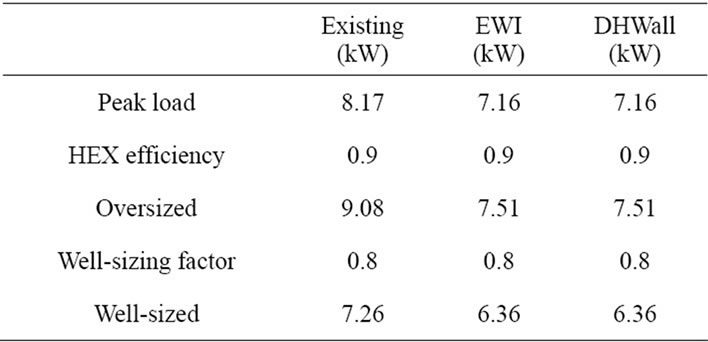
Table 5. Peak design loads for sample house.
2.2.4. Selection of Carrier Pipes
Polymer pipes such as polyethylene (PE-X) and PolyButylene (PB) have the advantage over steel pipes of having no risk of internal or external corrosion. They are also lighter, meaning they would be easier to fix to the front walls of terraces. In addition they have smaller coefficients of roughness, meaning there would be less friction losses. Rehau SDR 11 carrier pipes made of highpressure crosslinked polyethylene (PE-Xa) were therefore selected for the DHWall. The maximum uninsulated pipe diameter was set to 80 mm installed within a 100 mm minimum insulation thickness.
2.2.5. Temperature Drop through HEX
At continuous operating temperatures above 70˚C, the lifetime of Rehau carrier pipes reduces from 50 years [26]. At 80˚C the lifetime is 25 years. As this is a reasonable lifetime, and as the system could be designed to only operate at 80˚C during peak demands, i.e. cold winter days, it would be reasonable to select 80˚C as the flow temperature, Tf, reducing to say 70˚C in summer. More detailed calculations would be required to ascertain the implications of operating at these temperatures. The recommended return temperature for DH is 55˚C [20]. Therefore a temperature drop of 25 ˚C through the household heat exchangers was designed for.
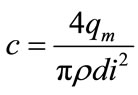
2.2.6. Required Mass Flow Rates in Network
The required mass flow rate of water in house-pipes to deliver (kW) was calculated according to:
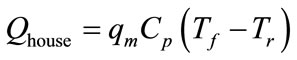 (2)
(2)
where Cp is the specific heat of water. The mass flow rate of water in the streetpipes was calculated using the same method, but replacing with the total street peak load.
2.2.7. Capital Costs
First order cost estimates from PPSL district energy (supplied by AECOM) were used to find capital costs of options. Civils work (£/m) included:
• Excavation and reinstatement per meter of trench.
• Excludes special surfaces, close shoring, dewatering and traffic management.
• Supply and installation (£/m) costs included:
• Supply, delivery, offloading, installation, hydraulic testing, 10% NDT.
• Fittings, site joints, termination seals.
where the PPSL estimate did not include the Rehau pipe size e.g. o.d. 75, the costs were found by linear interpolation.
2.2.8. Pump Power
The input power required to pump the required volumetric flow rate of hot water along a specific pipe was calculated by:
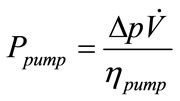 (3)
(3)
where the pump efficiency was set to 70%.
2.2.9. Pipe Sizing Methods
There are no rules concerning pipe sizing [27]. Three methods were investigated by this project, namely Rehau method [26], which determines a pipe size based on the volumetric flow (litre/s), CIBSE method, which selects a pipe based on a minimum diameter from Equation (4), and the Economic Optimum method, which is based on life-cycle costing including pumping costs.
A pipe-sizing tool was created according to CIBSE Guide C Appendix 4.A2 methodology. For the required mass flow the max fluid velocity was approximated using rule of thumb water velocities in CIBSE Guide C Tables 4, 6 and inputted into the following to find:
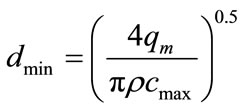 (4)
(4)
dmin was then compared to the internal diameters of the available Rehau pipes, and the next available pipe selected. The actual velocity was found using:
 (5)
(5)
The pipe-sizing tool was checked by inputting values from the CIBSE Guide C pipe sizing example. Once outputted values corresponded exactly the tool was validated.
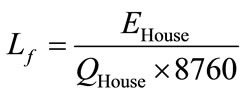
Hence the annual pump energy was calculated to obtain such costs:
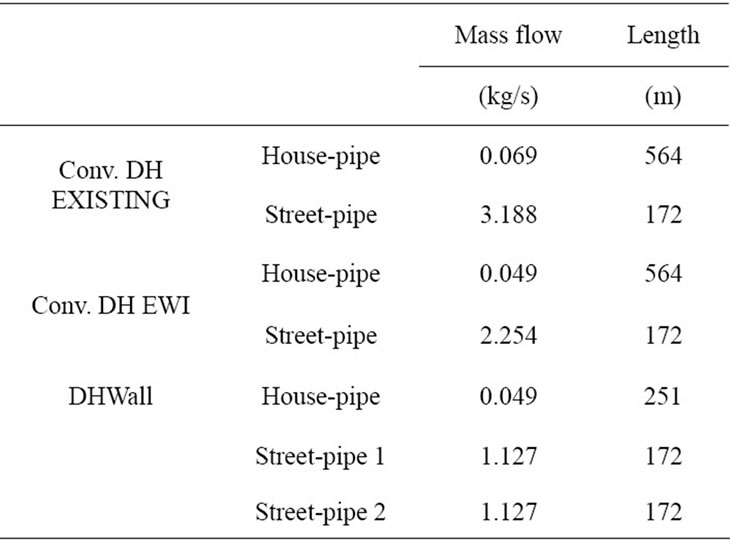
Table 6. Lengths and mass flow rates for network options.
 (6)
(6)
 (7)
(7)
The 25 year life-cycle cost was then calculated using a discount rate of 3.5% and an electricity price of 8 p/kWh, the current wholesale price of electricity at the energy centre.
2.2.10. Heat Losses
Heat losses for the conventional network were based on Rehau heat loss data (kW/m) for their SDR 11 UNO pipes buried in the ground to depths and spacing shown in Figure 9. Their assumed soil temperature was 10˚C and soil conductivity 1.2 W/mK [26].
3. Results of Modelling
3.1. Dynamic Thermal Model
3.1.1. Verification Results
Buildings are complex systems of which the real energy consumption can deviate from predicted by up to 40%
 (a)
(a)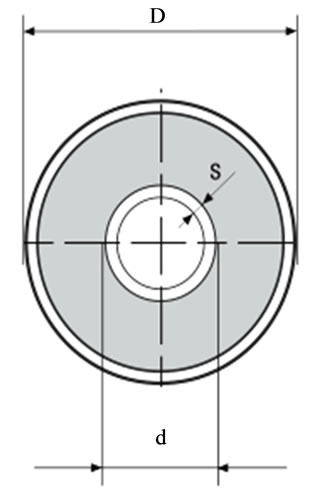 (b)
(b)
Figure 9. (a) Rehau UNO pipe buried in ground where a is spacing and h is depth of pipes. (b) Dimensions of UNO pipe where s and d is thickness and outside diameter respectively of SDR 11 carrier pipe and D is overall diameter of UNO pipe.
[28]. For example a project to compare retrofit fabric improvement options found measured improvements were 72% of predicted [29]. Therefore despite every effort being made to ensure the accuracy of the IES model, actual figures can be expected to deviate from predicted values.
The IES model predicted the gas consumption of 18,914 kWh annually, and this is greater than benchmarks (Figure 5). This means the space heating demand of the model was higher than average, however it was in the correct range. Considering the subsequent treatment of converting to in Table 4, the values used from modelling are probably reasonable for the purposes of this project.
3.1.2. Annual Space Heat Demand Reductions
Figure 10 shows annual heat demand profiles for the sample house. The addition of EWI to the front external wall was found to reduce the annual space heating demand from 14,214 kWh/year to 12,267 kWh/year, a reduction of almost 14%. The domestic hot water demand was relatively constant throughout the year and as expected was independent of the construction of the walls.
3.1.3. Peak Heat Demand Day
The peak heat demand was found to be 8.17 kW for existing walls and 7.16 kW when external wall insulation was applied, a reduction of 12% (Figure 2). The peak demand days occurred at different dates for the different wall constructions. This is thought to be due to the effects of thermal mass. Figure 11 shows heat loss per façade for the existing walls model on the peak demand day (20th Jan).
3.2. Network Model
3.2.1. Parameters of Networks
Equation (1), Figures 6, 7 and Table 4 were used to find initial design parameters for the network options (Table 6) The DHWall reduces total length of pipework by 20%.
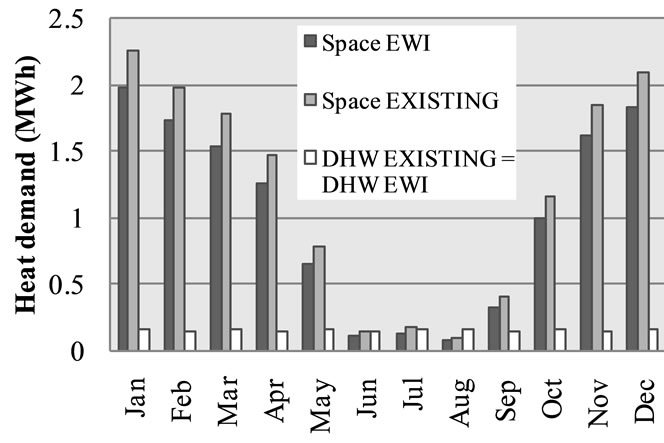
Figure 10. Monthly heat demand of the EXISTING and EWI models.

Figure 11. Heat loss per building façade for the EXISTING model on the peak demand day (20th Jan).
The average load factor of the network options was found to be 25%.
3.2.2. Selection of Pipe Sizes
All three pipe sizing methods found the house-pipe to require the minimum available Rehau carrier pipe diameter, i.e. o.d./i.d. = 25/20.4 mm while sizes calculated for the street-pipe are shown in Table 7.
The economic optimum method is based on pressure losses which do not include minor losses for features like bends and valves, the safest option is to use CIBSE calculated sizes. Subsequent calculations therefore use CIBSE dmin calculated diameters. Application of EWI is shown to reduce i.d. by 84% while the DHWall i.d. is 53% smaller.
Figure 12 graphically illustrates the economic optimization of pump power versus pipe diameter.
3.2.3. Capital Cost of Network Options
Figure 13 shows costs for the entire network. There is a small decrease in overall costs for the EWI option resulting from smaller pipe sizes however there are significant savings for the DHWall resulting from avoided civils costs. There would be a cost associated with fixing the pipe to the house, but if this was say 10% of DH supply and installation there would still be significant cost savings for the DHWall. Further work and collaboration with a EWI contractor is required.
The costs can be alternatively expressed per house. In this way, the capital costs are £7228, £7121 and £1732 for the EXISTING, EWI and DHWALL options respectively.
3.2.4. Heat Losses from Conventional DH
Heat losses for the conventional network flow pipes were calculated for the sample house based on the section of house-pipe and street-pipe serving that house. They were found to be around 750 kWh for the EXISTING case, or
 (a)
(a)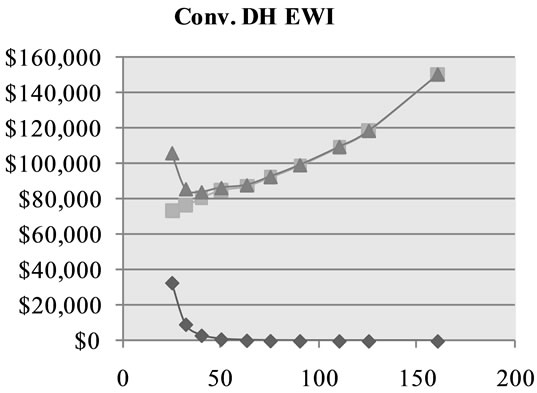 (b)
(b)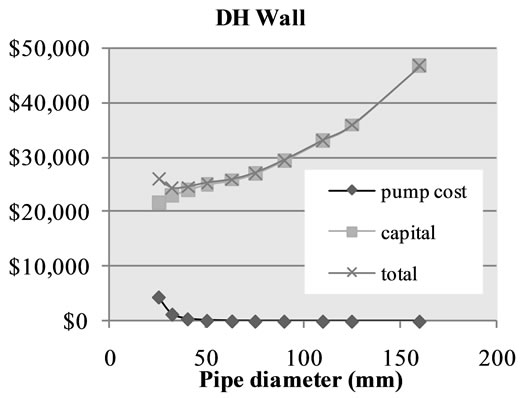 (c)
(c)
Figure 12. Pipe sizing by economic optimum balancing pump energy and capital costs. Capital cost = civils + supply and installation except for DH Wall where capital costs = supply and installation.
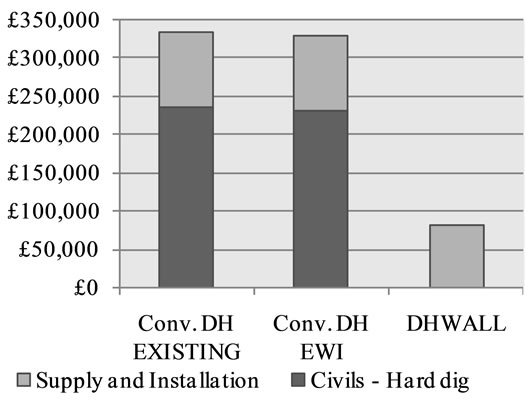
Figure 13. Network capital costs based on CIBSE dmin pipe sizes. EWI reduces capital costs by 1%, while the DHWall reduces costs by 76%.

Table 7. Street-pipe diameters chosen by different methods for the different network options. Shown in o.d./i.d. (mm).
5% of total heat demand and 790 kWh for EWI, or 6% of total heat demand (Figure 14).
The comparatively lower heat losses for the EXISTING case may be considered unexpected as the pipe diameter is larger than the EWI case. However on inspecttion of UNO pipe dimensions [26] and referring to Figure 8 for dimension conventions, both o.d. 75 and o.d. 90 have the same overall diameter D, i.e. o.d. 75 has relatively more insulation thickness than o.d. 90. This accounts for the lower heat losses.
The network is designed for peak loads, and as the load factor is 25% these losses account for 1% - 2% of the peak design load, therefore can be ignored.
3.2.5. Cost Per Tonne of CO2 Saved
An objective of this project is to make the economic case for the DHWall. In light of global efforts to reduce CO2 emissions the following analysis will make the economic case in a carbon saving context.
Figure 15 shows CO2 emission factors for heat supplied to DH vary according to the electricity grid emission factor [30].
In 2009 the CO2 emissions per kWh of electricity consumed were 481.52 g/kWh [31]. Rounding up to 500 g/kWh, an approximate DH emissions factor of 100 g/kWh was obtained from Figure 15 using the “DH supply plus electricity for pumps” category. This category includes [30]:
• Peak boilers supplying 20% of the total.
• Heat losses from the network at 15%.
• Pumping electricity at 1% of the heat delivered.
Using DECC GHG emissions tables Scope 1, the CO2 emissions per kWh for natural gas are 183.22 g/kWh [32].
These factors were used to find CO2 emitted per house for each network option as shown in Table 8. The costs per tonne of CO2 saved over a 20-year period was then calculated.
EWI costs were based on [6]. The value of £5908 for a mid-terraced house was assumed to be for EWI installation to both the front and back wall. As this project only considers the front wall the cost was approximated to £3000.
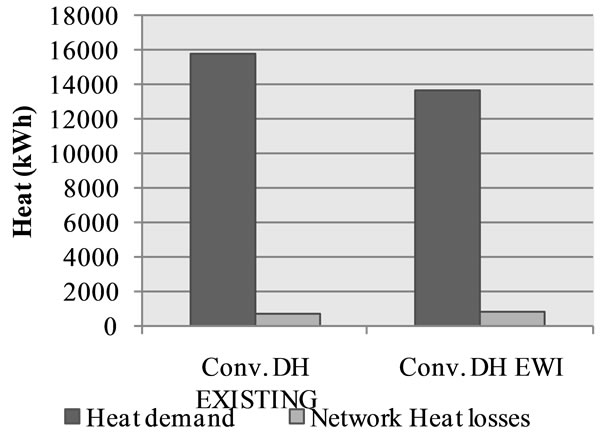
Figure 14. Annual heat demand (including HEX efficiency) and heat losses from conventional DHN for EXISTING and EWI models.
The DHWall is shown to offer the least expensive method of saving CO2; to achieve the same amount of lifecycle carbon savings the DHWall cost is £139/tonne while EWI is £357/tonne, a reduction of 61%. However there will be a small cost for integrating pipes into EWI.
4. Discussion
4.1. Suitability of Terraces
As highlighted earlier certain terraced streets would be more suitable for the DHWall than others, depending both on DH criteria and EWI criteria.
The EWI criterion is dependent mainly on visual impact [6]. However in addition there are structural features of the house. Issues here include integration at the eaves area-houses with larger overhanging roofs would be able to accept EWI more readily. In addition windows may need to re-positioned to sit in line with EWI to maintain thermal continuity [29]. These issues could be discussed with EWI professionals.
4.2. DHWall Design Parameters
EWI insulation materials range in conductivities from mineral wool with =0.036 W/mK to phenolic foam = 0.02 W/mK. This corresponds to a variation in insulation thickness in which to place the pipes. As this is an important parameter for the DHWall a U-value tool was developed to include and to find this range [32].
When upgrading existing buildings, BS EN ISO 6946:2006 recommends that a correction due to air gaps of 0.01 W/m2K is added. In addition, a correction for mechanical fasteners (e.g. BrickShield insulating anchors) is required. For this a value of 0.18 W/m2K was arrived at based on an assumed value of five fasteners per square metre. Applying these corrections and including a 2 mm 0.9 W/mK BrickShield Adhesive layer the minimum insulation thickness required to achieve a U-value of 0.3
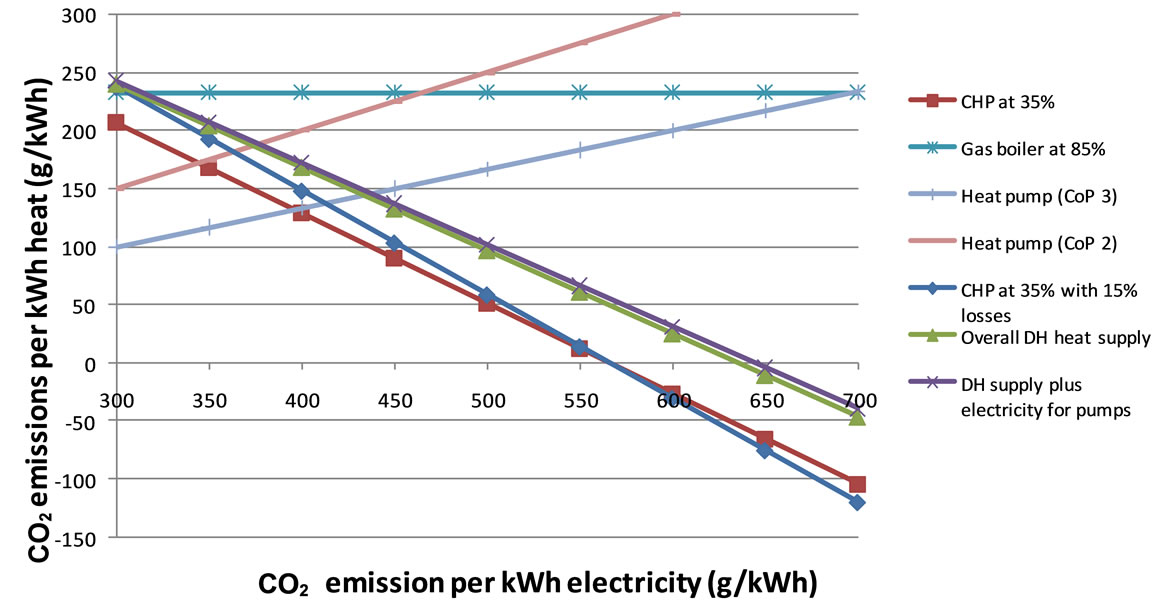
Figure 15. Variation of heat emissions factor for various heat sources [30].

Table 8. Costs of carbon savings for different options per dwelling.
W/m2K could be calculated.
The minimum mineral wool insulation slab thickness was found to be 114 mm, rounded up to 120 mm in commercially available sizing (Figure 16). Using the same method the minimum insulation thickness required when using phenolic foam was found to be 65 mm.
Rockwool literature states that for 225 mm solid brick walls (with internal plaster) to achieve an overall U-value of 0.3 W/m2K, the required RockShield thickness is 100 mm. However it uses a U-value of 2.1 W/m2K for the existing walls [7]. This report used a more realistic and conservative value of 2.33 W/m2K taken from in-situ measurements [15].
To achieve a U-value of 2.1 W/m2K for existing walls the U-value tool found the brick thickness to be 265 mm. The required mineral wool insulation thickness for a 265 mm solid wall with internal plaster was then calculated to
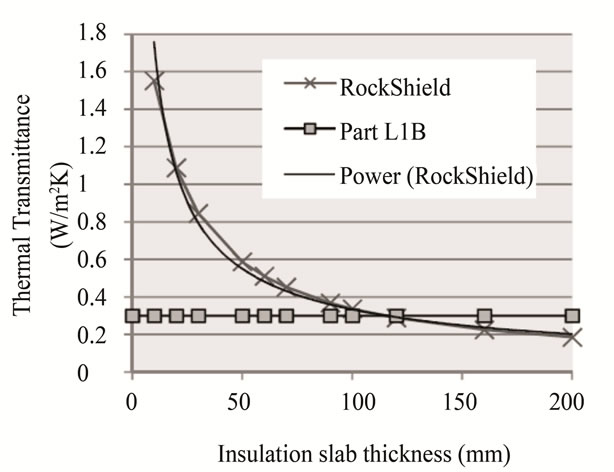
Figure 16. Overall U-value of 225 mm solid brick wall achieved when RockWool insulation system is applied (including corrections for mechanical fasteners and air gaps). The minimum insulation slab thickness (in commercially available sizing) was found to be 120 mm.
be 113 mm. The U-value tool shows that when the brick (including mortar joints) thickness is increased by 40 mm, the insulation thickness required to maintain the same overall U-value is reduced by only 1 mm.
On inspection of the U-value tool, a U-value of 0.3 W/m2K was achieved with 100 mm mineral wool if corrections for mechanical fasteners and air gaps were not included. This appears to be the basis on which RockWool make their claim.
4.3. Minimum Pipe Size
The study has established that the theoretical optimum DHWall street-pipe diameter for an average terraced street in terms of cost is 32 mm. In practice a street-pipe of 40 mm would probably be used, reducing one size towards the end of the street on account of the reduced flow rates.
The calculations used to obtain these values didn’t take account of minor pressure losses nor the pressure drop in last house-pipe.
These internal diameters are considerably less than the expected maximum diameter of 80 mm. Combined with the finding that the minimum insulation thickness is 120 mm, the DHWall concept is perhaps more viable than originally envisaged and certainly warrants further investigation.
4.4. Further Work
Further work should begin by addressing uncertainties and assumptions in the methodology previously highlighted to confirm the initial design parameters.
4.4.1. Heat Losses from DHWall
Heat losses from pipes in the DHWall were not investigated in this project. The main issue in this regard is thought to be thermal stresses in the EWI render system. On a cold day, the outside surface would perhaps be 0˚C while the temperature at the inside surface of the pipe would be 80˚C. The insulation thickness, tmin between the pipe and the render system would have to be such that the temperature gradient between the inside and outside of the render system is minimized. Or tmin would be the minimum thickness of insulation that is required to maintain satisfactory heat losses from the pipes to the external environment. tmin would be the smallest value.
The critical location for tmin would be the point where the house-pipe drops down from the horizontal mains (street-pipe) to enter the house. This is because one housepipe would have to cross one of the horizontal mains increasing the thickness of insulation occupied by the pipe to 25 + 32 = 57 mm or 25 + 40 = 65 mm depending on the size of the mains pipe. If the insulation used was phenolic foam with a thickness of 65 mm this presents a major issue, as tmin is unlikely to be smaller than 25 mm. However using mineral wool with an insulation thickness of 120 mm would be more acceptable.
One solution to this problem would be accommodating the section in an EWI “bulge” similar to the surface feature shown in Figure 17. An alternative approach would be to change the mechanical properties of the render system to be able to withstand more thermal stress. Investigations in these areas require input from EWI professionals.
Heat losses in the vertical direction are thought to be nil due to almost infinite insulation. Heat losses into the building could even be beneficial by reducing demand, albeit slightly. The U-value tool has shown that heat flow through a brick and mortar construction is 40 times greater than a mineral wool construction. Therefore the effects of temperature gradients at the interior wall surface should also be considered. This could influence the ideal placement of pipes relative to the building. Such heat losses could be investigated using the IES model.
Energyflo is a EWI system that purposefully has air channels between the insulation panel and the existing wall to enable the wall to act as a heat exchanger. The integration of pipes into a similar system could be considered [33].
4.4.2. Entry Point of House
It is assumed the house-pipe would enter the house at ground-level. It would then have the same issues as a conventional DH network with routing through the house to the HEX. However an entry point at the first floor level could be considered. Reduced pipe lengths would reduce costs, and there would not be the issue of housepipe crossing over mains pipe.
4.4.3. Assembly of DHWall
Carrier pipes come transported to site in coils. As this is a convenient method of transporting materials it is
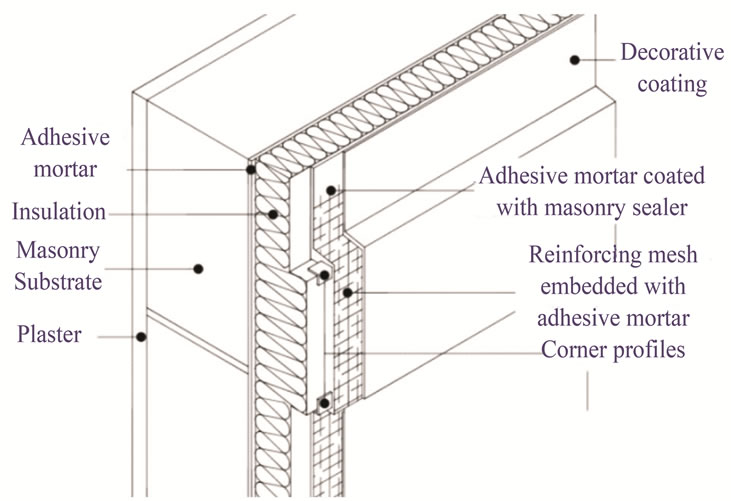
Figure 17. EWI surface feature [34].
assumed the DHWall system would be assembled onsite. Further work should investigate how this would proceed and how pipes would be supported. For example pipes could be supported by wall-mounted brackets, and insulation applied around them. The insulation panels could come to site pre-grooved to accept the pipe. Collaboration with a EWI manufacturer would be needed.
4.4.4. Cost of Integration with EWI
The study assumes there is no capital cost associated with integrating DH pipes into EWI, which could overestimate carbon cost savings. Collaboration with EWI contractors and further development of the concept are required to ascertain these.
5. Conclusions
This project aimed to demonstrate the proposed benefits, confirm initial design parameters and highlight potential design issues of the DHWall concept.
Through development of a reasonably accurate dynamic model of an English terraced house the study found application of EWI to the front wall reduced annual space heating demand by 14%. This reduced the required pipe i.d. of a conventional DH network street-pipe by 16%. This reduced DH capital costs by only 1%.
Through virtue of the fact that one DHWall mains pipe serves only one side of a street, the pipe inside diameter is reduced by 47%. A local DHWall network requires 20% less pipe length due to the shorter branch lengths. A DHWall mains pipe does not require the street to be dug up. Together, these factors reduce DH capital costs by 76%. For the heat demand of one house over a 20-year period, the DHWall saves 34 tonnes of carbon while EWI alone saves 8 tonnes. The DHWall achieves these savings at 39% of the cost/tonne saved.
The minimum insulation thickness required for solid walls to reach U-values of 0.3 W/m2K was calculated to be 120 mm of mineral wool or 65 mm of phenolic foam. The mains pipe of the DHWall was calculated to have an inside diameter of 32.6 mm using the CIBSE dmin method, while the theoretical economic minimum was i.d. 26.2 mm. These parameters make the concept very viable and it should be investigated further.
Further work would first confirm the initial design parameters found in this report. Then detailed designs should be developed focusing on issues such as temperature gradients in the EWI render system, entry of branch pipes into the house, DHWall assembly and support. This work should be carried out with input from EWI specialists.
REFERENCES
- Pöyry Energy Consulting, and Faber Maunsell AECOM, “The Potential and Costs of District Heating Networks,” Department of Energy and Climate Change, London, 2009.
- J. I. Utley and D. T. Shollock, “Domestic Energy Fact File 2008,” Department of Energy and Climate Change, BRE, Watford, 2008.
- Communities and Local Government (CLG), “English House Condition Survey (EHCS) 2007: Annual Report,” Communities and Local Government, London, 2009. http://www.communities.gov.uk/documents/statistics/pdf/1346262.pdf.
- Committee on Climate Change (CCC), “The Fourth Carbon Budget,” 2010. www.theccc.org.uk/carbon-budgets/4th-carbon-budget-path-to-2030
- Energy Saving Trust (EST), “UK Domestic Solid Wall Insulation: Sector Profile,” 2008. www.purplemr.co.uk
- Changeworks, “Solid Wall Insulation in Scotland: Exploring Barriers, Solutions and New Approaches,” 2012. http://www.changeworks.org.uk/
- Rockwool, “Rockwool RockShield Data Sheet,” 2011. guide.rockwool.ie/products/building-insulation/rockshield.aspx
- Wetherby “External Wall Insulation—Refurbishment/System Components/Insulants,” 2012. www.wbs-ltd.co.uk/refurb_components_insulants.htm
- DECC, “Green Deal Consultation,” 2011. www.decc.gov.uk/en/content/cms/consultations/green_deal
- P. S. Woods, “Proposal Submitted for Implementing Agreement on District Heating and Cooling including CHP Call for Proposals for Annex X,” International Energy Agency, 2010.
- CIBSE, “CIBSE Guide A: Environmental Design,” The Chartered Instituation of Building Services Egnineers (CIBSE), Norwich, 2006.
- IES, “VE-Pro” 2012. www.iesve.com/software/ve-pro
- A. H. Abdullah and F. Wang, “Design and Low Energy Ventilation Solutions for Atria in the Tropics,” Sustainable Cities and Society, Vol. 2, No. 1, 2012, pp. 8-28. doi:10.1016/j.scs.2011.09.002
- S. Muthesius, “The Englsih Terraced House,” Yale University Press, New Haven, 1982.
- D. C. Rye, “The SPAB Research Report 1: U-Value Report,” Society for the Protection of Ancient Buildings, London, 2011.
- H. M. Government “The Building Regulations 2000, Conservation of Fuel and Power, L1B: Conservation of Fuel and Power in Exisiting Dwellings,” 2010.
- Rockwool, “An Introduction to Part L-U-Values,” Rockwool, London, 2010.
- Energy Saving Trust, (EST), “Final Report: In-Situ Monitoring of Efficiencies of Condensing Boilers and Use of Secondary Heating,” 2009. www.decc.org.uk
- DECC “About the National Heat Map,” 2012. ceo.decc.gov.uk/en/ceol/cms/heatmap/about_map/about_map.aspx
- Arup, “Decentralised Energy Masterplanning, A Manual for Local Authorities. Report for Dept. of Energy and Climate Change,” 2011. www.chpa.co.uk/medialibrary/2012/01/05/46ccc22e/DENet_manual_lo_v1%200.pdf
- International District Heating Association (IDHA), “District Heating Handbook: A Design Guide,” International District Heating Association, Washington, 1983.
- DECC, “Lower Layer Super Output Area (LLSOA) Domestic Gas Estimates 2010: Look-Up Spreadsheets,” 2012. www.decc.gov.uk
- DECC, “Sub-National Energy Consumption Statistics,” 2012. http://www.decc.gov.uk/en/content/cms/statistics/energy_stats/regional/regional.aspx
- Rehau, “District Heating and Heat Networks: CPD Presentation,” 2012. www.rehau.co.uk.
- Dansk Standard, “DS 439:2009, Norm for Vandinstallationerm (English: Code of Practice for Domestic Water Supply Installations),” Danish Standards, Copenhagen, 2009.
- Rehau, “RAUTHERMEX: Technical and Installation Manual 817600 EN,” Rehau, London, 2011.
- CIBSE, “CIBSE Guide C: Reference Data,” Chartered Institution of Building Services Engineers, London, 2007.
- M. H. Trcka and J. L. M. Hensen, “Overview of HVAC System Simulation,” Automation in Construction, Vol. 19, No. 2, 2010, pp. 93-99. doi:10.1016/j.autcon.2009.11.019
- Joseph Rowntree Foundation, “Temple Avenue Project: Energy Efficient Refurbished Homes for the 21st Century,” Richards Partington Architects, London, 2012.
- P. S. Woods and G. Zdaniuk, “CHP and District Heating—How Efficient Are These Technologies?” CIBSE Technical Symposium, De Montfort University, Leicester, 2011.
- D. Defra, “2011 Guidelines to Defra/DECC’s GHG Conversion Factors for Company Reporting,” AEA for DECC, London, 2011.
- S. M. Doran and L. Kosmina, “Examples of U-Value Calculations Using BS EN ISO 6946:1997,” BRE, East Kilbride, 1999.
- Energyflo, “Dynamic Insulation,” 2012. http://www.energyflo.co.uk/
- Rockwool, “CAD Library,” 2012. http://guide.rockwool.co.uk/tools/cad-library.aspx
Nomenclature
