International Journal of Geosciences
Vol.07 No.03(2016), Article ID:64825,10 pages
10.4236/ijg.2016.73025
GIS Based Spatial and Temporal Analysis of Crimes, a Case Study of Mardan City, Pakistan
Pukhtoon Yar1, Jamal Nasir2
1College of Territorial Resources and Tourism, Anhui Normal University, Wuhu, China
2Department of Geography, University of Peshawar, Peshawar, Pakistan

Copyright © 2016 by authors and Scientific Research Publishing Inc.
This work is licensed under the Creative Commons Attribution International License (CC BY).
http://creativecommons.org/licenses/by/4.0/


Received 3 February 2016; accepted 19 March 2016; published 22 March 2016
ABSTRACT
This paper is aimed to study the crime with special reference to its spatial and temporal distribution. It also tries to analyze and estimates the impact of weather on the prevalence of criminal activity in Mardan City. Studying the crimes with reference to its spatial and temporal distribution is important because information about the occurrence of crime is one of the most crucial tools in combating crime. It allows understanding how crimes are distributed through space, and hence can help in combating them. The Geographical Information System is an important tool for dealing with spatial and temporal analysis and thus fighting crime. The advent of desktop computers has significantly increased the role of computer mapping. The availability of user-friendly GIS applications has further increased the use of GIS in crime mapping. For the present study the data was collected about homicide and aggressive assaults from all the three police stations covering Mardan City. The collected data was analyzed under different scenarios. The temporal based analysis of data reveals that almost 50% crimes reported in 2009, took place from May-September (summer) compared to 32% in winter (October to February). The spatial analysis of data reveals 05 hotspots. Sikindary area was identified as the most crucial hotspot where within a 05 km radius, 11 crimes were committed in 2009 followed by Kalpani Bridge area from where a total of 10 crimes of aggressive nature were reported. Similarly police station wise the City Police Station accounts for 47% of the aggressive crimes committed in 2009.
Keywords:
GIS, Remote Sensing, Crimes, Mardan City

1. Introduction
Geography of crime is a discipline of human geography, which explains with reference to space the study of criminal wrongdoer, the incidence of crimes and characteristic of victims. Throughout the history of geography, a number of different approaches try to explain the ontogeny of the world’s societies and cultures. One most prominent approach is environmental determinism which dates back to antiquity, where it is first found in a fifth-century medical writing attributed to Hippocrates. This theory is also known as climatic determinism or geographical determinism. The fundamental argument of the environmental determinists is that different aspects of physical geography, particularly climate, influenced the psychological mind-set of individuals, which in turn determined the behavior and culture of the society. Traditionally while dealing with causes of crimes most criminologists have focused on conventional socio-demographic variables, such as sex, age, race, and socio- economic status. However there is growing concern of researcher to investigate the influence and relationship of the physical environment on criminal behavior.
Fundamental theories that help explain spatial behavior of criminals include environmental criminology, which was devised in the 1980s by Patricia and Paul Brantingham, routine activity theory, developed by Lawrence Cohen and Marcus Felson in 1979, and rational choice theory, developed by Ronald V. Clarke and Derek Cornish, 1986. Recently a number of theories have been put forward to explain the relationship of weather with crimes. The Negative Affect Escape model [1] [2] General Affective Aggression model [3] , Situational Routine Activities theory [4] and Social Escape/Avoidance theory [5] all suggest that weather might significantly influence crime rates and criminal behavior.
A large number of studies have evaluated statistically the relationship between heat and aggression [6] - [10] . Researchers are sure that oppressive heat not only impact human health but it also responsible for aggressive behavior [2] [12] - [14] . A number of researchers have highlighted the significance of temporal aspects in crime concentrations [15] - [17] . According to [15] identification of hotspots is crucial for identifying appropriate crime reduction responses.
In recent years, crime mapping and analysis has incorporated spatial data analysis techniques that add statistical validness and address inherent limitations of spatial data, including spatial autocorrelation and spatial heterogeneity. Spatial data analysis helps one analyze crime data and better understand not only why a crime occurs but also where crime is occurring [18] . Elaborate some early problems associated with the analysis and identification of high crime areas or hot spots. One such problem is inability to pinpoint the location and time of some crimes which may add error into the analysis. Initially the maps were used to examine issues like poverty or demographic characteristics with reference to crime. One of the first police departments to use mapping was New York City in the 1900s. The maps consisted of simple wall maps in which “push pins” were used to indicate crimes that had occurred [19] . During the 1920s and 1930s, sociologists at the University of Chicago used mapping to examine crime and delinquency, specifically juvenile delinquency and related social characteristics. Wall maps have long been a simple and useful way to depict crime incidents or hot spots. Many police departments still have large maps hanging on the wall of the briefing room with the most recent crimes represented by pins. Although manual wall maps are useful, they are difficult to keep updated [20] [21] .
In the 1960s and 1970s, the first computer-generated maps of crime were created. In the 1990s, geographic information systems (GIS) became extensively available, and in the late 1990s, the Criminologists and police departments start using GIS for crime analysis. In the last decade, GIS has become a powerful crime prevention and investigation tool for mapping and analyzing crime patterns. Research into computer-based crime mapping started in 1986, when the National Institute of Justice (NIJ) funded a project in the Chicago Police Department to explore crime mapping to facilitate community policing [20] .
Spatial analysis of crime, with the aid of a geographic information system (GIS) and spatial statistics, is now widely used for analyzing mass behaviors of crime events to reveal uneven distributions of crime risks and spatial interaction between crime events [22] - [25] . Numerous studies have highlighted the importance of temporal aspects in crime concentrations [15] - [17] . [15] Showed that separating stable and fluid hotspots is crucial for identifying appropriate crime reduction responses [9] . Attempt to correlate the violent and non violent crime aggregates with the summer season for two cities of USA. He found a significant correlation between violent crimes and temperature. Similar results were found by [13] . Although it is very difficult to examine actual criminal behavior in the laboratory, it has certainly has several advantages over field research. One of the major advantages is the experimenter’s ability to control conditions and variable. A series of experiments has been conducted on the impacts of high ambient temperature on aggressive behavior [1] - [26] . These researches suggests that there is a curvilinear relationship between aggression and heat i.e. aggression increase with heat.
2. Study Area
Mardan is a city and headquarters of Mardan District in the Khyber-Pakhtunkhwa province of Pakistan. It is the second most populated city after the provincial capital Peshawar. Geographically, Mardan City stretches from 34˚9'77" to 34˚13'83"N latitude and 72˚3'11" to 72˚14'48"E longitude covering an area of 32 sq km, with an altitude of 283 meters (931 feet) lying to the south-west of the district. It is situated 64 km northeast of Peshawar, the provincial capital and 148 km away from Islamabad, the federal capital of Pakistan. It was part of the ancient Gandhara Civilization. Most of its land is agricultural (Figure 1).
In 1901 the population of Mardan City was 4000, which in 1961 grew to a comparatively large figure of 77,932. By the year 1998, which reached to the figure of 246000, with 7000 people were living in Mardan Cantonment and 239,000 in Mardan Municipal Committee. While in 2010, the population of the city grew to a comparatively large figure of 337512. In 1981 the overall literacy ratio of urban area was 26.90, for the male it was 38.82% and for the women it was very low at 13.62% [27] . By the year 1998, literacy ratio had increased to 48.27 for total population, the respective figure for male was 62.83 and for female it was 31.83 percent [27] .
With the rapid growing population the crime rate is increasing in an area. Urbanization which is good as it facilitates achievement of economies of scale and in the result promotes growth of industries and economic development. Moreover, from the social point of view, it encourages crimes as in large cities the crime rate is higher. Crime rate gradually decrease toward the rural area of the city which is due to lower population density. Like other developing countries, in Pakistan there is a rapid increased in crimes. It may be due to the consequences of rapid urbanization, economic and other socio-economic conditions. However, poor law and order
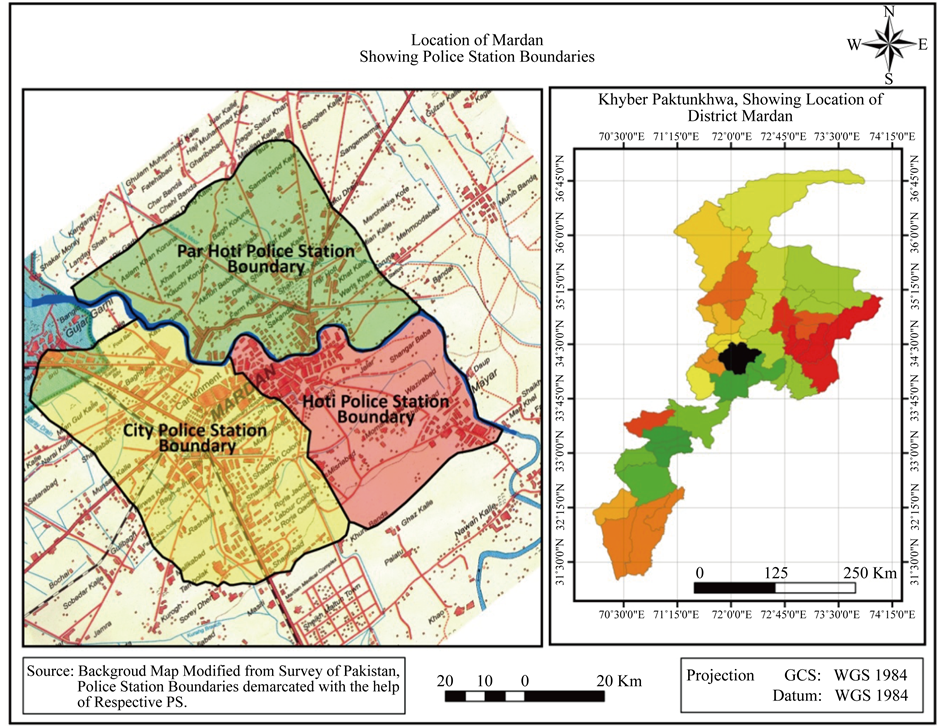
Figure 1. Location map of study area.
situation can also lead to increase the rate of criminal activities. This case study has been selected because the rise of crimes in Mardan City has been characterized by the increased use of more powerful weapons, resulting in higher mortality levels. The location of city also allow the criminal to commit a crime on the boundary of the city and then escape easily from the city this is because the number law enforcement personnel are less on the boundary of city. The current study is an attempt to figure out the spatial distribution of crimes in Mardan City, the relation of weather and crimes and also the identification of hot spots in the Mardan City during the year 2009.
3. Objectives of the Studies
The aim of the present research is to determine the spatial distribution of aggressive crime in Mardan City for a period of 12 months i.e. January-December 2009. Beside it also aimed not only to find out the hot spots but also try to analyze the collected data temporally in order to find and establish any relationship between crime and weather. In order to achieve the mandated task the two major crimes i.e. Homicides (murder) and aggressive assaults (Crimes cause injuries) were selected for analysis. Ideally one should select the entire major and minor’s crimes too, but data availability was the major constraint. Mardan City is controlled by three police stations i.e. City Police Station, ParHoti Police Station and Hoti Police Station. The Present Study covers all the three Police Stations.
4. Data Collection
For the present research the data was collected from both Primary and Secondary sources, but it mainly dependent on primary data collected from all the three Police Stations. The data collected includes crimes type, location, and time of occurrence etc. Map of Mardan City was obtained from TMA (Tehsil Municipal Administration) office of Mardan. The boundary of each police station was demarcated with the help of police officers from respective police stations. The image of Mardan was downloaded from Google earth and the area of interest was cropped with help of ARC Map. The image was printed and taken to the field to find various locations were crimes have been reported. Internet, literature and newspapers were also used to get more accurate picture of the respective crimes.
5. Data Analysis
The data was analyzed for various argumentations i.e. seasonal distribution of crimes and identification of hot spots. For this purpose the district map was scanned and digitized in ARC Map along with the police station boundaries demarcated with the help of respective police officers. After the creation of geodatabase, a point map “crimes” was created and the spatial distribution of different crimes was marked with the help of a point on map. The different attributes of crime was recorded in the attribute table of point map “crimes” i.e. location, time, date, type etc. Finally the maps were created reclassified with different fields from attribute table. The methodology is explained in the following flow chart (Figure 2).
The data collected was analyzed under the following parameters:
5.1. Police Station Wise Distribution of different Crimes
5.2. Distribution of Crimes on the Bases of Weather
5.3. Determination of hotspots
5.1. Police Station Wise Distribution of Crimes
Mardan City is divided into three police stations (Figure 3) City, ParHoti and Hoti Police Stations. The analysis of data reveals that as whole 98 crimes of aggressive nature were reported in Mardan City during 2009. Out of total 98 crimes, 47% are reported in City Police station, ParHoti 27% and Hoti Police Station accounts for 24% of total crimes reported during 2009. Crime wise aggravated assaults account for 56% of the total crime, followed by murders 40%.
The Hoti Police Station cover the areas of Guli Bagh, Bibi Abay, Sangar Baba, Mayar, Sikandari, Landakay, Chato Chowk, Khwaja Gunj, Allah Dad Khel, Khan Koty, Belind Khel and Azi Khel, etc. analysis of the collected data reveals that as a whole a total of 24 aggressive crimes were committed within the Hoti Police Station boundary. Out of these 24, 16 were aggravated assault, 07 were homicide, beside a case of kidnapping was also reported. The Par Hoti Police Station covers the areas like Nehar Chowk, MosamKorona, Pordal Abad, FaramKorona, Kacha Sarak, Muhib Banda, Shadan Baba, Tahir Abad, Bako Dery, Mardan Khaas etc. As whole 27
crimes were reported in the Par Hoti Police Station out of which 10 was homicide and 17 were aggravated assaults.
The major areas included in the City Police Station are college Chowk, Cantt area, Shamsi Road, Old Adda, New Adda, Kas Korona, Bijli Ghar, Bagh Irum, Dosehra Chowk, Labor Colony, and Bilal Masjid etc. A total of 47 crimes of aggressive nature were reported here out of which, 23 were homicide, 21 aggravated assaults and three cases of kidnapping were also reported (Table 1, Figure 3). The rate of murder is higher in City Police Station as compare to other police stations.
5.2. Weather and Crimes
It has been contended that there is always a motive behind a crime which may be enmity, hatred or a hundred other reasons. During investigation police tries to collect as much details as possible for clues to identify the wrongdoer and the motive for the umbrage. However, studies suggest that there may be other reasons why people commit crimes? One of the possible reasons suggested by various researches is the weather, the relationship of weather and crime is well documented. Researchers ascertain the relation between fluctuation in weather and the incidence of both violent and non-violent crimes [28] - [30] . Various weather conditions such as heat waves, higher temperatures, high humidity, wind, air and water pollution along with overcrowded living conditions can lead to higher levels of criminal activity.

Figure 2. Steps in research methodology.

Table 1. Spatial distribution of crimes reported in respective Police Station (PS) during 2009.
Source: Respective Police Station.

Figure 3. Showing the boundaries of respective police station.
One of the objectives of the study was to analyze the reported aggressive crimes temporally in order to determine and establish any relationship, if any between crime and weather. Just like most other parts of Pakistan, in Mardan summers are extremely hot and last from May to September, June the hottest month with an average temperature of 41.5˚C. Winters are cool to cold and last from October to February. The mean minimum temperature recorded for the month of January is 2.1˚C. Spring is too short and only last for two months. Most of the rainfall occurs in the months of July, August, December and January. Maximum rainfall for August is 125.85 mm. There are occasional thunderstorms and hail storms. The relative humidity is quite high throughout the year while maximum humidity has been recorded in December at 73.33% [27] . The collected data was grouped from March to April (spring), May to September (summer) and October to February (winter) to correlate and establish any relationship between crimes and Season.
5.2.1. March to April (Spring)
The analysis of the collected data reveals that during the spring season (March to April) of 2009, a total of 19 crimes were reported from all the three police stations. Out of these 19 crimes, 06 were homicide and rest 11 were aggravated assaults.
5.2.2. May to September (Summer)
Summers in Mardan are hot, humid and last for 05 months. During the summer of 2009, a total of 44 crimes were reported, which were 48% of the total aggressive crimes committed during 2009. Out of 44 reported crimes, 25 (56%) were aggravated assaults, and 19 (42%) were homicide. It is also important to mention that out of total 40 homicide cases reported in 2009, 48% were committed in summer. Likewise summer also accounts for 46% of the total aggravated assaults reported during the same period. The analysis of collected data also reveals that majority (24 out of total 44) of crimes reported during summer were committed in the premises of the city police station. It comes as no surprise as the city police station is covering some of the densely populated region of Mardan city.
5.2.3. October to February (Winter)
Analysis of data reveals that during winter (October-February 2009) a total of 31 crimes were committed. Out of these total 31, 18 were aggravated assault, 13 were homicide.
5.2.4. Discussion
The analysis of data on the basis of seasons revealed that 47% of total crimes were committed from May- September (summer) followed by 33% in winter and the rest 20% in spring (March-April) during the year 2009. The primary reason seems to be temperature/heat which can cause irritation. Weather gets hot and people get mad more easily, this leads to a loss of tempers. Though it’s not the final verdict but still this study support most of the researches which indicate that most crime occurs in summer season (Table 2, Figure 4). A number of
Table 2. Mardan City, Seasonal Distribution of Crimes Committed During 2009.
Source: Respective Police Station.

Figure 4. Showing the seasonal distribution of crimes in Mardan City.
weather-related crime studies in France, the UK and US have suggested that assaults, murder, domestic violence, robbery and suicide were high following high temperature [28] .
6. Hotspots
Although the location where a crime occurs is important but equally crucial is the characteristic of those places and the environment in which the crime takes place. The term hot spot has become part of the crime analysis vocabulary and has received a lot of attention. A hot spot is a condition indicating some form of clustering in a spatial distribution. [18] Defined hot spots “as small places in which the occurrence of crime is so frequent that it is highly predictable, at least over a 1-year period.” Generally, the hot spot concept is applied to street crime rather than white-collar crime, organized crime, or terrorist crime.
GIS helps and analyze crimes in many different ways. The most significant use is to visualize crime occurrences. This allows law enforcement agencies to understand where crime is occurring as well as determine if there are any patterns. Areas of high crime density are known as hot spots. Hot spot analysis is a valuable tool as it allows police to not only identify areas of high crime but also explore variables that are affecting crime patterns. With this information, law enforcement agencies can be more efficient in their crime fighting tactics from increasing patrols around such locations or by proactive measures.
For spatial analysis the collected data was plotted with the help of police record of location where the crime take place. The analysis of data reveals a total of 05 hot spot in Mardan City. The most crucial seem to be Sikindaray area where within 05 km radius a total of 11 crimes were committed during 2009, followed by Kalpani Bridge 10 and Bilal Mosque area 09. In terms of aggravated assaults Kalpani Bridge and Sikindaray rank 1st with total of 07 and 06 cases reported from each respectively, followed by Bilal Mosque and Pakistan Chowk 05 and 04 cases respectively (Table 3, Figure 5). In term of murders Sikindaray with 05 cases of homicide rank 1st, Dosehra Chowk and Bilal Mosque with 04 homicides each rank 2nd.
7. Conclusion
The present study demonstrated the efficiency of Geographic Information System and Remote Sensing as a tool in the study of crimes in the urban areas of Mardan City. Mardan is the second most populous city after the provincial capital Peshawar, located in the province of Khyber Pakhtunkhwa, Pakistan. Though, for the implementing law and order situation of the whole city three police stations i.e. Hoti PS, Par Hoti PS and City PS were responsible. However, three different types of crimes (murder, injury and kidnapping) were selected. The analysis showed that 25% of crimes were reported in limits of Hoti Police Station followed by 28% in Par Hoti Police Station and 47% in the areas controlled by City Police Station. The data depicted that Hoti Police Station registered 7 cases of murder, 16 cases of injuries and 1 case of kidnapping. Par Hoti Police Station reported 10 cases of murder and 17 cases of injuries. The highest rate of crimes was registered in the limits of City Police Station which includes 22 cases of murder, 21 cases of injuries and 3 cases of kidnapping. Furthermore, the analysis also revealed that the intensity of crimes was higher in summer season with reported cases of 20 murders, 26 injuries and 3 kidnappings. A buffer of 5-km radius was used to expose the hotspot areas in term of crimes. A total of 5 buffers were identified. Dosehra Chowk was the first ring where 8 cases of Murder were recorded followed by Kalpani Bridge (5 cases of Murder), Bilal Masjid (4 cases of Murder), Pakistan Chowk (4 cases of Murder)
Table 3. Mardan City, hotspots 2009; number and type of crimes committed within 05 Km radius of hotspots.
Source: Respective Police Station.

Figure 5. Showing the hot spot area of Mardan City.
and Sikandari (3 cases of Murder). Whereas, in terms of crimes causing injuries, Kalpani and Sikandari were ranked first with total of 8 cases each, followed by Pakistan Chowk and Bilal Masjid 6 cases each.
Cite this paper
Pukhtoon Yar,Jamal Nasir, (2016) GIS Based Spatial and Temporal Analysis of Crimes, a Case Study of Mardan City, Pakistan. International Journal of Geosciences,07,325-334. doi: 10.4236/ijg.2016.73025
References
- 1. Baron, R.A. (1972) Aggression as a Function of Ambient Temperature and Prior Anger Arousal. Journal of Personality and Social Psychology, 24, 183-189. http://dx.doi.org/10.1037/h0032892
- 2. Bell, P.A. and Baron, R.A. (1976) Aggression and Heat: The Mediating Role of Negative Effect. Journal of Applied Social Psychology, 6, 18-30. http://dx.doi.org/10.1111/j.1559-1816.1976.tb01308.x
- 3. Anderson, C.A., Deuser, W.E. and DeNeve, K (1995) Hot Temperatures Hostile Affect Hostile Cognition and Arousal: Test of a General Model of Affective Aggression. Personality and Social Psychology Bulletin, 21, 434-448. http://dx.doi.org/10.1177/0146167295215002
- 4. Cohen, L.E. and Felson, M. (1979) Social Change and Crime Rate Trends: A Routine Activity Approach. American Sociological Review (American Sociological Association), 44, 588-607.
http://dx.doi.org/10.2307/2094589 - 5. Cohen, L.E., Peterson, A.G. and Tarr, D.B. (2004) Temperature, City Size and the Southern Subculture of Violence: Support for Social Escape Avoidance (SEA) Theory. Journal of Applied Social Psychology, 16, 786-801.
- 6. Rotton, J. and Cohn, E. (2003) Global Warming and U.S. Crime Rates: An Application of Routine Activity Theory. Environment and Behavior, 35, 802-825. http://dx.doi.org/10.1177/0013916503255565
- 7. Anderson, C.A., Bushman, B.J. and Groom, R.W. (1997) Hot Years and Serious and Deadly Assaults: Empirical Tests of the Heat Hypothesis. Journal of Personality and Social Psychology, 73, 1213-1223.
http://dx.doi.org/10.1037/0022-3514.73.6.1213 - 8. Anderson, C.A (1989) Temperature and Aggression: Ubiquitous Effects of Heat on the Occurrence of Human Violence. Psychological Bulletin, 106, 74-96. http://dx.doi.org/10.1037/0033-2909.106.1.74
- 9. Cotton, J.L. (1986) Ambient Temperature and Violent Crime. Journal of Applied Social Psychology, 6, 18-30.
- 10. Anderson, C.A. and Anderson, D.C. (1984) Ambient Temperature and Violent Crime: Test of the Linear and Curvilinear Hypothesis. Journal of Personality and Social Psychology, 46, 91-97.
http://dx.doi.org/10.1037/0022-3514.46.1.91 - 11. DeFronzo, J. (1984) Climate and Crime: Tests of an FBI Assumption. Environment and Behavior, 16, 185-210. http://dx.doi.org/10.1177/0013916584162003
- 12. Harries, K.D., Stadler, S.J. and Zdorowski, R.T. (1984) Seasonality and Assault: Exploration in Inter-Neighborhood Variation, Dallas 1980. Annals of the Association of American Geographers, 74, 590-604. http://dx.doi.org/10.1111/j.1467-8306.1984.tb01476.x
- 13. Harries, K.D. and Stadler, S.J. (1988) Heat and Violence: New Findings from Dallas Field Data, 1980-1981. Journal of Applied Social Psychology, 18, 129-138.
http://dx.doi.org/10.1111/j.1559-1816.1988.tb00010.x - 14. Cohn, E. and James, R. (2000) Weather, Seasonal Trends, and Property Crimes in Minneapolis, 1987-1988: A Moderator-Variable Time-Series Analysis of Routine Activities. Journal of Environmental Psychology, 20, 257-272. http://dx.doi.org/10.1006/jevp.1999.0157
- 15. Johnson, S.D., Lab, S.P. and Bowers, K.J. (2008) Stable and Fluid Hotspots of Crime: Differentiation and Identification. Built Environment, 34, 32-45. http://dx.doi.org/10.2148/benv.34.1.32
- 16. Paulson, D.J. and Robinson, M.B. (2004) Spatial Aspects of Crime: Theory and Practice. Prentice Hall, Upper Saddle River.
- 17. Ratcliffe, J.H. (2004) The Hotspot Matrix: A Framework for the Spatio-Temporal Targeting of Crime Reduction. Police Practice and Research, 5, 5-23. http://dx.doi.org/10.1080/1561426042000191305
- 18. Sherman, L.W. (1995) Hot Spots of Crime and Criminal Careers of Places. In: Eck, J.E. and Weisburd, D., Eds., Crime and Place. Criminal Justice Press, Monsey; and Police Executive Research Forum, Washington DC, 35-52.
- 19. Rachel, B. (2001) Introductory Guide to Crime Analysis and Mapping. Report of the Office of Community Oriented Policing Services, US department of Justice.
- 20. Weisburd, D. and McEwen, T. (1997) Crime Prevention Studies. Criminal Justice Press.
- 21. Harries, K. (1999) Mapping Crime: Principle and Practice. US Department of Justice, Washington DC.
- 22. Chainey, S. and Ratcliffe, J. (2005) GIS and Crime Mapping. John Wiley & Sons, Hoboken.
http://dx.doi.org/10.1002/9781118685181 - 23. Grubesic, T.H. and Mack, E.A. (2008) Spatio-Temporal Interaction of Urban Crime. Journal of Quantitative Criminology, 24, 285-306. http://dx.doi.org/10.1007/s10940-008-9047-5
- 24. Goldsmith, V., McGuire, P.G., Mollenkopf, J.H. and Ross, T.A., Eds. (2000) Analyzing Crime Patterns: Frontiers of Practice. Sage Publications. http://dx.doi.org/10.4135/9781452220369
- 25. Baron, R.A. and Bell, P.A. (1976) Aggression and Heat: The Influence of Ambient Temperature, Negative Affects and a Cooling Drink on Physical Aggression. Journal of Personality and Social Psychology, 33, 245-255. http://dx.doi.org/10.1037/0022-3514.33.3.245
- 26. GOP (Government of Pakistan) (1998) Mardan District Census Reports. Population Census Organization, Islamabad.
- 27. Brunsdon, C., Jonathan, C., Gary, H. and Andrew, W. (2009) The Influence of Weather on Local Geographical Patterns of Police Calls for Service. Environment Planning and Design, 36, 906-926.
http://dx.doi.org/10.1068/b32133 - 28. Bushman, B.J., Anderson, C.A. and Wang, M.C. (2005) Is the Curve Relating Temperature to Aggression Linear or Curvilinear? Assaults and Temperature in Minneapolis Reexamined. Journal of Personality and Social Psychology, 89, 62-66. http://dx.doi.org/10.1037/0022-3514.89.1.62
- 29. Cohn, E. (1990) Weather and Crime. British Journal of Criminology, 30, 51-64.
- 30. Butke, P. and Sheridan, S.C. (2010) An Analysis of the Relationship between Weather and Aggressive Crime in Cleveland, Ohio. Weather, Climate, and Society, 2, 127-139.
http://dx.doi.org/10.1175/2010WCAS1043.1