Journal of Minerals and Materials Characterization and Engineering
Vol. 1 No. 3 (2013) , Article ID: 32293 , 7 pages DOI:10.4236/jmmce.2013.13020
Studies on the Synthesis, Growth and Characterization of ([Paranitrophenyl]Imino)Benzene NLO Crystal by Sankaranarayanan-Ramasamy Method
1Department of Physics, St. Xavier’s College (Autonomous), Palayamkottai, India
2Department of Physics, Presidency College, Chennai, India
Email: *dpremanand@yahoo.co.in
Copyright © 2013 S. Anbarasu et al. This is an open access article distributed under the Creative Commons Attribution License, which permits unrestricted use, distribution, and reproduction in any medium, provided the original work is properly cited.
Received November 4, 2012; revised December 28, 2012; accepted January 19, 2013
Keywords: Single Crystal Growth; S-R Method; Nonlinear Optical Materials
ABSTRACT
The study of imine-bridged organics has been the hot spot synthesis of second order nonlinear optical (SONLO) and photo-responsive materials in recent years. Herein we present a study of synthesis, growth, and characterization of ([paranitrophenyl]imino)benzene (PNPIB) NLO single crystal. The title compound was synthesized in one step by Schiff base formation. <110> PNPIB single crystal of diameter of 40 mm and length 50 mm was successfully grown by SR method using a seed as the nucleus. The growth rate formula is derived for the SR method. PNPIB single crystals of 10 mm diameter and 60 mm height have been grown at an average growth rate of 3 mm per day from the point seed in a glass crystallizer. Almost 100% stable crystal conversion efficiency was achieved. The as grown PNPIB crystals were characterized using single crystal X-ray diffraction (XRD), X-ray powder diffraction (XRPD), Fourier Transform Infrared (FTIR), Ultraviolet-Visible-Near Infrared (UV-Vis-NIR), 1H & 13C NMR spectral studies, dielectric measurement and NLO studies. Single crystal XRD analysis confirms that the grown ingot belongs to the space group of P2 of monoclinic system thus exhibiting noncentrosymmetric structure. The crystalline perfection was assessed by XRPD. The powder diffraction pattern of the grown crystal has been indexed. The presence of C=N bond with intramolecular hydrogen bonding and the protonation of ions were confirmed by FTIR analysis. The UV-Vis-NIR spectrum of the crystal shows that the crystal has a cut-off at 298 nm. The 1H & 13C NMR spectra confirm the molecular structure. The dielectric behaviour was measured in the frequency range 1 KHz - 10 KHz for the temperature range from 30˚C to 170˚C. The slight decrease in dielectric constant has been observed as the frequency is increased and the dielectric loss is very low for the entire frequency range. The second harmonic generation (SHG) in the crystal was observed by Kurtz powder technique.
1. Introduction
Second order non-linear optical (SONLO) materials have recently attracted much attention because of their potential application in emerging optoelectronic technologies [1,2]. Materials with large second order optical nonlinearities are used in the area of laser technology, laser communication and data storage devices [3,4]. The search for new conversion materials over the past decades lead to the discovery of many organic NLO materials with high nonlinear susceptibilities. Organic materials have been demonstrated in recent years to possess superior second order and third order NLO properties compared to the more traditional inorganic materials. The structural flexibility of organic compounds is an asset for materials with optimised second order NLO susceptibility, fast response and tailor made flexibility [5]. An innumerable of organic crystals are synthesized and grown in this fashion [6-11]. One of the obvious requirements for nonlinear crystal is that it should have excellent optical quality. For a device to succeed, it is vital that it should meet a number of criteria such as optical nonlinearity, chemical and thermal stability for life time system capability [12]. The above said parameters fit excellently to imine materials. Hence, the imino heterojunction organic materials are used as bio-functional compounds with excellent NLO responses [13-19]. We also know that the heterojunction units are the core structures of a number of natural products like imine acids, bioelectric and photovoltaic materials. Here Schiff bases have been produced to be a class of functionally active compounds in these areas. Recently Unver et al. have reported the structural and NLO properties for some imine bridged aromatic compounds [13,19,20]. Volodymr et al. have designed thermostable acentric nonlinear optical crystalline imine derivatives [21,22]. Heravic et al. have reported a theoretical investigation of the structure electronic properties and second harmonic generation of imine ligands [23]. Oleinik et al. have performed systematic studies in the field of structural modifications of metal complexes of imine derivatives [24]. It has been produced that the phenoxy imine crystals containing an aldimine group shows higher catalytic and photoresponsive activity than their analysis with ketimine groups [25]. Recently the Hyper-Rayleigh scattering and the electric field induced SHG measurements for two anil systems and in particular their variations upon switching between the enol-imine and keto-amine derivatives were reported by Plagvet et al. [26]. A new novel crystalline structure 2-hydroxy-N-[3(5)-pyrazolyl]-1-4-napthoquinone-4-imine was grown by Speranedo et al. and the characterization studies such as DSC, TG/DTA, FTIR, HRXRD were carried out [27]. The intermolecular interaction between the carbonyl and the imine groups in the crystalline compounds containing six member heterocycles were identified by Golovina et al. [28]. Based on these results our group has been engaged in the synthesis and growth of organic crystalline materials for NLO applications [29- 31]. Motivated by the findings, a novel growth by Sankaranarayanan-Ramasamy (S-R) method [32] has been introduced to grow PNPBI crystals for NLO applications for the first time. The main features of this method over others are microbial growth is naturally avoided, less sophisticated instrument and maximum soluble crystal conversion efficiency is achieved and moreover the growth rate is visualised precisely for individual faces. The as grown crystals were characterized by XRD, XRPD, FTIR, UV-Vis-NIR, 1H & 13C NMR, NLO and dielectric studies.
2. Synthesis and Growth Studies
2.1. Synthesis of PNPIB
Most of the chemicals in this work were purchased from E-Merck and used without further purification. The title compound was synthesised by one step condensation method. Equimolar ratio of para-nitrobenzaldehyde and aniline were dissolved. The reaction mixture was stirred for about an hour to give a yellow crystalline salt. The as obtained crystalline salt was used for solubility and growth experiments. The reaction scheme is shown in Figure 1.
2.2. Solubility Studies of PNPIB
The synthesized salt was used to measure the solubility of pure PNPIB crystals in Dimethyl formamide (DMF). A 250 ml borosil glass beaker filled with 100 ml DMF was placed inside a constant temperature bath. An acrylic sheet with a circular hole at the middle was placed over the beaker through which a spindle from an electric motor, placed on the top of the sheet was introduced into the solution. A Teflon paddle was attached at the end of the rod for stirring the solution. The synthesized salt was added in small amounts with DMF solvent and stirring was continued till the formation of precipitate, which confirmed the supersaturation of the solution. A 20 ml of the saturated solution was withdrawn by means of a warmed pipette and the same was poured into a clean, dry and weighed petri dish. The solution was kept in a heating mantle for slow evaporation till the whole of the solution got evaporated and the mass of PNPIB in 20 ml of solution was determined by weighing petri dish with salt and hence the solubility, i.e. quantity of PNPIB salt in gram dissolved in 100 ml of the solvent was determined. The solubility of PNPIB crystals in DMF solvent was determined for five different temperatures (30˚C, 35˚C, 40˚C, 45˚C and 50˚C) by adopting the same procedure. The resulting solubility curve of pure PNPIB is shown in Figure 2.
2.3. Growth Rate of PNPIB
It is well known that the evaporation rate of the solvent DMF into the atmosphere is a function of temperature, humidity and air velocity. It is evident that the evaporation process in the atmosphere is diffusion of DMF molecules coming out of its surface through the air larger covering its surface. To calculate theoretically the absolute evaporation rate, we must know the diffusion coefficient of DMF vapour in air and the thickness of the boundary layer accurately. Kazuo Histake et al. reported a detailed survey on the evaporation rate [33]. A reaction for the growth rate of S-R method is given by RT = 0.318 K (SE)/r2d (cm per day), where K is the proportionality constant, S is the solubility of the material (g/ml) of the solvent, E is the evaporation rate of the solvent (ml per day), r is the radius of the vessel, d is the density of the
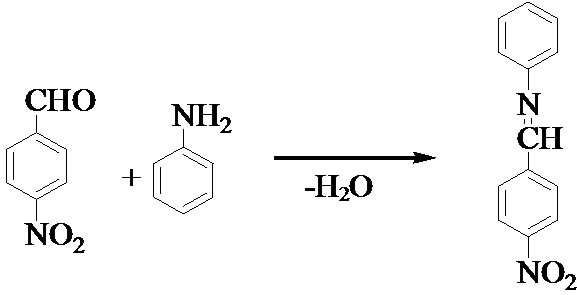
Figure 1. Reaction scheme of PNPIB single crystal.
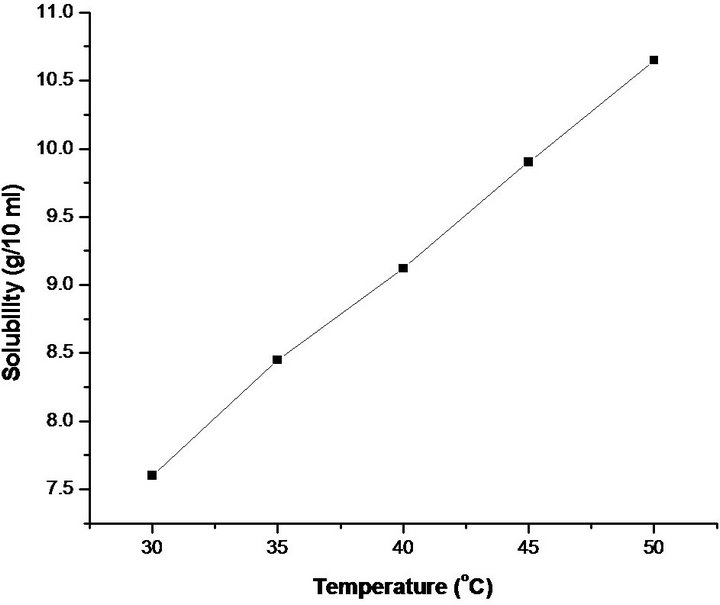
Figure 2. Solubility curve of PNPIB single crystal.
material (g/cm3) and T is the temperature (K). By using the above parameters, the growth rate of the crystal is calculated. The evaporation rate of the solvent in an ampoule was also measured by observing the lowering rate of the top surface of the solution level.
3. Experimental Set-Up S-R Method
The experimental set-up for the grown PNPIB single crystal by S-R method is shown in Figure 3. It consists of a growth ampoule made out of glass. An outer glass shield tube protects and holds the inner growth ampoule. Ring heaters were positioned at the top and the bottom of the ampoule which was connected to a temperature controller. The temperature controller provided the necessary temperature for solvent evaporation. The PNPIB solution of optimized saturation was prepared using DMF solvent. The as grown PNPIB single crystal by slow evaporation technique and <010> crystals of PNPIB grown by S-R method are shown in Figures 4 and 5 respectively.
4. Characterization Studies
4.1. Single Crystal XRD
The single crystal X-ray diffraction was recorded with Bruker Kappa APEXII diffractometer and the wavelength of X-ray used was 0.7093 Å (Target-Molybdenum). From the single crystal XRD, the lattice parameters were calculated and the crystal belongs to monoclinic system with a space group of P2. The lattice parameters are a = 14.48 Å, b = 10.72 Å, c = 14.58 Å, α = 90˚, β = 101.95˚ and γ = 90˚ and v = 2214 Å3. The lattice parameters were calculated using SHELXL programme.
4.2. XRPD Analysis
Powder XRD analysis was carried out using XPERT
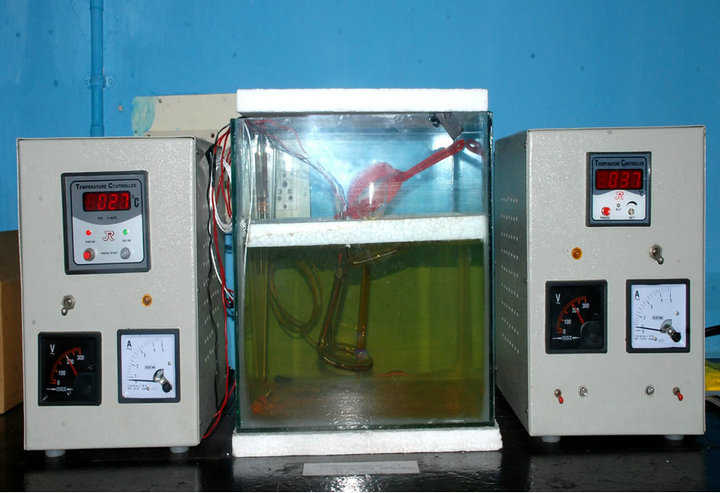
Figure 3. Sankaranarayanan-ramasamy method.
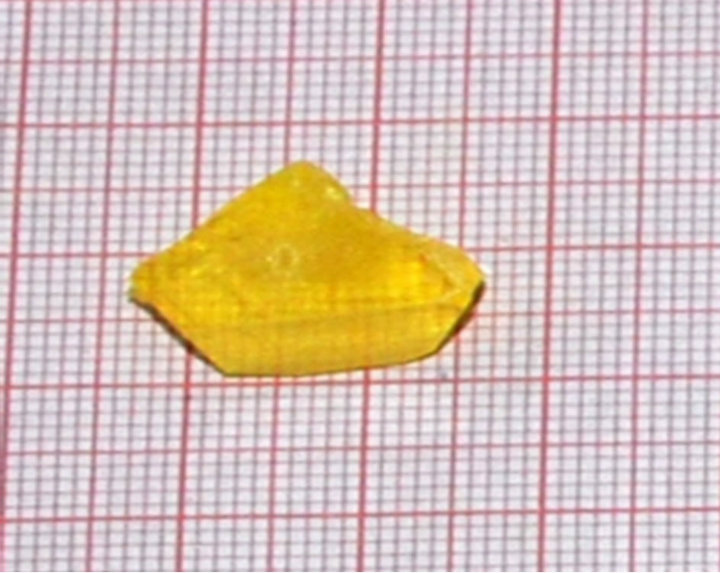
Figure 4. Photograph of as grown crystal of PNPIB by slow evaporation method.
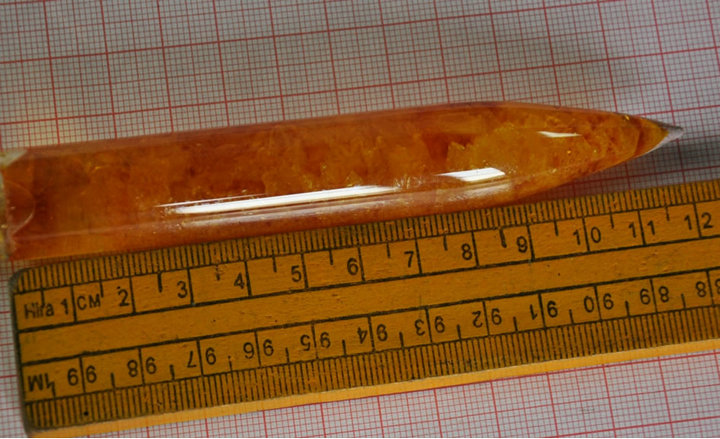
Figure 5. Photograph of as grown PNPIB single crystal by S-R method.
Powder diffractometer with CuKα (λ = 1.541 Å) radiation to confirm the structure of the as grown PNPIB crystals. The sample was scanned over the range 10˚ - 60˚ at a rate of 1˚ nm−1. The XRPD and peak indexing are shown in Figure 6. The peaks were indexed using X’Pert software. The recorded spectrum confirms the growth orientation to be <110> plane. The XRPD pattern reflects the good crystalllinity of the grown crystal.
4.3. FTIR Spectral Studies
FTIR spectrum is important evidence that provides more information about the structure of a compound. In this technique, almost all functional groups in a molecule absorb characteristically within a definite range of frequency. The absorption of IR radiation causes the various bonds in the molecule to stretch and bend with respect to one another. The most important range (4000 - 400 cm−1) is of prime importance for the study of an organic compound by spectral analysis [34]. In the present study FTIR spectrum was recorded using Perkin-Elmer spectrometer with KBr pellet technique. The spectrum is shown in Figure 7. The vibrational bands for the PNPIB crystal were observed in the 4000 - 400 cm−1. Absorption bands at 3075, 3094, 3003 (νC-H, νAr-H), 1452 - 1626 (νC=C), 2848 - 2916 (ν CH3), 744 (νC-C) cm−1 were observed. The absorption band assignable to the stretching of C=N bond was observed at frequency of 1626 cm−1. A peak at 1953 cm−1 is due to C=C stretching. The peak at 1490 cm−1 is due to N-H in plane bending. A peak at 1513 cm−1 is attributed to NO2 asymmetric stretching. A peak at 1094 cm−1 is due to C-N stretching. A peak at 851 cm−1 is due to C-H bending. A peak at 955 cm−1 is attributed to N-O stretching. A peak centred at 744 cm−1 is due to C-H out of plane bending. A peak at 851 cm−1 is attributed to C-H bending. A peak at 697 cm−1 is due to C-C out of plane bending due to the mono substitutional benzene ring. Thus the FTIR spectral confirms the presence of the functional groups and their mode of vibrations.
4.4. UV-Vis-NIR Study
It is very helpful in the investigation of the NLO materials also making it possible to check, apart from NLO responses and also spectroscopic absorbance in the appropriate wavelength. Therefore the wavelength obtained by UV visible spectral analysis can be helpful in the synthesis of promising NLO materials [35]. Zhou has calculated that the estimated electronic transition wavelengths obtained by UV-Visible spectral analysis for chain compounds are about 10 nm shorter than that of the cycles and the wavelength for both groups should have been found to be shorter than 400 nm implying good thermo parameters and NLO property [36]. Albert et al have reached the conclusion that with the correct substitution in the ring, characterized by strong intramolecular π ® π* charge transfer transitions found through UVVisible spectral analysis, some specific electronic and structural properties of this system could produce high NLO responses [37]. The absorption spectrum of PNPIB was recorded using Varian Carry 5E model UV-Vis-NIR spectrometer in the wavelength range 1000 nm - 200 nm by dissolving the PNPIB in DMF. The spectrum is
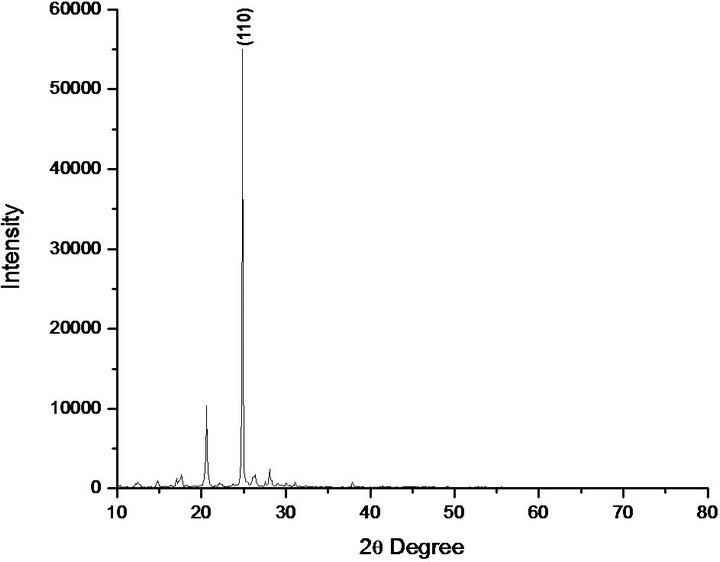
Figure 6. XRPD spectrum of PNPIB single crystal.
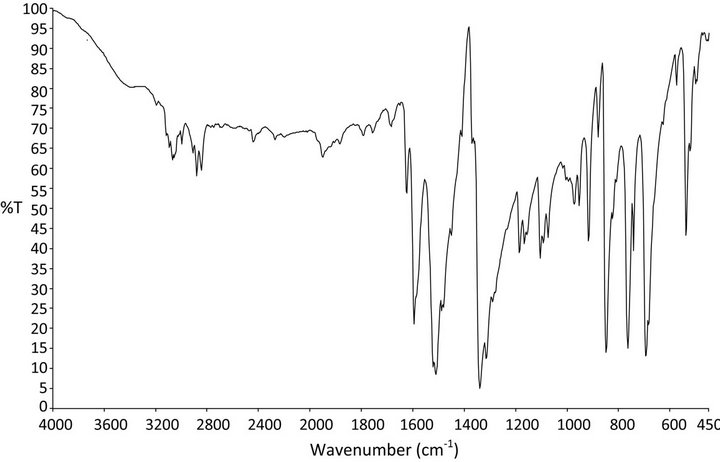
Figure 7. FTIR Spectrum of PNPIB single crystal.
shown in Figure 8. It is clear from the spectrum that PNPIB exhibits solvatochromism i.e., its maximum absorption peak show bathochromic behaviour with band shift centred at 275 nm and all the transitions are π ® π*, generally considered as indicative of molecular first hyperpolarizabilities with non-zero value [36,37]. It is found from the spectrum that the maximum absortion values of π ® π* transition for PNPIB is all most within 200 - 300 nm.
4.5. 1H and 13C NMR Spectral Analyses
In order to analyze carbon-hydrogen bonded network, 1H and 13C NMR spectra were recorded using Bruker ARX 300 spectrometer in CDCl3 at 300 K. 1H and 13C spectrum of PNPIB single crystals are shown in Figures 9 and 10 respectively. Signals between 7.2 ppm to 7.5 ppm correspond to aromatic protons attached to imino group. Peak signals between 8 ppm to 8.4 ppm correspond to aromatic protons attached to nitro group. A singlet at 8.6 ppm is attributed to proton attached to nitogen of imino group. Absence of peak around 3.5 ppm suggests the complete removal of aniline the starting compound. The signals between 148 ppm and 152 ppm are assigned to carbons attached to nitro group and imino group. The absence of signal beyond 160 ppm suggests the complete removal of the starting material benzaldehyde in the crystal. The signals between 120 ppm to 130 ppm correspond to the aromatic carbons.
4.6. Dielectric Studies
The dielectric study on PNPIB single crystal was carried out <010> face of PNPIB crystal using the instrument HIOKI 3532-5 LCR HITESTER. A sample of dimension 2 × 6 × 2 mm3 having silver coating on the opposite faces was placed between the two copper electrodes and thus a
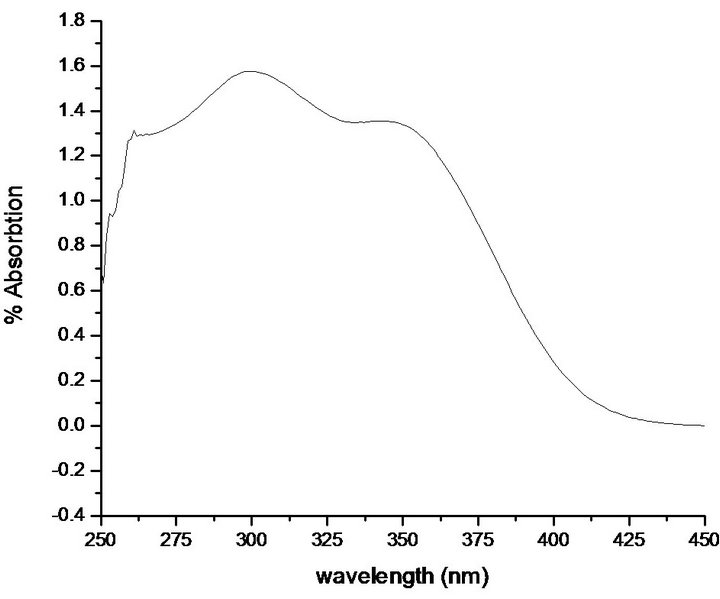
Figure 8. UV-Vis-NIR spectrum of PNPIB single crystal.
parallel plate capacitor was formed. The capacitance of the sample was measured by varying the frequency from 500 Hz to 5 MHz. Figure 11 shows the plot of dielectric constant versus applied frequency. The very high values of εr at low frequencies may be due to the presence of space, charge, orientational, electronic and ionic polarization. The low value of εr at higher frequencies way be due to the loss of significance of these polarizations gradually. In accordance with Miller rule, the lower value of dielectric constant is a suitable parameter for the enhancement of NLO applications [38]. The variation of dielectric loss with frequency is shown in Figure 12. The characteristic of low dielectric loss at high frequencies for a given sample suggests that the sample possesses an enhanced optical quality with lesser defects [39].
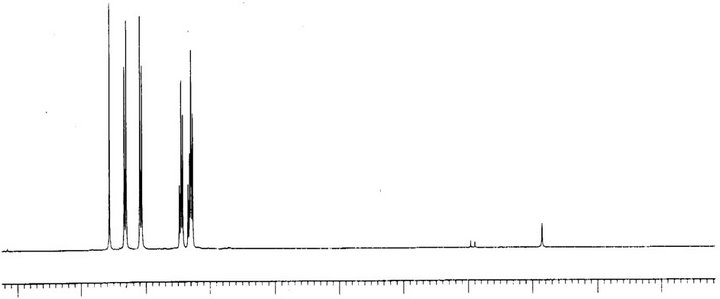
10 9 8 7 6 5 4 3 2 1 0 ppm
Figure 9. H1 NMR of PNPIB single crystal.
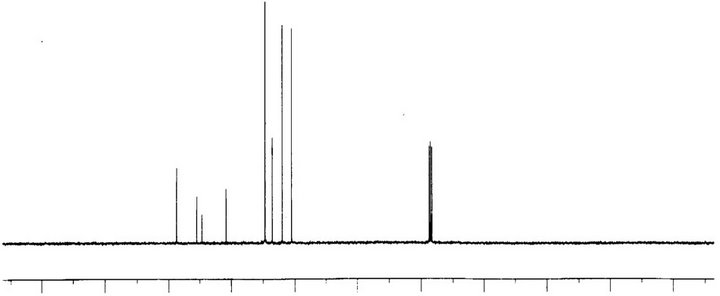
200 180 160 140 120 100 80 60 40 20 0ppm
Figure 10. C13 NMR spectrum of PNPIB single crystal.
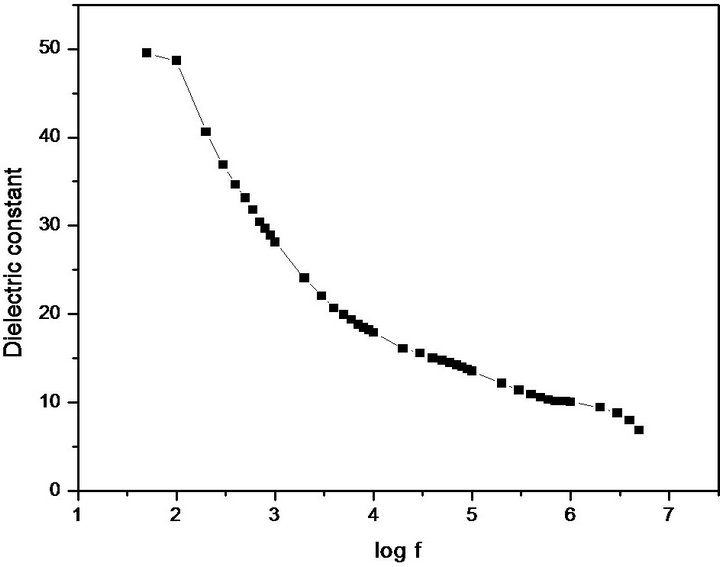
Figure 11. Dielectric constant of PNPIB single crystal.
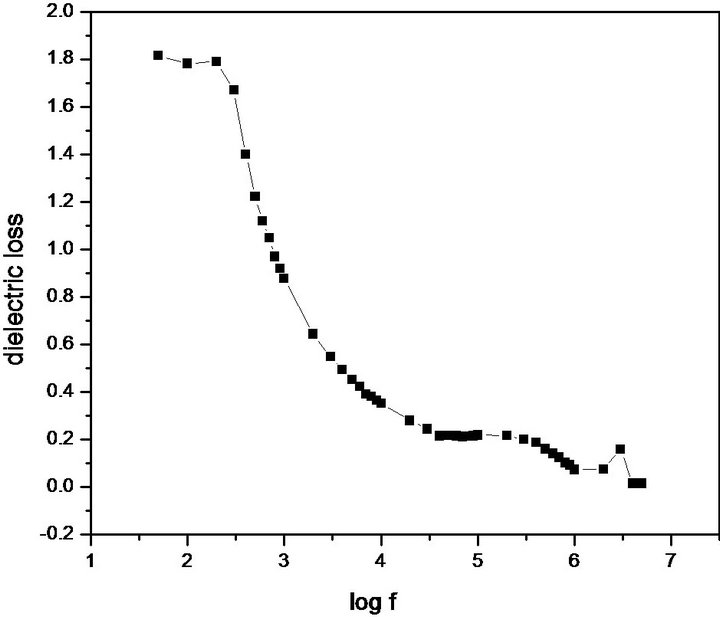
Figure 12. Dielectric loss of PNPIB single crystal.
4.7. NLO Test
A preliminary study on the SHG efficiency of the grown PNPIB crystal was measured by Powder Kurtz method. The measured SHG efficiency was compared with KDP and found that the grown PNPIB crystal has nearly 1.5 times higher NLO efficiency than KDP, which is familiar inorganic NLO material.
5. Conclusion
PNPIB single crystal was synthesized through solventfree reaction mechanism and grown by both slow solvent evaporation technique and S-R method. The lattice parameters and the noncentrosymmetric space group were confirmed by Single crystal XRD analysis. XRPD analysis ascertained the perfect crystalline arrangement in PNPIB structure. FTIR spectral analysis confirms the presence of functional groups and their mode of vibrations in PNPIB crystal. UV-Vis-NIR spectral analysis has reached the conclusion that PNPIB exhibits solvatochromism and intramolecular π ® π* charge transfer transition which proves that PNPIB has a good NLO property. H1 & C13 NMR spectral analysis strongly confirm the carbon-hydrogen network among imino and nitro functional groups. Dielectric measurements were carried over the range 500 Hz - 5 MHz which shows that the dielectric constant decreases slowly with increase in frequency thus PNPIB crystal exhibiting good optical quality.
6. Acknowledgements
The authors S. Anbarasu and Prem Anand Devarajan would like to thank University Grants Commission, Bahadurshah Zafar Marg, New Delhi-110 002, India for funding this Major Research Project (File No.: 40-434/ 2011(SR), dt. 04.07.2011).
REFERENCES
- H. O. Marcy, L. F. Warren, M. S. Webb, C. A Ebbers, S. P. Velsko, G. C. Kennedy and G. C. Catella, “SecondHarmonic Generation in Zinc Tris (Thiourea) Sulfate,” Applied Optics, Vol. 31, No. 24, 1992, pp. 5051-5060. doi:10.1364/AO.31.005051
- X. Q. Wang, D. Xu, D. R. Yuan, Y. P. Tian, W. T. Yu, S. Y. Sun, Z. H. Yang, Q. Fang, M. K. Lua, Y. X. Yana, F. Q. Menga, S. Y. Guo, G. H. Zhang and M. H. Jiang, “Synthesis, Structure and Properties of a New Nonlinear Optical Material: Zinc Cadmium Tetrathiocyanate,” Materials Research Bulletin, Vol. 34, No. 12-13, 1999, pp. 2003-2011. doi:10.1016/S0025-5408(99)00211-1
- P. A. A. Mary and S. Dhanuskodi, “Growth and Characterization of a New Nonlinear Optical Crystal: Bis Thiourea Zinc Chloride,” Crystal Research and Technology, Vol. 36, No. 11, 2001, pp. 1231-1237. doi:10.1002/1521-4079(200111)36:11<1231::AID-CRAT1231>3.0.CO;2-I
- R. Rajasekaran, R. Mohan Kumar, R. Jayavel and P. Ramasamy, “Influence of pH on the Growth and Characteristics of Nonlinear Optical Zinc Thiourea Chloride (ZTC) Single Crystals,” Journal of Crystal Growth, Vol. 252, 2003, pp. 317-327. doi:10.1016/S0022-0248(02)02467-3
- R. Rajasekaran, P. M. Ushasree, R. Jayavel and P. Ramasamy, “Growth and Characterization of Zinc Thiourea Chloride (ZTC): A Semiorganic Nonlinear Optical Crystal,” Journal of Crystal Growth, Vol. 229, No. 1-4, 2001, pp. 563-567. doi:10.1016/S0022-0248(01)01229-5
- S. A. De Vries, P. Goedtkindt, W. J. Huisman, M. J. Zwanenburg, R. Feidenhansl, S. L. Bennett, D. M. Smilgies, A. Stierle, J. J. De Yoreo, W. J. P. Van Enckevort, P. Bennema and E. Vlieg, “X-Ray Diffraction Studies of Potassium Dihydrogen Phosphate (KDP) Crystal Surfaces,” Journal of Crystal Growth, Vol. 205, No. 1-2, 1999, pp. 202-214. doi:10.1016/S0022-0248(99)00249-3
- J. N. Woodford, C. H. Wang and K. Y. Jen Alex, “Dispersion of the First Molecular Hyperpolarizability of Charge-Transfer Chromophores Studied by Hyper-Rayleigh Scattering,” Chemical Physics, Vol. 271, No. 1-2, 2001, pp. 137-143. doi:10.1016/S0301-0104(01)00430-X
- O. P. Singh, Y. P. Singh, N. Singh and N. B. Singh, “Growth of Vanillin Crystals for Second Harmonic Generation (SHG) Applications in the Near-IR Wavelength Region,” Journal of Crystal Growth, Vol. 225, No. 2-4, 2001, pp. 470-473. doi:10.1016/S0022-0248(01)00918-6
- J. D. Bierlein, L. K. Cheng, Y. Wang and W. Tam, “Linear and Nonlinear Optical Properties of 3-Methyl-4- Methoxy-4’-Nitrostilbene Single Crystals,” Applied Physics Letters, Vol. 56, No. 5, 1990, pp. 423-425. doi:10.1063/1.102777
- G. S. Buhra, P. A. Chaloner, L. M. Dutta, W. Healy and P. B. Hitchcock, “Crystal Growth and Hydration Effects in Morpholinium 4-Hydroxybenzoate (M4HB),” Journal of Crystal Growth, Vol. 225, No. 2-4, 2001, pp. 474-478. doi:10.1016/S0022-0248(01)00937-X
- Z. D. Li, B. C. Wu and G. B. Su, “Nonlinear-Optical, Optical, and Crystallographic Properties of Methyl p-Hydroxybenzoate,” Journal of Crystal Growth, Vol. 178, No. 4, 1997, pp. 539-544. doi:10.1016/S0022-0248(97)00014-6
- A. A. Ballman, R. L. Byer, D. Eimerl, R. S. Feigelson, B. J. Feldman, L. S. Goldberg, N. Menyuk and C. L. Tang, “V. Inorganic Nonlinear Materials for Frequency Conversion,” Applied Optics, Vol. 26, No. 2, 1987, pp. 224-227. doi:10.1364/AO.26.000224
- H. Ünver, A. Karakas and A. Elmali, “Nonlinear Optical Properties, Spectroscopic Studies and Structure of 2-Hydroxy-3-Methoxy-N-(2-Chloro-Benzyl)-Benzaldehyde-Imine,” Journal of Molecular Structure, Vol. 702, No. 1-3, 2004, pp. 49-54. doi:10.1016/j.molstruc.2004.06.008
- A. Karakas and H. Ünver, “Third-Order Nonlinear Optical Properties and Structures of (E)-N-(4-Nitrobenzylidene)-2, 6-Dimethylaniline and (E)-N-(4-Nitrobenzylidene)-2,3-Dimethylaniline,” Spectrochimica Acta Part A: Molecular and Biomolecular Spectroscopy, Vol. 75, No. 5, 2010, pp. 1492-1496. doi:10.1016/j.saa.2010.02.004
- Y. X. Sun, Q. L. Hao, W. X. Wei, Z. X. Yu, L. D. Lu, X. Wang and Y. S. Wang, Journal of Molecular Structure, Vol. 929, 2009, p. 10.
- Y. Sun, Q. Hao, W. Wei, L. Lu and X. Wang, “Experimental and Density Functional Studies on 4-(4-Cyanobenzylideneamino)Antipyrine,” Molecular Physics, Vol. 107, No. 3, 2009, p. 223. doi:10.1080/00268970902769471
- Y. X. Sun, Q. L. Hao, W. X. Wen, X. Wei, Z. X. Yu, L. D. Lu, X. Wang and Y. S. Wang, Journal of Molecular Structure, Vol. 929, 2009, p. 10.
- Y. S. Sun, W. X. Wei, Q. L. Hao, L. D. Lu and X. Wang, Spectrochimica Acta Part A: Molecular and Biomolecular Spectroscopy, Vol. 73, 2009, p. 772.
- H. Ünver, A. Karakaş, A. Elmali, T. N. Durlu, Journal of Molecular Structure, Vol. 737, 2005, p. 131.
- H. Ünver and T. N. Durlu, Journal of Molecular Structure, Vol. 655, 2003, p. 369.
- V. N. Volodymr, Y. A. Mikhail, N. N. Vladimir, E. M. Craig, H. C. Beatriz and V. T. Tatiana, “Thermally Stable Heterocyclic Imines as New Potential Nonlinear Optical Materials,” Journal of Physical Chemistry B, Vol. 108, No. 25, 2004, pp. 8531-8539. doi:10.1021/jp0367528
- V. N. Volodymr, Y. A. Mikhail, N. N. Vladimir, G. P. Benjamin, O. F. Donald and V. T. Tatiana, “Thermally Stable Imines as New Potential Nonlinear Optical Materials,” Crystal Growth & Design, Vol. 4, No. 3, 2004, pp. 521-531. doi:10.1021/cg034068c
- M. J. Heravic, A. A. Khandar and I. A. Sheikshoaie, Spectrochimica Acta Part A: Molecular and Biomolecular Spectroscopy, Vol. 55, 1999, p. 2537.
- I. I. Oleinik, V. E. Romanov, I. V. Oleinik and S. S. Ivanchev, Journal of Organic Chemistry, Vol. 44, 2008, p. 107.
- M. Y. Malinkaya, N. I. Ivancheva, I. I. Olenik, G. H. Tolstikov and S. S. Ivanchev, “Catalytic Activity of Systems Based on Titanium Bis(Phenoxy Imine) Complexes: Effect of the Ligand Structure,” Russian Journal of Applied Chemistry, Vol. 80, No. 9, 2007, pp. 1515-1522. doi:10.1134/S1070427207090145
- A. Plagvet, M. Guillaume, B. Champagne, L. Rougier, F. Mancois, V. Rodriguez, J. L. Pozzo, L. Ducasse and F. Castet, “Investigation on the Second-Order Nonlinear Optical Responses in the Keto-Enol Equilibrium of Anil Derivatives,” Journal of Physical Chemistry C, Vol. 112, No. 14, 2008, pp. 5638-5645. doi:10.1021/jp711511t
- N. R. Sperandeo, A. Karlsson, S. Cuffini, S. Pagola and P. W. Stephens, “The Crystal Structure and Physicochemical Characteristics of 2-Hydroxy-N-[3(5)-Pyrazolyl]-1,4-Naphthoquinone-4-Imine, a New Antitrypanosomal Compound,” AAPS PharmSciTech, Vol. 6, No. 4, 2005, pp. E655-E663. doi:10.1208/pt060482
- N. I. Golovina, G. N. Nechiporvenko, I. N. Zyuzin, D. B. Lempert, G. G. Nemtsev, G. V. Shilov, A. N. Utenysnev and K. V. Bozhenko, “Several Aspects of Intermolecular Interactions between the Carbonyl and Imine Groups in the Crystals of Compounds Containing Six-Membered Heterocycles,” Journal of Structural Chemistry, Vol. 49, No. 5, 2008, pp. 909-916. doi:10.1007/s10947-008-0156-7
- T. Kishore Kumar, S. Janarthanan, S. Pandi, S. Selvakumar and D. Prem Anand, “Spectral, Dielectric, and Thermal Properties of Triketohydrindane Hydrate Single Crystals,” Crystal Growth & Design, Vol. 9, No. 5, 2009, pp. 2061-2064. doi:10.1021/cg701111e
- T. Kishore Kumar, S. Pandi, M. V. A. Raj, C. Maria Magdalene and D. Prem Anand, “Growth, Spectral, and Thermal Properties of Organic Nonlinear Optical Active Morpholin-4-ium-Hydroxybenzoate Single Crystal,” Materials and Manufacturing Processes, Vol. 25, No. 9, 2010, p. 978. doi:10.1080/10426914.2010.481001
- T. Kishore Kumar, D. Prem Anand, S. Selvakumar, S. Pandi and M. Nizam Mohideen, Acta Crystallographica. Section E, Structure Reports Online, Vol. 68, 2012, p. 299.
- K. Sankaranarayanan and P. Ramasamy, Journal of Crystal Growth, Vol. 280, 2005, p. 467.
- K. Hisatake, S. Tankas and A. Yovko, “Evaporation Rate of Water in a Vessel,” Journal of Applied Physics, Vol. 73, No. 11, 1993, p. 7395. doi:10.1063/1.354031
- D. L. Pavia, G. M. Lampman, G. S. Kriz, J. A. Vyvyan, “Introduction to Spectroscopy,” 4th Edition, Brookescole Publishers, California, 2008.
- J. Kułakowska and S. Kucharski, European Polymer Journal, Vol. 36, 2000, p. 1805.
- Y. F. Zhou, Materials Science and Engineering: B, Vol. 99, 2003, p. 593.
- I. D. L. Albert, T. J. Marks and M. A. Ratner, “Large Molecular Hyperpolarizabilities in ‘Push−Pull’ Porphyrins. Molecular Planarity and Auxiliary Donor-Acceptor Effects,” Chemistry of Materials, Vol. 10, No. 3, 1998, pp. 753-762. doi:10.1021/cm970478a
- U. Von Hundelshausen, Physics Letters A, Vol. 34, 1971, p. 405.
- C. Balarew and R. Duhlew, Journal of Solid State Chemistry, Vol. 55, 1984, p. 1.
NOTES
*Corresponding author.