Food and Nutrition Sciences
Vol.06 No.01(2015), Article ID:53087,9 pages
10.4236/fns.2015.61007
Nutritional Status and Dietary Habits of School Children in Beni-Suef Governorate, Egypt
Shaimaa B. Abdelaziz1*, Meray Rene Labib Youssef2, Amal S. Sedrak1, John Rene Labib2
1Department of Public Health, Faculty of Medicine, Cairo University, Egypt
2Department of Pediatric, Faculty of Medicine, Cairo University, Egypt
Email: *Shaimaabaher@yahoo.com, drmerayrene@yahoo.com, amal_sedrak@yahoo.com, johnrenelabib@gmail.com
Copyright © 2015 by authors and Scientific Research Publishing Inc.
This work is licensed under the Creative Commons Attribution International License (CC BY).
http://creativecommons.org/licenses/by/4.0/


Received 5 December 2014; revised 22 December 2014; accepted 30 December 2014
ABSTRACT
Objectives: Childhood malnutrition is a major concern in developing countries. Therefore, the present study aimed to determine the nutritional status and dietary habits of school children. Methods: This is a community based cross-sectional survey designed to evaluate nutritional status of students aged (5 - 19 years) in Beni-Suef Governorate, Egypt, during September-December 2013. A two-stage sampling technique was done; 22 government schools were selected in the first stage. In the second stage, 1100 students were selected from the target population of the study. Weight, height, and age data were used to calculate z-scores of the three different nutritional indicators. Dietary habits were studied using a food frequency questionnaire. Results: Underweight (WAZ < −2) and stunting (HAZ < −2) occurred in 10% and 53.2%, respectively. WAZ and HAZ mean scores of the children were −0.22 (SD = 1.39) and −2.09 (SD = 2.03), respectively. The malnourished children were classified on the basis of (WHO/NCHS) reference population BMI z-scores as being: 2.8% underweight (<−2SD) and 34.4% obese (>+2SD). Boys were more underweight (3%) than girls (2.2%). Conversely, girls tend to be more stunted (65.3%) compared to boys (59.9%) in the age group 10 - 14 years. Identified risk factors associated with malnutrition for those aged more than 10 years were: mother education (P-value = 0.03), father education (P-value = 0.04) and family size (P-value = 0.014). Conclusıon and Recommendatıons: Child’s nutritional status is strongly associated with the literacy of both parents and family size. The prevalence of malnutri- tion can be reduced by implementation of school intervention programs for the socioeconomic development.
Keywords:
Anthropometry, Children, Nutritional Status, School Age

1. Introduction
Malnutrition is one of the most important global health problems, affecting large numbers of children in developing countries [1] . Globally, malnutrition is an underlying or associated cause in at least half of all childhood deaths. Undernutrition alone is responsible for more than one-third of child deaths globally [2] , and accounts for 11 percent of the global burden of disease. It is more prevalent in low and lower-middle income countries [3] .
Malnutrition among school age children is a major public health concern. More than 200 million school age children are stunted and underweight; about one billion school children will be growing up by 2020 with impaired physical and mental development [4] .
School age is the active growing phase of childhood [5] ; it represents a dynamic period of physical growth as well as of mental development of the child. Children are particularly vulnerable to undernutrition as the priority in nutrition interventions is often to prevent malnutrition during fetal development and the first years of life [6] .
In developing countries it is postulated that poverty and ignorance are primary casual factors of malnutrition [7] . Overpopulation, more commonly seen in developing countries, can reduce food adequacy, leading to inadequate food intake or intake of foods of poor nutritional quality and quantity.
Research completed in recent years by The Egyptian National Nutrition Institute and other research centers showed that malnutrition was still a major health problem in Egyptian community among different age groups and socio-economic classes [8] [9] .
In Egypt, malnutrition disorders affect more than 30% of school children. This problem appears to be largely attributable to poor dietary quality and micronutrient deficiencies, such as iron and Vitamin A [10] .
The 2008 Egyptian Demographic and Health Survey (EDHS) showed that 5 percent of males and 3 percent of females aged from 10 - 19 in Egypt were considered to be underweight, i.e., their BMI values fell below the 5th percentile on the age and sex-specific BMI growth charts [11] .
School feeding offers an excellent opportunity for targeted intervention in this age group. Progress toward these ends is directly in line with Millennium Development Goals 1 and 2: to halve the proportion of people who suffer from hunger around the world, and to ensure that all children are able to complete a full course of primary school [12] .
The best global indicator of children’s well-being is growth. Assessment of growth is the single measurement that best defines the nutritional and health status of children, and provides an indirect measurement of the quality of life of the entire population. Therefore, the present study aimed to determine the nutritional status and dietary habits of school aged children (5 - 18 years) attending government schools in Beni-Suef Governorate, Egypt.
2. Methods
2.1. Study Design and Settings (Procedure)
This is a community based cross-sectional, national survey designed to evaluate nutritional status of students aged (5 - 19 years) in Beni-Suef Governorate, Egypt, during September-December 2013. Beni-Suef is one of the governorates of Egypt, situated in the center of the country, located about 120 km south of Cairo, on the west bank of the Nile River. It includes 8 Marakz, 8 cities, 39 rural local units annexed by 222 villages (71.4% rural, 28.6% urban). It has an area of 10,954 km2 and estimated population of 2,597,000 individual that constitutes 3.2% of total population in Egypt. School students aged 5 - 18 years (1,488,500) constitute 57.3% of total population in Beni-Suef Government [13] .
2.2. Participants
This cross-sectional study was conducted in Beni-Suef Governorate, Egypt. A two-stage sampling technique, with probability proportionate to the size of population and a constant number of students per school at the second stage, was used. In the first stage, 22 government schools (primary, preparatory and general secondary) were selected based on probability proportionate to the size of population in different communities of eight districts of Beni-Seuf. The 22 schools were selected to assume a valid estimate of the prevalence of the problem. The study covered both urban and rural areas. In the second stage, 58 students, aged 5 - 19 years, from each school were selected from the target population of the study. This sample size ensures, with probability of 95%, that the estimated prevalence is within 5% of the true prevalence 30% [10] , and assumption of a design effect of 2. The total required sample size stood at 1292 students, whereas the actual number of school students study was 1100. Sixty-eight students with known health complications were excluded. Due to absenteeism and incomplete data of 124 participants, 1100 participants eventually completed the anthropometric measures. These measurements were collected by a team of eight trained research assistants. Schools were visited once a week; the data was collected by interviewing and examining the students with help of their class teacher and mothers using a structured questionnaire.
2.3. Assessment of Nutritional Status by Anthropometry (Instruments)
Nutritional status of the students was assessed by anthropometric measurements. After we checked the scale for accuracy, weight was measured to the nearest 0.1 kg with an electronic scale with students wearing light clothing and without shoes. Student height was measured to the nearest 0.1 cm with a wooden stadiometer placed on a flat surface.
Weight, height, and age data were used to calculate z-scores of the three different nutritional indicators in comparison to the newly published World Health Organization/National Center for Health Statistics (WHO/ NCHS) reference population [14] using the WHO AnthroPlus Software (Version 10.4, 2010) [15] .
These indicators were underweight defined as weight-for age z-score (WAZ) < −2 SD, stunting defined as height-for age z-score (HAZ) < −2SD, and malnourished students aged more than 10 years (N = 655) defined as body mass index for age (BMI/A) z-score [<−2SD (underweight) or >+2SD (obese)]. Dietary habits have been studied depending on the questions addressed regarding daily and weekly consumption of common food groups [16] .
2.4. Data Analysis
Statistical analyses were performed using the Statistical Package for Social Sciences Version 16.0 for Windows. Means and standard deviations were calculated for bodyweight, stature and BMI (W/H2) across sex and age groups. The z-scores of (<−2SD) was calculated to illustrate WAZ and HAZ category of underweight and stunting, respectively. The malnourished children were classified on the basis of (WHO/NCHS) reference population BMI z-scores as being; underweight (<−2SD) and obese (>+2SD) [14] . Weight-for-age reference data are not available beyond age 10 because this indicator does not distinguish between height and body mass in an age period where many children are experiencing the pubertal growth spurt and may appear as having excess weight (by weight-for-age) when in fact they are just tall [15] .
Chi-square was used for testing the significance of association between the socioeconomic characteristics and students’ malnutrition. Student age was divided into three intervals (5 - 9 years), (10 - 14 years), (15 - 19 years) to illustrate the distribution of nutritional status among each age category. A probability value of less than 0.05 was considered statistically significant.
2.5. Ethical Consideration
Ethical approval and official permissions were primarily taken from both the Ministry of Health and Ministry of Education. Approval was obtained from the schools authorities prior to the commencement of the research. The teachers, students, and parents were well-informed of the scope and extent of the survey. Verbal consents of the parents and students were also obtained.
3. Results
The total sample included 1100 student with mean age 10.18 (±2.5) years. Of these students, 945 (85.9%) were girls, and 155 (14.1%) boys. The majority of the mothers were illiterate and not working; 1086 (98.7%) and 1092 (99.3%) respectively. One thousand and seventy (97.3%) fathers were illiterate and working as farmers. Most of the students 891 (81%) have large family size equal to or more than five persons.
Figures 1-3 illustrate students’ nutritional status in comparisons to the WHO reference growth curves. 10% of the students less than 10 years were underweight (<−2SD WAZ score), 53.2% of the whole sample were stunted (<−2SD HAZ score), whereas BMI z-score; <−2SD and >+2SD was 2.8% (underweight) and 34.4% (obese) respectively.
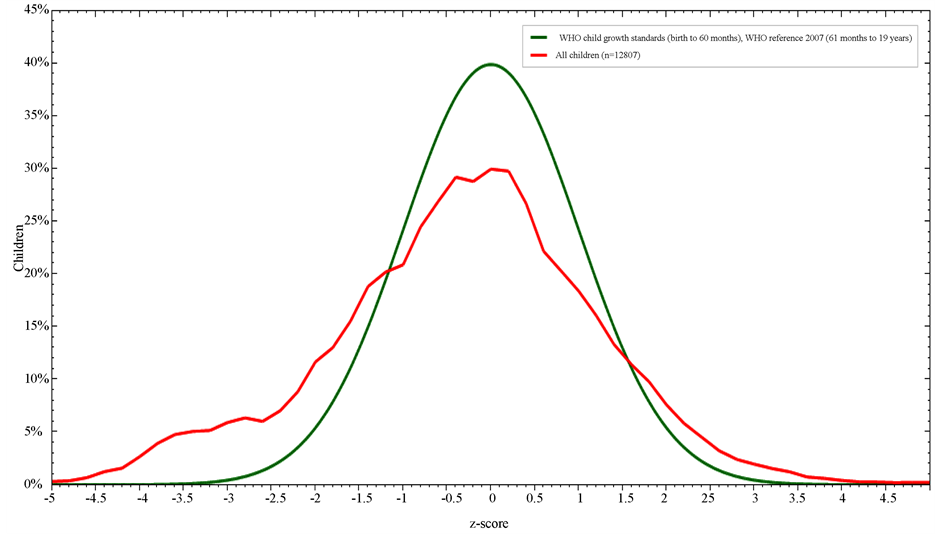
Figure 1. Weight-for-age z-score in comparison to WHO child growth standards.
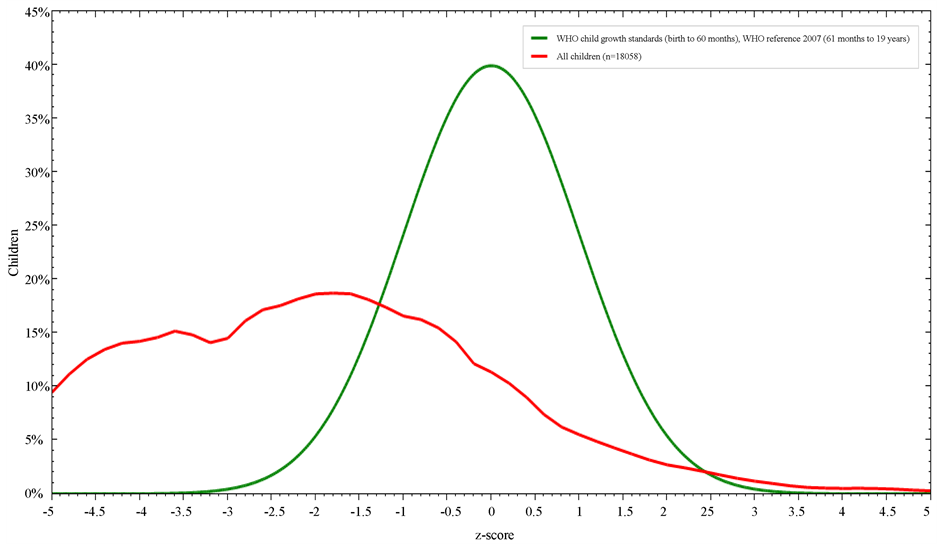
Figure 2. Height-for-age z-score in comparison to WHO child growth standards.
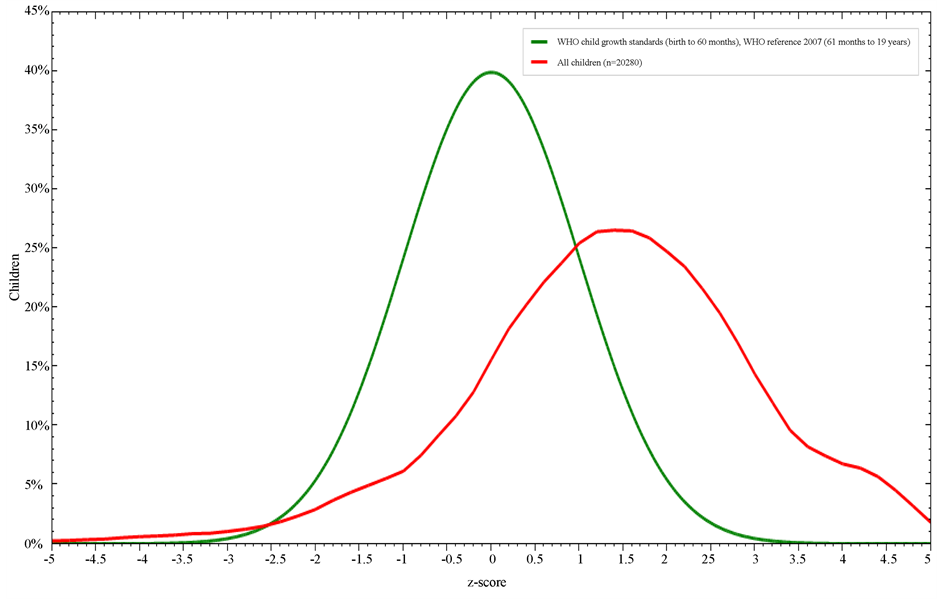
Figure 3. BMI-for-age z-score in comparison to WHO child growth standards.
Table 1 classified students’ nutritional status in comparisons to the WHO reference growth curves among different age groups, WAZ < −2SD in the age group 5 - 9 years was higher for boys (11%) than girls (5.1%). Overall the BMI mean was 1.36 ± 1.59 SD with a highest %<−2SD (4.6%) in the age group from 5 - 9 years, whereas the highest percent of %>+1SD (66.1%) and %>+2SD (37.3%) were in the age group from 10 - 14 years. Students tented to be more stunted (60.6%) between 10 - 14 years old.
Table 2 presents the gender- and age-specific means and standard deviations (SD) of height-for-age z-score (HAZ) and BMI-for-age z-score (BMI z-score) values. The percent of <−2SD height-for-age for boys and girls was 53.4% and 51.8% respectively. Boys are more stunted than girls expect for the age group from 10 - 14 years. Also percentage of BMI < −2SD was 3% and 2.2% for boys and girls respectively, girls are more obese as 35% had BMI > +2SD compared to 34.3% for boys expect in the age group from 10 - 14 years boys diagnosed to more obese.
Table 3 shows the association between malnutrition and various socioeconomic factors. The prevalence of malnutrition (< or >2SD) was significantly higher among underweight and obese students aged above 10 years (n = 655), of illiterate mothers and fathers [OR = 4.89, CI (24.42 - 0.979)] (P = 0.03) and [OR = 2.46, CI (6.126 - 0.995)] (P = 0.04) respectively. Also a significant higher percentage of large family size was detected among malnourished children compared to those of normal weight [OR = 1.488, CI (2.045 - 1.083)] (P = 0.014).
As regards food consumption and students’ nutritional status aged more than 10 years, Table 4 shows that statistically significant differences were found between students’ HAZ and those consuming; ≥3 or <3 times regarding the daily consumption of milk/milk products, vegetables, fruits, candies and cereals (grains, flour and rice). Another significant difference was detected between students’ BMI z-score and those consuming; ≥2 or <2 times regarding weekly consumption of red meat.
4. Discussion
Childhood malnutrition is a major concern in developing countries. The study provides anthropometric data (weight and height) on the nutritional status in a group of school children aged 5 - 19 years in, Beni-Suef Governorate, Egypt.

Table 1. Characteristics of the participants.
%<−2SD includes %<−3SD. %>+1SD includes %>+2SD and %>+3SD (overweight; equivalent to BMI of 25 at 19 years). %>+2SD includes >+3SD (obesity; equivalent to BMI of 30 at 19 years).
Table 2. Anthropometric indices of nutritional status in school children, by age and sex.
*Combined total for both sex; SD = standard deviation.
Underweight is most commonly used as a composite indicator to reflect both acute and chronic undernutrition [17] . The results of the present study indicated that 10% of the children are underweight in comparison to (WHO/NCHS) reference population [15] , the percent of WAZ < −2SD for boys and girls less than 10 years was
Table 3. Socioeconomic determinants of malnutrition.
*Statistically significant at (P < 0.05); n = number of participants; SD = standard deviation; CI = confidence interval.
Table 4. Consumption of different food groups in relation to students’ nutritional status.
*Statistically significant at (P < 0.05); n = number of participants; SD = standard deviation.
11% and 5.1% respectively. Similarly, results of another study [18] reported the prevalence of underweight occurring more in boys than girls.
Respectively, in the present study 5.8% and 1.5% of boys and girls aged from 10 - 19 years diagnosed to have BMI z-score < −2SD. In agreement with this, the Egyptian Demographic and Health Survey 2008 [11] , reported that 5 percent of males and 3 percent of females aged from 10 - 19 years in Egypt, were considered to be underweight, i.e., their BMI values fell below the 5th percentile on the age and sex-specific BMI growth charts. However boys in this study tended to be more obese in the age group from 10 - 14 years in comparison to girls, this could have been due to the effect of extension of cultural preference for boys [19] .
In this study, the prevalence of under nutrition particularly stunting is higher than underweight. Collectively, 53.2% of the students were <−2SD in comparison to WHO reference curves [15] . This figure is similar to the findings of other studies [20] [21] , but high when compared with others [22] [23] . This difference is likely to stem from differential nutritional intake, socioeconomic and cultural differences rather than differences in their genetic potential to achieve maximum height.
Stunting measures cumulative deficient growth associated with the long-term factors, including insufficient dietary intake, frequent infections and low socioeconomic status [14] . The relationship between stunting and gender varied. While some studies demonstrated a higher prevalence among males [24] [25] , others demonstrated a higher prevalence among females [19] .
Consistent with other previous studies in sub-Saharan Africa [23] [26] , our study showed stunting to be higher in male than in female children expect for the age group from 10 - 14 years. Boys from 5 - 10 years are more stunted this has been explained by sex differences in genetic and biological makeup, with boys being biologically weaker and more susceptible to diseases than girls [27] .
Another explanation for the fact that more boys aged 15 - 19 were stunted than girls could be because poor, stunted girls had dropped out of school leaving behind better-nourished girls or might be due to increased access to food at the older age when the females are culturally involved in the cooking of family-food, and hence, their better nutritional state compared to the male counterparts [19] .
However the decline in height compared to the NCHS reference in this study peaked at the age group of (10 - 14) years for both boys and girls, and this is similar to the finding among Zanzibari children [28] . This occurrence has been associated with the growth-spurt which either did not occur at all or occur later than is typical in well-nourished children. It is, therefore, important that the nutrient intake during this period must match the requirements for growth otherwise there will be growth retardation.
In agreement with most studies [19] [29] , low maternal education was a major determinant of malnutrition in the present study. Malnourished children of illiterate mothers and fathers were at risk of being malnourished in comparison to normal children. Expectedly, as the level of education of the mother increases, so do her finances and her contribution to the total family income [30] . Thus, educating women would be a useful step in the reduction of the prevalence of poor childhood nutrition, especially stunting.
These results are also in agreement with other studies [31] [32] among the same age group that report the Mothers’ educational level is as important underlying determinants that directly or indirectly cause malnutrition among children.
The underweight children in our study were more likely to have a significantly larger family size when compared with better nourished children. A larger family size is associated with an increased risk for malnutrition. The effect of a large family size with overcrowding and inadequate spacing has been implicated as a risk factor for severe malnutrition in different studies [33] [34] . This supports the notion that non-nutritional factors should be essential components in the effort to reduce malnutrition in developing countries.
The findings of this study showed that the contribution of the milk/milk products, vegetables, fruits food groups fell far below the recommendation of food based dietary guidelines [16] .
However the findings are similar to a study done in the Eastern Mediterranean Region [EMR] [9] , which reported a relatively low consumption of vegetables and fruits in most of the developing countries and also another one done in Kenya [35] .
Children stunted at school age are likely to be exposed to poor nutrition since early childhood [36] . The high levels of stunting among boys could have been contributed to inadequate red meat intake among the malnourished children.
Consumption of animal source foods was found to be associated with a decreased risk of stunting and underweight. A study that was conducted by Dror and Allen, 2011 reported that consuming animal source foods not only decreased stunting but also improved other anthropometric indices toward the reduction of morbidity and mortality among undernourished children [37] .
In this regard, the nutritional status of children in the developing countries should be emphasized not only for the improvement of health of children in the coming generation, but also for the overall development of the concerned region in the future.
5. Conclusion and Recommendations
Malnutrition among students is a major public health problem in Egypt. Besides poverty, there are other factors that directly or indirectly affect the nutritional status of students. Literacy and social status of the family are key factors contributing to malnutrition in students. The present study highlights the prevalence of malnutrition among school going students in Beni-Suef Governorate in Egypt and the prevalence can be reduced by increasing awareness in mother regarding the nutritional intake of the student [21] . Also, there is a great need to focus the attention of policy-makers on the nutritional status of students as one of the main indicators for implementation of school intervention programs and as a precondition for the socioeconomic development in the long term.
Acknowledgements
To all health care providers and students in the studied schools, for their great cooperation and continuous support.
References
- Filiz, E., Pýnar, O., Gonca, A. and Erdal, B.E. (2007) Nutritional Status and Risk Factors of Chronic Malnutrition in Children under Five Years of Age in Aydýn, a Western City of Turkey. Turkish Journal of Pediatrics, 49, 283-289.
- Black, R.E., Allen, L.H., Bhutta, Z.A., et al. (2008) Maternal and Child Undernutrition: Global and Regional Exposures and Health Consequences. Lancet, 371, 243-260. http://dx.doi.org/10.1016/S0140-6736(07)61690-0
- UNICEF (2007) State of the World’s Children 2008. United Nations Children’s Fund, New York.
- UNICEF (2011) Levels and Trends in Child Mortality. Estimates Developed by the UN Inter-Agency Group for Child Mortality Estimation.
- UNICEF (2004) The State of World’s Children. http://www.unicef.org/sowc04/files/SOWC_O4_eng.pdf
- Bundy, D., Burbano, C., Grosh, M., Gelli, A., Jukes, M. and Drake, L. (2009) Rethinking School Feeding: Social Safety Nets, Child Development and the Education Sector. The International Bank for Reconstruction and Development. The World Bank, Washington DC. http://dx.doi.org/10.1596/978-0-8213-7974-5
- Odunayo, S.I. and Oyewole, A.O. (2006) Risk Factors for Malnutrition among Rural Nigerian Children. Asia Pacific Journal of Clinical Nutrition, 15, 491-495.
- Emam, S., Mostafa, R., Wassef, O., et al. (2005) Assessment of Nutritional Status of Some Primary School Children & Their Awareness in Slum Areas. Alexandria Journal of Pediatrics, 19, 113-119.
- World Health Organization (2010) Country Cooperation Strategy for WHO and Egypt 2010-2014. WHO Regional Office for the Eastern Mediterranean, Cairo. http://www.who.int/countryfocus/cooperation_strategy/ccs_egy_en.pdf
- Galal, O.M., Ismail, I., Gohar, A.S. and Foster, Z. (2005) Schoolteachers’ Awareness about Scholastic Performance and Nutritional Status of Egyptian Schoolchildren. Food and Nutrition Bulletin, 26, S275-S280.
- El-Zanaty, F. and Way, A. (2009) Egypt Demographic and Health Survey 2008. Demographic and Health Surveys, Ministry of Health, Cairo.
- United Nations (2008) Millennium Development Goals. Department of Public Information. http://www.un.org/millenniumgoals/index.shtml
- Central Agency of Public Mobilization and Statistics (CAPMAS) (2011) Egypt in Figures Statistics. http://www.capmas.gov.eg
- World Health Organization (WHO) and United Nations Children’s Fund (UNICEF) (2009) WHO Child Growth Standards and the Identification of Severe Acute Malnutrition in Infants and Children. Department of Child and Adolescent Health and Development, World Health Organization Press, Geneva.
- Blössner, M., Siyam, A., Borghi, E. and Onyango, A. (2010) WHO AnthroPlus Software. WHO, Department of Nutrition for Health and Development, Geneva. http://www.who.int/childgrowth/software/anthro_pc_manual.pdf
- World Food Programme (2010) Hunger. http://www.wfp.org/hunger/faqs
- Bose, K., Bisai, S., Chakraborty, J., Dutta, N. and Banerjee, P. (2008) Extreme Levels of Underweight and Stunting among Pre-Adolescent Children of Low Socioeconomic Class from Madhyamgram and Barasat, West Bengal, India. Collegium Antropologicum, 32, 73-77.
- Fetuga, M.B., Ogunlesi, T.A., Adekanmbi, A.F. and Alabi, A.D. (2011) Growth Pattern of Schoolchildren in Sagamu, Nigeria Using the CDC Standards and WHO Standards 2007. Indian Pediatrics, 48, 523-528. http://dx.doi.org/10.1007/s13312-011-0094-x
- Chowdhury, S.D., Chakraborty, T. and Ghosh, T. (2008) Prevalence of Undernutrition in Santal Children of Puruliya District, West Bengal. Indian Pediatrics, 45, 43-46.
- Goon, D.T., Toriola, A.L., Shaw, B.S., et al. (2011) Anthropometrically Determined Nutritional Status of Urban Primary Schoolchildren in Makurdi, Nigeria. BMC Public Health, 11, 769. http://www.biomedcentral.com/1471-2458/11/769 http://dx.doi.org/10.1186/1471-2458-11-769
- Som, S., Pal, M. and Bharati, P. (2007) Role of Individual and Household Level Factors on Stunting: A Comparative Study in Three Indian States. Annals of Human Biology, 34, 632-646. http://dx.doi.org/10.1080/03014460701671772
- Bamji, M.S. (2003) Early Nutrition and Health―Indian Perspective. Current Science, 85, 1137-1142.
- Gür, E., Can, G., Akkus, S., Ercan, G., Arvas, A., Güzelöz, S., et al. (2006) Is Undernutrition a Problem among Turkish School Children? Which Factors Have an Influence on It? Journal of Tropical Pediatric, 52, 421-426. http://dx.doi.org/10.1093/tropej/fml031
- Senbanjol, I.O., Oshikoyal, K.O., Olumuyiwa, O.O., et al. (2011) Prevalence of and Risk Factors for Stunting among School Children and Adolescent in Abeokuta, Southwest Nigeria. The Journal of Health, Population and Nutrition, 29, 364-337.
- Oninla, S.O., Owa, J.A., Onayade, A.A. and Taiwo, O. (2007) Comparative Study of Nutritional Status of Urban and Rural Nigerian School Children. Journal of Tropical Pediatrics, 53, 39-43. http://dx.doi.org/10.1093/tropej/fml051
- Semproli, S. and Gualdi-Russo, E. (2007) Childhood Malnutrition and Growth in a Rural Area of Western Kenya. American Journal of Physical Anthropology, 132, 463-469. http://dx.doi.org/10.1002/ajpa.20470
- Mikki, N., Abdul-Rahim, H.F., Awartani, F. and Holmboe-Ottesen, G. (2009) Prevalence and Sociodemographic Correlates of Stunting, Underweight, and Overweight among Palestinian School Adolescents (13 - 15 Years) in Two Major Governorates in the West Bank. BMC Public Health, 9, 485. http://dx.doi.org/10.1186/1471-2458-9-485
- Pongou, R. (2013) Why Is Infant Mortality Higher in Boys than in Girls? A New Hypothesis Based on Preconception Environment and Evidence from a Large Sample of Twins. Demography, 50, 445-446. http://dx.doi.org/10.1007/s13524-012-0183-z
- Stoltzfus, R.J., Albonico, M., Tielshch, J.M., Chwaya, H.M. and Savioli, L. (1997) Linear Growth Retardation in Zanzibari School Children. Journal of Nutrition, 127, 1099-1105.
- Semba, R.D., De Pee, S., Sun, K., Sari, M., Akhter, N. and Bloem, M.W. (2008) Effect of Parental Formal Education on Risk of Child Stunting in Indonesia and Bangladesh: A Cross Sectional Study. The Lancet, 371, 322-328. http://dx.doi.org/10.1016/S0140-6736(08)60169-5
- Nabag, F.O. (2011) Comparative Study of Nutritional Status of Urban and Rural School Girls’ Children Khartoum State, Sudan. Journal of Science and Technology, 12, 60-68.
- Adegun, J.A., Ajayi-Vincent, O.B. and Alebiosu, E.O. (2013) Differences in the Nutritional Status of Young School Children from Public and Private Owned Primary Schools in Ekiti State, Nigeria. European Scientific Journal, 9.
- Haidar, J., Abate, G., Kogi-Makau, W. and Sorensen, P. (2005) Risk Factors for Child Under-Nutrition with a Human Rights Edge in Rural Villages of North Wollo, Ethiopia. East African Medical Journal, 82, 625-630.
- Odunayo, S.I. and Oyewole, A.O. (2006) Risk Factors for Malnutrition among Rural Nigerian Children. Asia Pacific Journal of Clinical Nutrition, 15, 491-495.
- Ministry of Health (MoH) and United Nations International Children’s Education Fund (UNICEF) (2001) National Micronutrient Survey Report 1999. Anemia and Status of Iron, Vitamin A and Zinc in Kenya. UNICEF, 93 p.
- World Food Programme (WFP) (2004) School Children Nutrition. WFP, London, 69 p.
- Dror, D.K. and Allen, L.H. (2011) The Importance of Milk and Other Animal-Source Foods for Children in Low-Income Countries. Food and Nutrition Bulletin, 32, 227-243.
NOTES

*Corresponding author.