Food and Nutrition Sciences
Vol.5 No.16(2014), Article
ID:49238,15
pages
DOI:10.4236/fns.2014.516173
Soybean Seed Nutrition as Affected by Cotton, Wheat, and Fallow Rotation
Nacer Bellaloui1, Salliana R. Stetina1, William T. Molin2
1USDA, ARS, Crop Genetics Research Unit, Stoneville, MS, USA
2USDA, ARS, Crop Production Systems Research Unit, Stoneville, MS, USA
Email: nacer.bellaloui@ars.usda.gov
Copyright © 2014 by authors and Scientific Research Publishing Inc.
This work is licensed under the Creative Commons Attribution International License (CC BY).
http://creativecommons.org/licenses/by/4.0/


Received 4 July 2014; revised 6 August 2014; accepted 15 August 2014
ABSTRACT
Limited information is available on the effects of crop rotation on seed nutrition. Therefore, the objective of the current research was to determine whether crop rotations are beneficial to soybean seed nutrition for the first two complete rotation cycles in an experiment conducted from 2007 through 2012. The first complete rotation cycle (experiment one) was conducted in 2009, then repeated in 2010, and the second complete rotation cycle (experiment two) was conducted in 2011, and then repeated in 2012. The rotation sequences were: wheat-late cotton-fallow-soybean (WCFS), fallow-cotton-wheat-soybean (FCWS), and fallow-cotton-fallow-soybean (FCFS). The results showed that WCFS and FCFS resulted in higher seed oil, palmitic and stearic acids, glucose, sucrose, fructose, Fe, P, and B. No consistent effects on seed protein, oleic acid, linoleic acid, linolenic acid, raffinose, stachyose, and Mn contents were observed. These changes were accompanied by higher P, K, B, Fe in soil and N, K, and B in leaves, indicating that soil and leaf nutrients may result in continuous supply and mobility of nutrients from leaves to seed during seed fill. Our research demonstrated that crop rotation management can result in seed nutrient changes, affecting seed quality.
Keywords:Fatty Acids, Nutrients, Oil, Protein, Sugars

1. Introduction
Soybean seed quality is determined by seed nutrients composition (protein, oil, fatty acid, sugars, and minerals). Protein concentration in seeds ranges from 341 to 568 g∙kg−1 and oil from 83 to 279 g∙kg−1 [1] . Oil contains saturated fatty acids, including palmitic (10% - 12%), stearic (2.2% - 7.2%) [2] , oleic acid (24%), linoleic acid (54%), and linolenic acid (8%) [3] . Total soluble sugar in seeds is about 9% - 12%, including sucrose (4% - 5%), raffinose (2%), and stachyose (3.5% - 4.5%) [4] . The role of mineral nutrition in soybean seed quality was previously reported [5] -[9] . High oleic fatty acid and low linolenic fatty acid in seeds are desirable for oil processing because they contribute to oxidative stability of the oil. High sucrose, glucose, and fructose are desirable because they contribute to soybean flavor and taste, but high raffinose and stachyose are not desirable because they are indigestible and they cause flatulence or diarrhea in non-ruminants such as chicken and pigs [10] .
Beneficial effects of crop rotation for yield, weed and disease control, soil fertility, and soil structure were previously reported, for example [11] -[18] . However, limited information is available on the effects of crop rotation on soybean seed nutrition [11] , especially seed protein, oil, fatty acids, and sugars. Previous literature showed that in conventional-till and no-till systems in seven rotations of soybean and corn, conducted in 1996 through 2005, protein concentration decreased from 357 mg∙kg−1 in first-year soybean following five consecutive years of corn to 351 mg∙kg−1 in fifth-year soybean following five consecutive years of corn under conventional system. They reported that protein concentration had no clear trend in the no-till system, but oil concentration increased at similar rates in conventional-till and no-till systems as years of continuous soybean production increased [11] . It was found that soil N levels often increased when a N-fixing crop was included in the rotation [19] , and increased N availability to subsequent crops [13] . Although the effects of rotation on soil mineral status are obvious, it was concluded that the explanation of rotation effects is beyond soil mineral status alone [20] . For example, it was found that crop rotation improved soil structure [14] , soil organic matter [15] , water use efficiency [16] , enhanced mycorrhizal associations [21] , improved grain quality [17] and crop nutrient use efficiency [16] , decreased the variability in grain yield [18] , improved weed control, and interrupt insect and disease cycles [16] . Maintaining optimum nutrient concentrations in soil resulted in higher seed protein and oleic fatty acid percentages [5] . A positive correlation of boron (B) with protein and oleic acid was also found [5] , suggesting an indirect role of B with seed composition. This observation was supported by previous research when foliar B application increased soybean seed protein and oleic acid concentrations [16] .
In spite of the tremendous efforts devoted to study the beneficial effects of crop rotation on yield, little information is available on the effects of crop rotation on soybean seed composition. Therefore, the objective of the current research was to evaluate three cropping sequences on seed protein, oil, fatty acids, sugars, and mineral nutrients under Midsouth USA conditions.
2. Materials and Methods
2.1. Field Management and Growth Conditions
A field experiment was conducted in Stoneville, MS (33˚26'N, 90˚91'W), and repeated in a different field with the same Dundee silty clay loam (fine-silty, mixed, active, thermos TypicEndoaqualfs) soil type in 2007 through 2012. The experiment reported here is a part of a large experiment designed to evaluate the effects of crop rotation on nematode and weed control, using different crop rotation sequences including wheat, cotton, sorghum, and soybean. We focus here only on two complete rotation cycles ending in soybean. Two repeated experiments were conducted. Experiment one (Exp 1) was conducted in 2009 (repeat measure 1) and 2010 (repeat measure 2) (Table 1). Experiment two (Exp 2) was conducted in 2011 (repeat measure 1) and 2012 (repeat measure 2) (Table 1). Experiment one refers to the first complete crop rotation cycle, and experiment 2 refers to the second complete crop rotation cycle. The rotation sequences were wheat-late cotton-fallow-soybean (WCFS), fallow-cotton-wheat-soybean (FCWS), and fallow-cotton-fallow-soybean (FCFS). Planting and harvest dates for summer and winter crops included in the rotations are summarized in Table 1 and were typical for this region. Plots of each crop species were 4 rows wide (1 m row spacing) and 17 m long. Standard fertilizer, weed control, and insect management practices for Mississippi were followed for soybean [22] , cotton, and wheat [23] crops included in the rotation.
Soybean varieties were Asgrow AG 4404 RR (Monsanto, Inc., St. Louis, MO) in 2009 and 2010; Asgrow AG 4605 RR (Monsanto, Inc., St. Louis, MO) in 2011, and Armor DK 4744 RR2 (Armor Seed, LLC, Fisher, AR) in 2012. The full season cotton variety was Deltapine DPL 161 B2RF (Monsanto, Inc., St. Louis, MO), and the late planted cotton variety was Deltapine DPL 117 B2RF (Monsanto, Inc., St. Louis, MO) for all years. Wheat varieties were Terral LA841 (Terral Seed, Rayville, LA) in 2007, Agripro Beretta (Syngenta Cereals, Berthoud, CO) in 2008, Georgia Gore (University of Georgia Agricultural Experiment Station, Athens, GA) in 2009, Ranger

Table 1 . Planting and harvest dates for summer and winter crops included in the rotation sequences in two field experiments in Stoneville, MS.
Wheat plots planted later than recommended.
30127 (MBS Seed, Ltd., Denton, TX) in 2010 and 2011, and Croplan Genetics 38206 (Croplan Genetics, St. Paul, MN) in 2012. The use of cultivars in each year was based on market availability. Plots were furrow irrigated as needed during the summer season. The two center rows of each soybean plot were mechanically harvested with a Gleaner K2 (Allis-Chalmers, Milwaukee, WI) equipped with a weigh basket.
A random sample of 15 - 20 soybean leaves (fully expanded leaves) at seed-fill stage (R5-R6) were collected from the middle two rows of each plot. The leaves were taken only from the top third of the plant to assure consistency and avoid variability. A 2000 cm3 sample of seed was taken from the weigh basket at harvest. Soil samples were collected from each plot at planting and at harvest during the summer cropping season. Six soil cores (30 cm deep and 2.5 cm in diameter) from the center two rows of each plot were combined. Leaves, seeds, and soil samples were processed and nutrients were determined as described below.
2.2. Soil Minerals, N, and C Analysis
Soil minerals (macroand micro-nutrients), N, S, and C were analyzed at The University of Georgia’s Soil, Plant, and Water Laboratory, Athens, GA. The concentration of K and Mn was determined using a 5-g soil: 20 ml Mehlich-1 solution and analyzed using inductively coupled plasma (ICP) spectrometry (ICP). For N, S, and C, the analysis was conducted on a 0.25-g sample of soil by combusting samples in an oxygen atmosphere at 1350˚C, converting elemental nitrogen, sulfur, and carbon into N2, SO2, and CO2. These gases are then passed through infrared cells and N, S, and C were determined by elemental analyzer using thermal conductivity cells (LECOCNS-2000 elemental analyzer LECOCorporation, St. Joseph, MI, USA).
2.3. Leaf and Seed Minerals and N Analysis
Leaves and mature seeds at R8 stage were analyzed for minerals and N concentration by digesting 0.6 g of dried, ground seed in HNO3 in a microwave digestion system. Samples were ground to pass through 1-mm sieve using a Laboratory Mill 3600 (Perten, Springfield, IL). The concentrations of minerals (K and Mn) were determined using inductively coupled plasma spectrometry (ICP) [7] [8] . For N measurement, a 0.25 g ground-dried sample was used, and the concentration was determined using a LECOCNS-2000 elemental analyzer LECOCorporation, St. Joseph, MI, USA) [7] . Boron, Fe and P concentrations were determined as described below.
2.4. Seed Analysis for Protein, Oil, and Fatty Acids
Seeds at harvest maturity (R8 stage) were collected from each plot and analyzed for protein, oil, and fatty acids. Briefly, a sample of 25 g of seed was ground using the Laboratory Mill 3600 and analyzed by near infrared reflectance [24] [25] using a diode array feed analyzer AD 7200 (Perten, Springfield, IL, USA). The calibration equation was developed by the University of Minnesota using Perten’s Thermo Galactic Grams PLS IQ software, and the calibration curve was established using AOAC methods [26] [27] . Protein and oil contents were determined based on a seed dry matter basis [8] [24] [28] and contents of palmitic, stearic, oleic, linoleic, and linolenic fatty acids were performed on the total oil basis [8] .
2.5. Seed Analysis for Sucrose, Raffinose, and Stachyose
Seeds at R8 were collected for sugar analysis. Briefly, a sample of 25 g of seed from each plot was ground using the Laboratory Mill 3600 and analyzed by near infrared reflectance (NIR) [9] [24] [43] using the AD 7200 array feed analyzer. Analyses of sugars were performed based on a seed dry matter basis [9] [24] [28] .
2.6. Glucose Determination in Seed
Glucose concentration in seed was determined by an enzymatic reaction using a Glucose (HK) Assay Kit, Product Code GAHK-20 (Sigma-Aldrich Co, St Louis, MO, USA). During this reaction, glucose is phosphorylated by adenosine triphosphate (ATP) and catalyzed by hexokinase. The glucose-6-phosphate (G6P) produced is then oxidized to 6-phosphogluconate by oxidized nicotinamide adenine dinucleotide (NAD) in a reaction catalyzed by glucose-6-phosphate dehydrogenase (G6PDH). An equimolar amount of NAD is then reduced to NADH, and the increase in absorbance at 340 nm is directly proportional to the glucose concentration in the sample. Seed samples were ground using the Laboratory Mill 3600 to obtain uniform particles. Briefly, a random sample of 0.1 mg was extracted with deionized water. Then, the sample solution was heated by heat plate to aid extraction. The extract was diluted to 1:100 with deionized water to obtain a range of 0.05 to 5 mg glucose ml−1. A 100-μl sample was added to 1 ml of the Glucose (HK) Assay Reagent and then incubated at room temperature for 15 min. A sample blank consisting of 100 μl of sample and 1ml of deionized water, and a reagent blank consisting of 1ml of Glucose (HK) Assay Reagent and 100 μl of deionized water were prepared. The concentration of the glucose was determined by reading the samples at absorbance of 340 nm using the Beckman Coulter DU 800 spectrophotometer. The concentration of glucose was expressed as mg·g−1·dwt.
2.7. Fructose Determination in Seed
Fructose concentration in seed was determined based on an enzymatic reaction using a Fructose Assay Kit, Product Code FA-20 (Sigma-Aldrich Co., St. Louis, MO, USA). During this reaction, fructose in this reaction is phosphorylated by ATP in a reaction catalyzed by hexokinase. The resulted fructose 6-phosphate is converted to G6P by phosphoglucose isomerase (PGI). Then, G6P was oxidized to 6-phosphogluconate in the presence of NAD in a reaction catalyzed by glucose-6-phosphate dehydrogenase (G6PDH). An equimolar amount of NAD is then reduced to NADH, and the increase in absorbance at 340 nm is directly proportional to fructose concentration in a sample. Seed samples were ground using the Laboratory Mill 3600 as described above. A sample of 0.1 mg was extracted with deionized water, then heated by heat plate to aid extraction. The extract was then diluted to 1:100 with deionized water to obtain a concentration of 100 - 1000 µg fructose ml−1. A sample of 100 μl was added to 2 ml of the Glucose Assay Reagent and 0.02 ml PGI and incubated at room temperature for 15 min. A sample blank and a sample of Glucose Assay Reagent blank and PGI blank were prepared as recommended by the manufacturer (Fructose Assay Kit, Product Code FA-20, Sigma-Aldrich Co., St. Louis, MO, USA). The concentration of fructose was determined by reading the samples absorbance at 340 nm using the Beckman Coulter DU 800 spectrophotometer. The concentration of seed fructose was expressed as mg·g−1·dwt.
2.8. Boron Determination
Concentrations of B in leaves and mature seeds at R8 were determined using the Azomethine-H method [29] [30] . Briefly, a sample of 1.0 g was ashed at 500˚C and then extracted with 20 ml of 2 M HCl at 90˚C for 10 minutes and filtered. Then, a 2-ml sample of the filtered mixture was added to 4 ml of buffer solution (containing 25% ammonium acetate, 1.5% EDTA, and 12.5% acetic acid) and 4 ml of freshly prepared azomethine-H solution (0.45% azomethine-H and 1% of ascorbic acid) [31] . Boron concentration in leaves and seeds was determined in the samples after color development at 420 nm using a Beckman Coulter DU 800 spectrophotometer (Beckman Coulter, Inc., Brea, CA, USA).
2.9. Iron Determination
Concentrations of Fe in leaves and mature seeds at R8 were determined after acid wet digestion, extraction, and reaction of the reduced ferrous Fe with 1,10-phenanthroline according to the methods [32] [33] . Briefly, a random sample of 2 g of dried ground leaves or seeds was acid digested, and then the acids were removed by volatilization. The soluble constituents were dissolved in 2 M of HCl. An aliquot of 4 ml containing 1 - 20 µg of iron of the sample solution was transferred into a 25-ml volumetric flask and diluted to 5 ml using 0.4 M HCl. A volume of 1 ml of Quinol solution was added to the 5 ml diluted sample solution and mixed. Then, 3 ml of the phenanthroline solution and 5 ml of the tri-sodium citrate solution (8% w/v) was added. The solution was diluted to 25 ml with distilled water and incubated at room temperature for 4 h. The phenanthroline solution of 0.25% (w/v) was prepared in 25% (v/v) ethanol, and the quinol solution (1% w/v) reagent was prepared on the day of use. Standard solutions to establish standard curves of Fe ions were prepared in 0.4 M HCl, and ranged from 0.0 to 4 μg·ml−1 of Fe using FeSO4. The concentrations of Fe in the samples were determined using the Beckman Coulter DU 800 spectrophotometer after reading the absorbance at 510 nm.
2.10. Phosphorus Determination
Phosphorus concentration in leaves and mature seeds at R8 was performed according to Cavell [34] . Phosphorus measurement was carried out spectrophotometrically as the yellow phosphor-vanado-molybdatecomplex [9] [34] . Briefly, a 2-g dried, ground leaf or seed sample was ashed to completely destroy organic matter. Ten ml of 6 M HCl was added to the ashed samples, and the samples were placed in a water bath at 100˚C to evaporate the solution to dryness. Then, samples were kept under heat, and 2 ml of 36% v/v HCl was added and the samples were boiled. After adding 10 ml of distilled water, the solution was boiled for a few seconds and transferred to a 50-ml volumetric flask, diluted to 50 ml with distilled water and filtered. Five ml of 5 M HCl and 5 ml of ammonium molybdate-ammonium metavanadate reagent were added to 5 ml of the filtrate. After diluting the solution to 50 ml with distilled water, the solution was allowed to stand for 30 minutes. Ammonium molybdateammonium metavanadate was prepared in 500 ml of distilled water by dissolving 25 g of ammonium molybdate and 1.25 g of ammonium metavanadate. The concentration of P was measured after color development by reading the absorbance at 400 nm using the Beckman Coulter DU 800 spectrophotometer. To establish the P standard curve, standard solutions of P concentrations ranging from 0 - 50 μg∙ml−1 were prepared using dihydrogen orthophosphates.
2.11. Experimental Design and Statistical Analysis
The experimental design was a split plot with treatment (crop rotation) as the main plot, and rotation cycle as the sub-plot. Since within each rotation cycle the rotation sequence involving soybean was repeated twice, rotation sequence was considered as repeated measure (Repeat). Plots were arranged in a randomized complete block design with four replications, with Repeat, Rep (Repeat), Repeat × Treat, Repeat × Exp, Repeat × Treat × Exp, Rep × Exp (Repeat), Rep × Treat (Repeat) modeled as random effect, and Treat (crop rotation), Experiment (Exp: the first 2-year cycle and the second 2-year cycle), and Treat × Exp modeled as fixed effects. Therefore, random effect factors were considered as covariance parameters and their estimated residuals were indicated in Table 2 and Table3 Residual values in Table 2 and Table 3 refer to Restricted Maximum Residual Likelihood (REML), which reflects the total variance of the random parameters in the model. Analysis of variance was conducted using a Proc Mixed model in SAS [35] . Means were separated by Fisher’s least significant difference test at the 5% probability level.
3. Results and Discussion
3.1. Analysis of Variance
Analyses showed that crop sequence had a significant effect on seed oil, sucrose, stachyose, glucose, P, and B contents, but had no effect on seed protein, palmitic acid, oleic acid, linoleic acid, linolenic acid, fructose, raffinose
Table 2. Analysis of variance (F and P values) for the effect of crop sequence (Treat), rotation cycle (Exp), and their interactions (Treat × Exp) on seed protein, oil, fatty acids (%), sugars (mg∙g−1), and P (%), and Fe, B, and Mn (mg∙kg−1). The experiment was conducted in 2007 through 2012 under Mississippi delta region conditions.
Level of significance at P ≤ 0.05.Values in this entire row refer to Restricted Maximum Residual Likelihood (REML). *Significance at P ≤ 0.05; **Significance at P ≤ 0.01; ***Significance at P ≤ 0.001.
Table 3. Analysis of variance (F and P values) for the effect of each experiment (Experiment one and experiment two) (Exp), crop sequence (Treat), and their interactions (Exp × Treat) on seed protein, oil, fatty acids (%), sugars (mg∙g−1), and P (%), and Fe, B, and Mn (mg∙kg−1). The experiment was conducted in 2007 through 2012 under Mississippi delta region conditions.
Values in this entire row refer to Restricted Maximum Residual Likelihood (REML). *Significance at P ≤ 0.05; **Significance at P ≤ 0.01; ***Significance at P ≤ 0.001.
Fe, and Mn contents (Table 2). Experiment (Exp) had a significant effect on palmitic acid and stachyose contents, indicating that these constituents responded differently in each Exp. The contents of seed oil, protein, stearic acid, linoleic acid, linolenic acid, sucrose, glucose, Fe, P, and Mn were not affected by Exp, indicating that these constituents had similar response in each Exp. The interaction between Exp and Treatment (Treat) was significant only for stachyose and glucose contents, indicating similar effects of crop rotation on all other seed constituents, except these two constituents.
To evaluate in detail the effect of rotation sequence in each year, analysis of variance was conducted where Proc Mixed model included both Year and Treat (rotation sequence) (Table 3). The results of both analyses showed that Treat had significant effects on seed oil, sucrose, stachyose, glucose, P, Fe, and B, but no significant effects were observed on other seed constituents. Year showed significant effects on protein, stearic acid, palmitic acid, oleic acid, linoleic acid, linolenic acid, sucrose, fructose, stachyose, Fe, P, and B. The significant effect of Year on some seed constituents in the analyses indicated that these constituents showed different response in each year, which may be due to precipitation and temperature differences between years and biotic factors, including cultivar differences, and disease and pest pressure. Differences in precipitation (mm) and temperature (˚C) [36] during all soybean cropping seasons (2008-2012) are shown in Figure 1 and Figure 2. Year × Treat interactions showed significant effects on protein, palmitic acid, stearic acid, oleic acid, linolenic acid, stachyose, fructose, and Fe, but no effects of Year × Treat on oil, linoleic acid, sucrose, raffinose, glucose, B, P, and Mn were observed.
3.2. Effect of Rotation Sequence on the Mean Value of Seed Composition Constituents
Because Exp × Treat was significant for some seed composition constituents, results were presented by each experiment (Experiment 1 and Experiment 2) (Table 4 and Table 5). In Experiment 1 and comparing with the rotation sequence FCWS, both FCFS and WCFS resulted in higher oil, palmitic acid, stearic acid, sucrose, glucose, fructose, Fe, P, and B. No effects of rotation on protein, oleic acid, linolenic acid, raffinose, and Mn were observed. Rotation FCWS resulted in higher stachyose, opposing the trend of sucrose in FCFS and WCFS. In Experiment 2, rotation sequence FCFS and WCFS resulted in higher content of protein, oil, palmitic acid, stearic acid, sucrose, glucose, fructose, Fe, P, and B, and Mn concentrations than rotation sequence FCWS. No effects of crop rotation were observed on oleic acid, linoleic acid, linolenic acid, and stachyose concentrations. Based on the two experiments, it appears that rotations FCFS and WCFS resulted in consistent increases in seed oil, palmitic acid, stearic acid, sucrose, glucose, fructose, Fe, P, and B. The functions of seed sugars are still not completely known [36] , and the relationships between the sugars are complex and dependent on maturity, genotype, environment, and their interactions [37] [38] . For example, positive correlations were found between total sugar and sucrose, total sugar and raffinose, and sucrose and raffinose. However, a negative correlation between
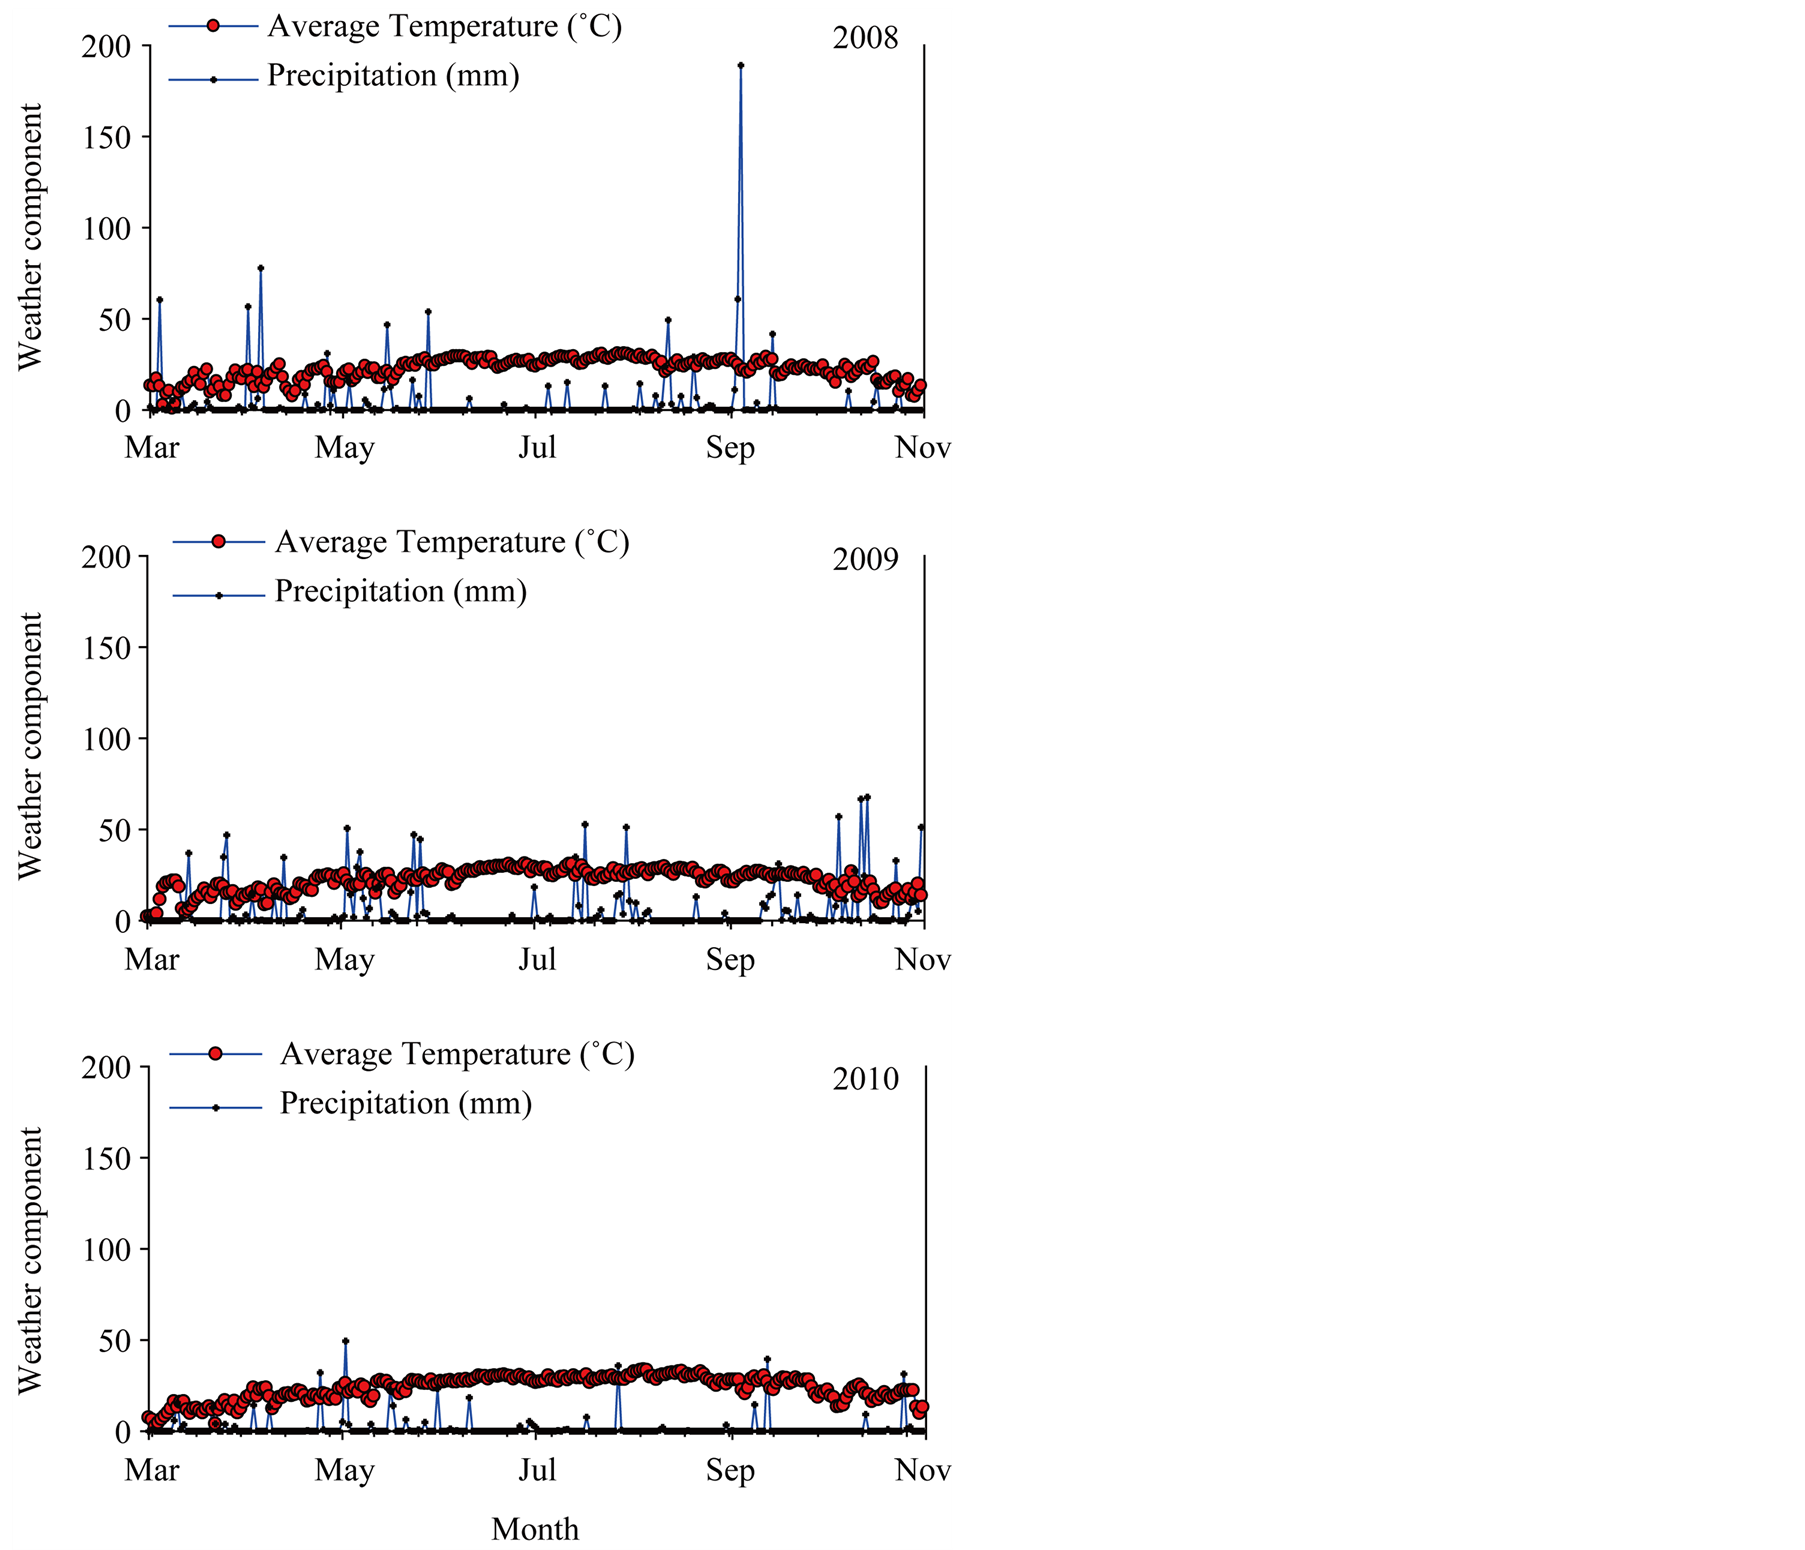
Figure 1. Temperature and precipitation during the summer crop season for soybean in 2008, 2009, and 2010 measured at Stoneville, MS.
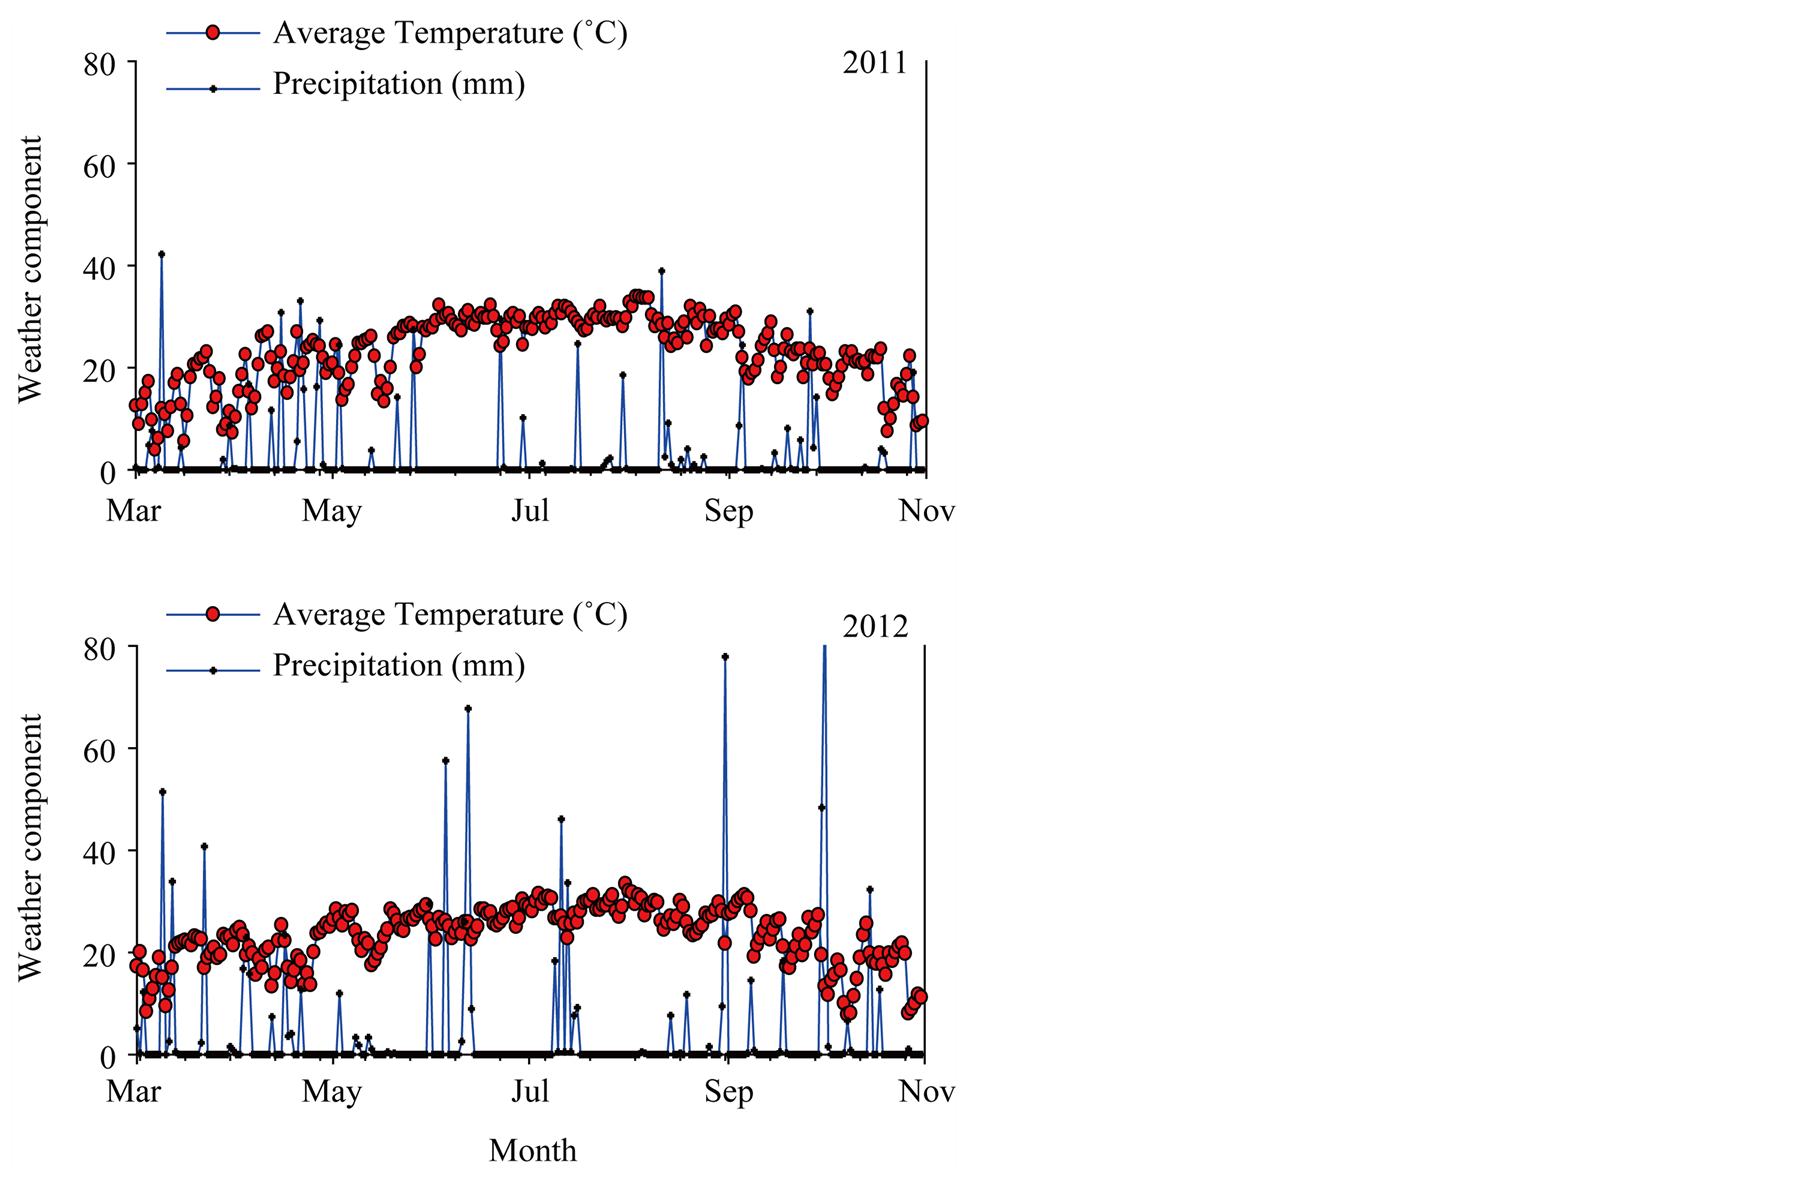
Figure 2. Temperature and precipitation during the summer crop season for soybean in 2011 and 2012 measured at Stoneville, MS.
Table 4. Experiment 1. Effects of crop rotation sequence on seed protein, oil, fatty acids (%), sugars (mg∙g−1), and P (%), and Fe, B, and Mn (mg∙kg−1). The experiment was conducted in 2007 through 2011 under Mississippi delta region conditions.
Means within a column followed by the same letter are not significantly different at the 5% level as determined by Fishers’ LSD test. Values are means of four replicates. Rotation sequences were wheat-late cotton-fallow-soybean (WCFS), fallow-cotton-wheat-soybean (FCWS), and fallowcotton-fallow-soybean (FCFS).
Table 5. Experiment 2. Effects of crop rotation sequence on seed protein, oil, fatty acids (%), sugars (mg∙g−1), and P (%), and Fe, B, and Mn (mg∙kg−1). The experiment was conducted in 2008 through 2012 under Mississippi delta region conditions.
Means within a column followed by the same letter are not significantly different at the 5% level as determined by Fishers’ LSD test. Values are means of four replicates. Rotation sequences were wheat-late cotton-fallow-soybean (WCFS), fallow-cotton-wheat-soybean (FCWS), and fallowcotton-fallow-soybean (FCFS).
sucrose and stachyose, and raffinose and stachyose was also reported [39] . Other reports confirmed the positive correlation between sucrose and raffinose, but found a negative correlation between sucrose and stachyose [37] . Genetic improvement for desirable seed sugar composition constituents through breeding is possible, and unique low oligosaccharide profile lines have been developed [40] [41] , but no improved cultivars have been released to date [36] .
The increase of seed oil, palmitic acid, stearic acid, sucrose, glucose, fructose, Fe, P, and B concentrations associated with FCFS and WCFS could be due to nutrient changes in soil, soil disease and pest pressure, or both. Base line soil nutrients analysis showed sufficient nutrient concentrations present in the soil. Nutrient levels in soil were: B (1.73 mg·kg−1), Cu (10.31 mg·kg−1), Na (58.7 mg·kg−1), Zn (47.1 mg·kg−1), Ca (0.314 g·kg−1), Fe (14.44 g·kg−1), K (1.3 g·kg−1), Mg (2.875 g·kg−1), Mn (0.498 g·kg−1), P (0.428 g·kg−1), and S (0.11 g·kg−1). Soil analysis of the three rotation sequences, that was conducted at the beginning of the first rotation cycle, showed that rotations FCFS and WCFS had higher soil P, K, Fe, and B for FCFS, than in FCWS, (Figure 3); in both of these rotations the winter period immediately preceding soybean was fallow. Although soil did not suffer from any apparent nutrient deficiencies, it appears that higher nutrients levels in FCFS and WCFS may have resulted in higher content of some seed constituents, especially seed oil, sugars, Fe, P, and B contents. Leaf analysis from the three rotation sequences at the beginning of the first rotation cycle showed higher levels of N, K, and B in soybean grown in FCFS and WCFS than in FCWS (Figure 4), indicating that maintaining higher levels of nutrient, especially under high heat conditions of the Mississippi delta may allow efficient nutrients movement from leaves (source) to seed (sink), especially during seed-fill period. Previous research showed that crop rotation influenced seed composition in soybean, and showed oil concentration differences among crop rotation sequences [11] . They reported that in the first-year soybean following five years of consecutive corn and the cornsoybean rotation in conventional and no-till systems resulted in the lowest oil concentration, and oil increased as consecutive years of soybean production increased. Other researchers showed that protein and fatty acids increased in soybean-corn rotation compared with continuous soybean [42] . A positive correlation was shown between soil nutrients (C, K, B, and Zn) and seed nutrients (protein and oleic acid), but negatively associated with oil and linolenic acid [43] . In our experiment, the increase of oil, sugars (especially sucrose, glucose, and fructose), P, Fe, and B could be due to higher concentrations of C, K, P, Fe, and B observed in soils of rotations
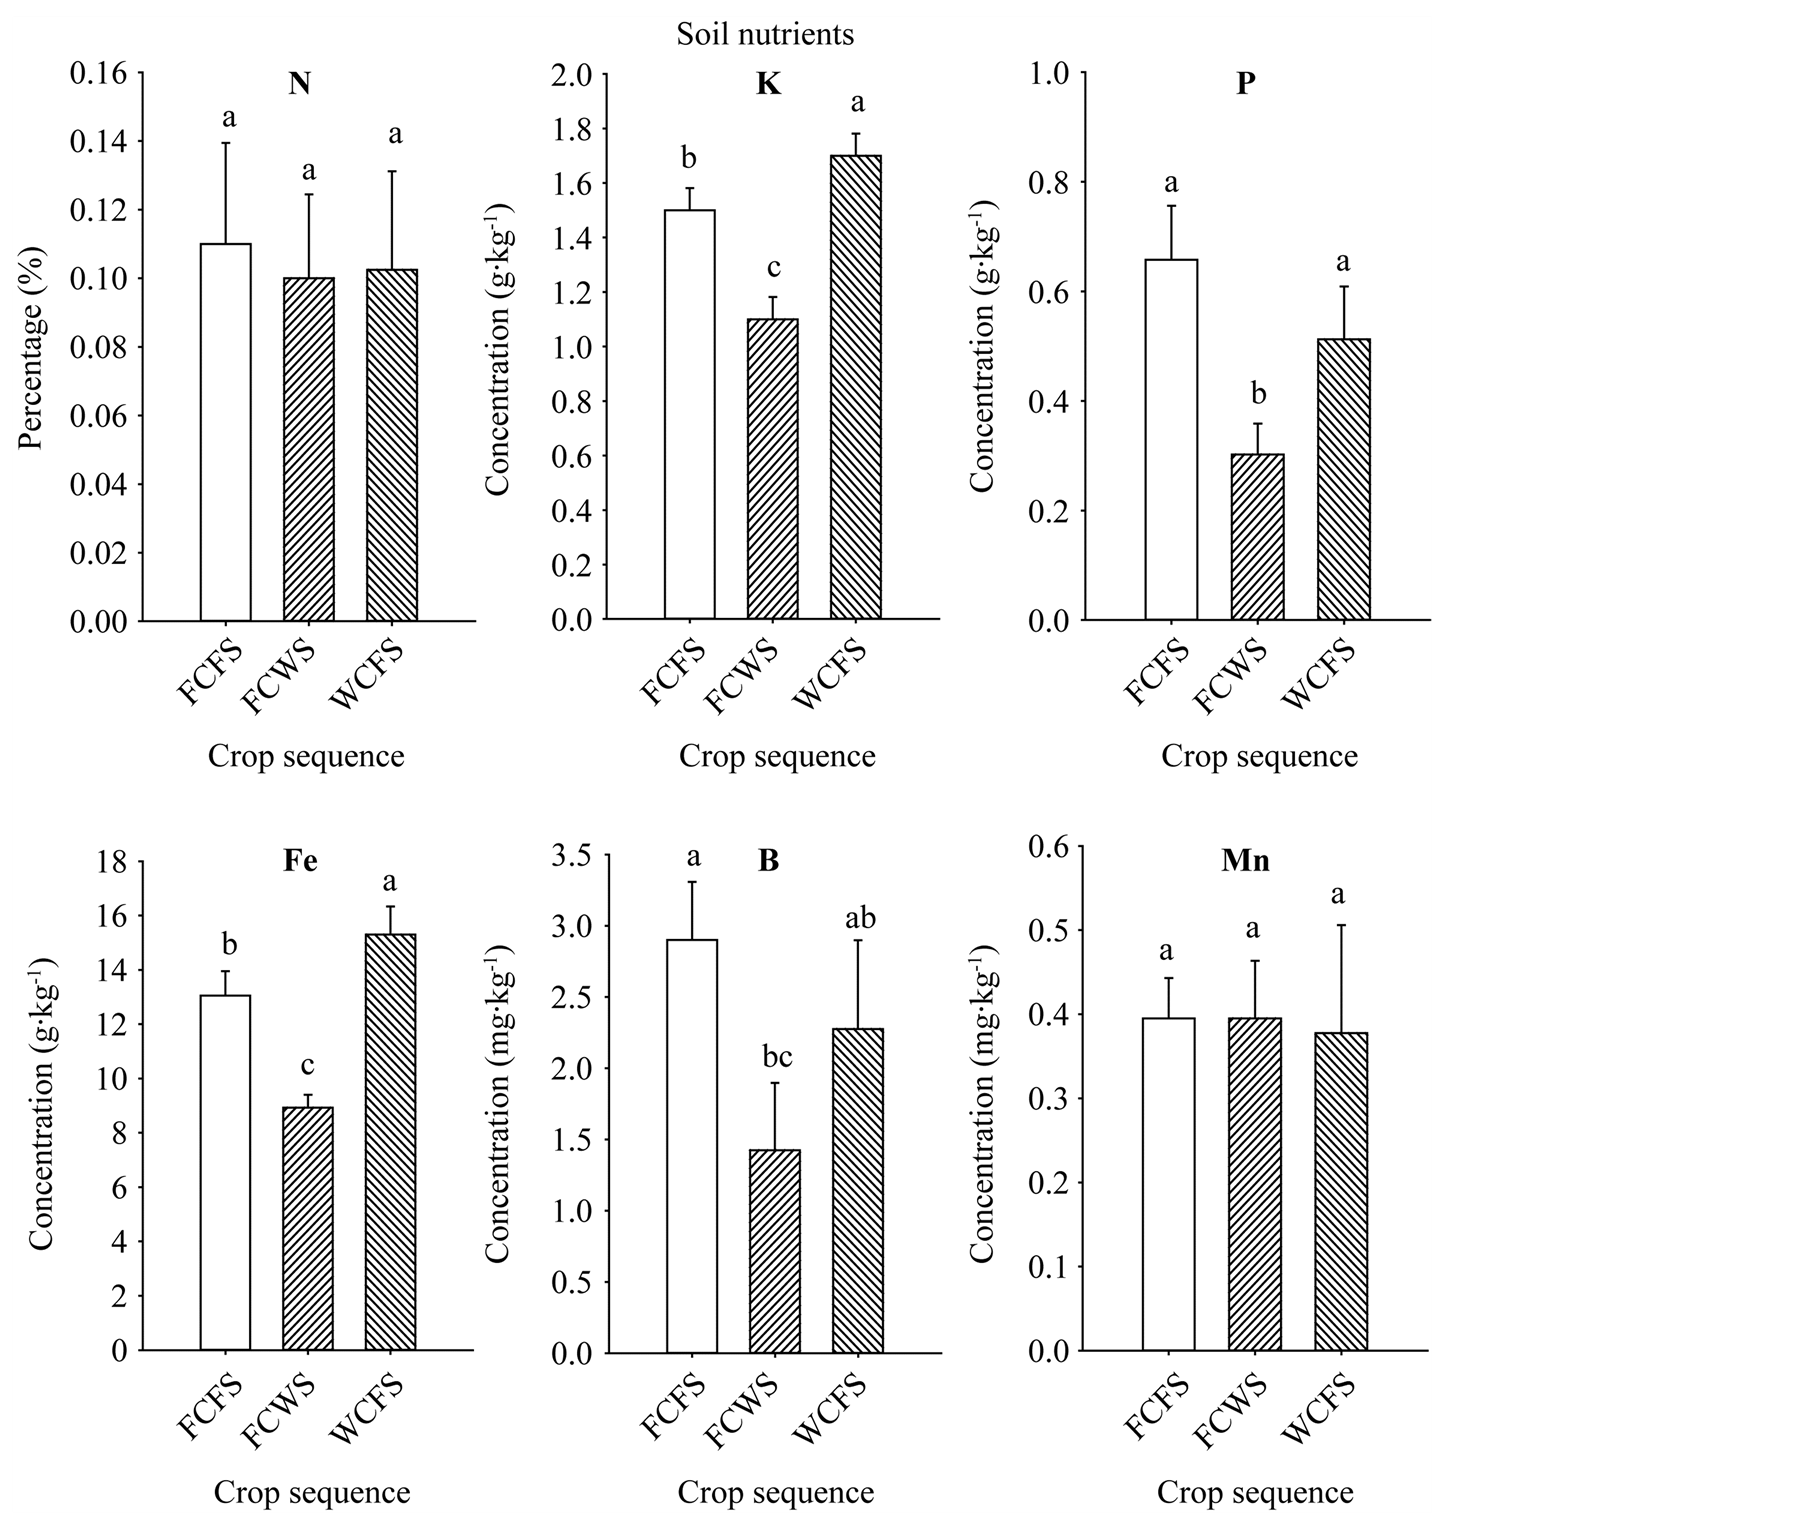
Figure 3. Soil nutrient levels in soil of different crop sequences measured at the beginning of the first rotation cycle only. Values are means of four replicates ± SE. Mean bars followed by the same letter are not significantly different at the 5% level. WCFS = wheat-latecottonfallow-soybean; FCWS = fallow-cotton-wheat-soybean; FCFS = fallow-cotton-fallow-soybean.
FCFS and WCFS compared with FCWS rotation. Soil C did not differ between FCFS (1.23%) and WCFS (1.21%), but was significantly (P ≤ 0.05) lower in FCWS (0.71%). The higher levels of these nutrients in FCFS and WCFS may be due to lower nutrient removal due to the fallow period prior to soybean production. It was reported [44] that when wheat was preceded by fallow, less nitrogen was required; for example, nitrogen was applied at a rate of 52 pounds per acre (58.2 kg∙ha−1) compared 65 (72.8 kg∙ha−1) for continuous wheat compared with wheat-fallow production. It was reported that sorghum-sudangrass hybrid and fallow was an effective sequence to reduce yield losses caused by mixed populations of Meloidogyne spp. and Heteroderaglycines [44] , and soil C and N losses were reduced by leaving crop residue on the soil surface [45] . It was found that no-till practices in a wheat-fallow rotation led to only 3% loss of N, but moldboard-plowed soils resulted in 19% loss over a 12-yr period [46] . The effects of crop rotation and N input on mineral nutrition and grain composition in corn was investigated, and found that both N rates and rotation affected these quality components [46] . The effects of crop management, including crop rotation, on seed nutrients is still inconsistent [11] [47] [48] , and this inconsistency may be due to genotype used and crop environmental conditions, including drought, heat, rainfall, soil conditions, and diseases. The effects of rotation on seed composition and mineral nutrition is still complex to explain [20] due to multiple biotic and abiotic factors involved, and further research on the effects of soilplant-environmental factors interaction on seed nutrition is needed.
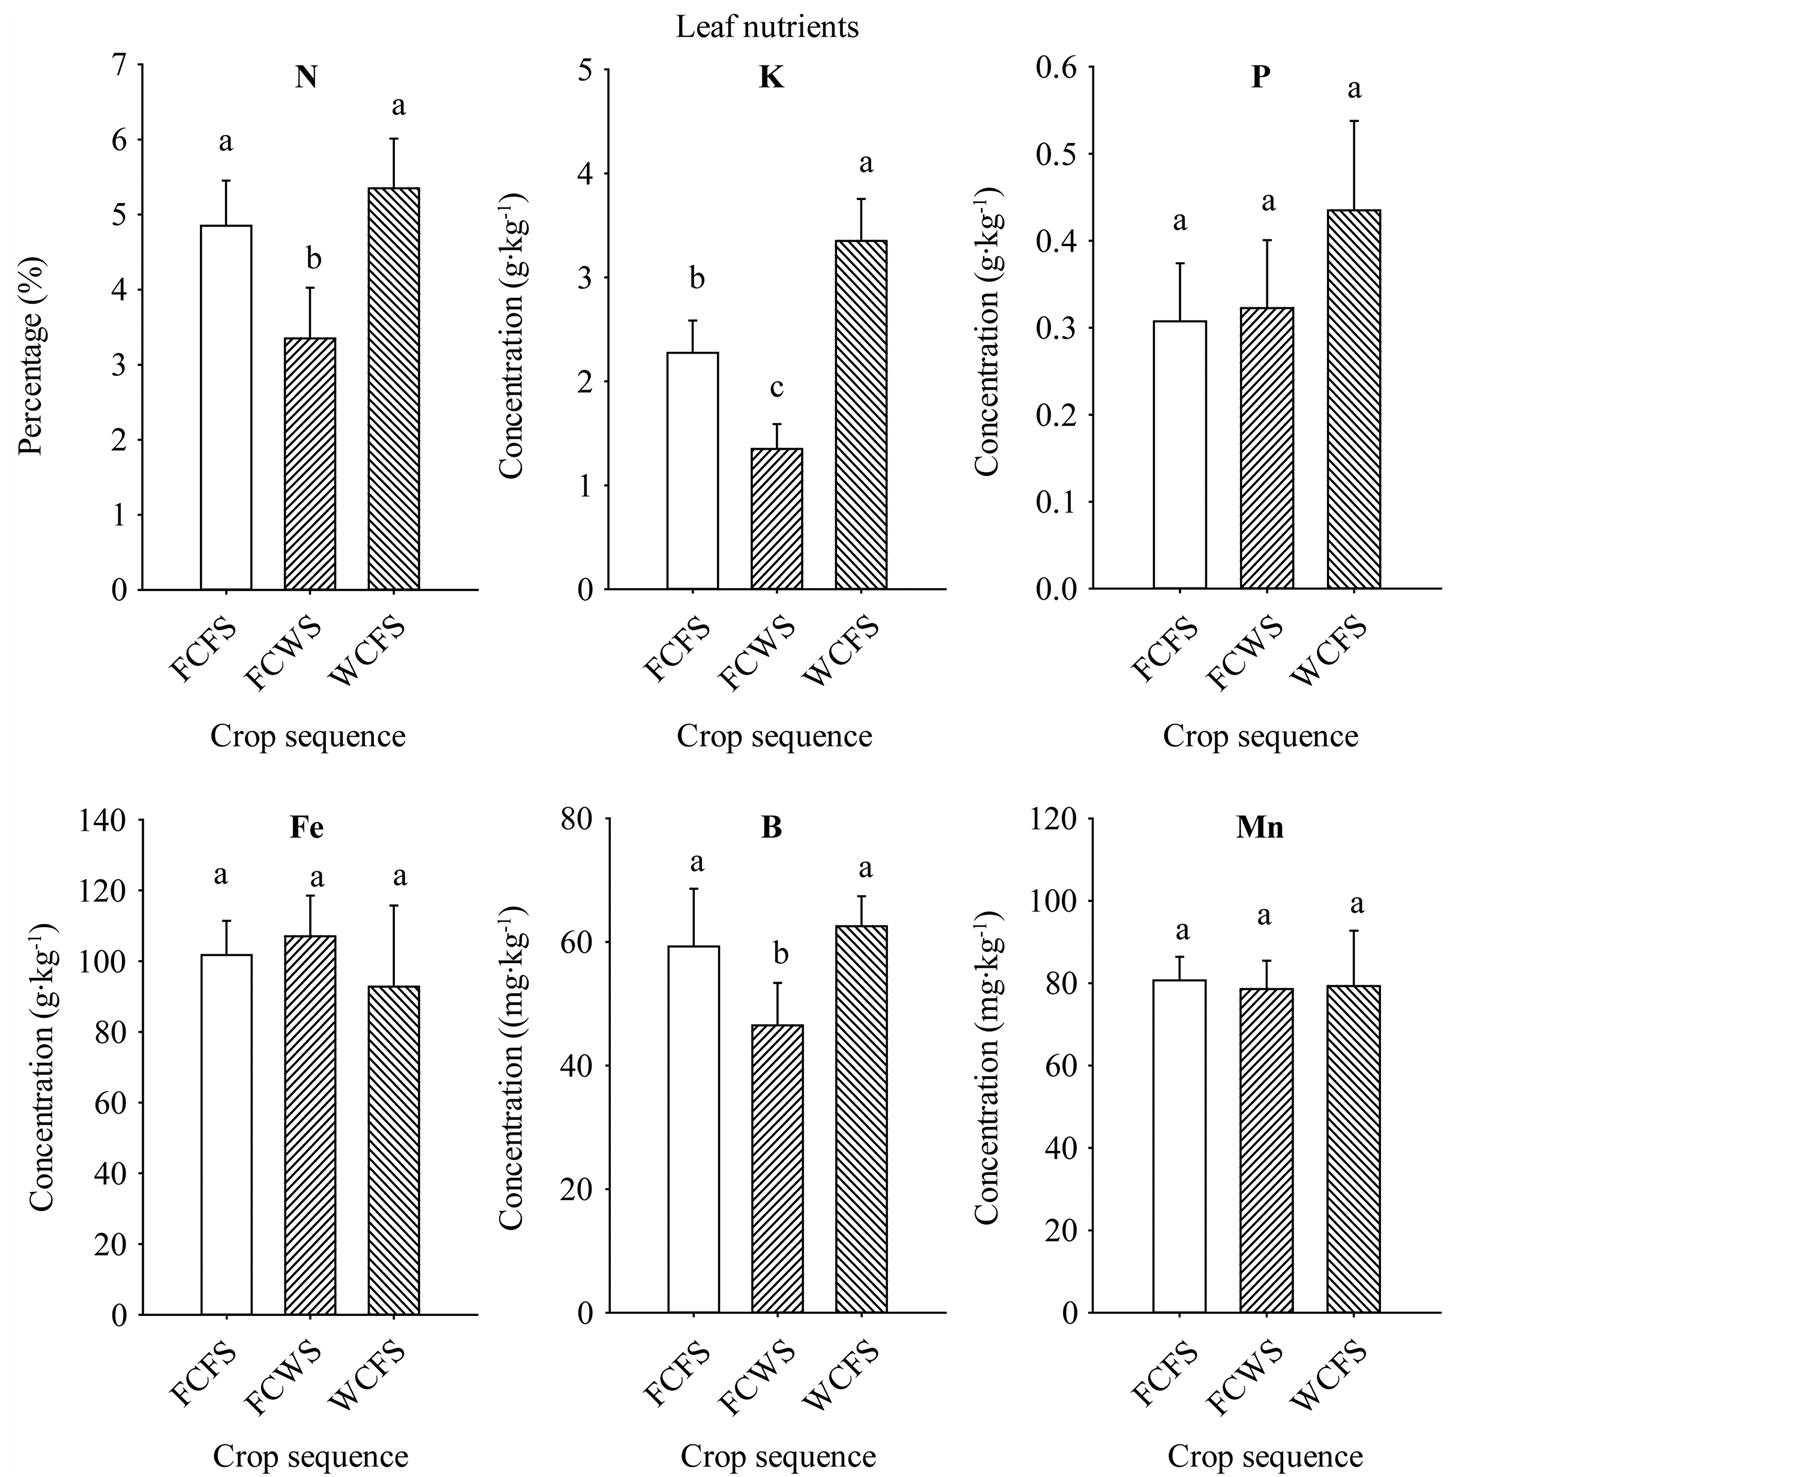
Figure 4. Leaf nutrient levels in soybean grown in different crop sequences measured at the seed-fill stage (R5-R6) at the beginning of the first rotation cycle only. Values are means of four replicates ± SE. Mean bars followed by the same letter are not significantly different at the 5% level. WCFS = wheat-late cotton-fallow-soybean; CWS = fallow-cotton-wheat-soybean; FCFS = fallow-cotton-fallow-soybean.
4. Conclusion
Our research demonstrated that crop rotation can influence seed composition and mineral nutrition in soybean. Higher seed oil, palmitic acid, stearic acid, sugars (glucose, sucrose, and fructose), Fe, P, and B contents were observed in rotation sequences that include a fallow period before soybean than in the sequence where wheat preceded soybean. This response could be due to nutrient changes in soil, influencing the mobility and accumulation of these nutrients in leaves and seed. Other seed constituents such as seed protein, raffinose, stachyose, and Mn contents were either not affected or their responses to crop rotation were not consistent. Mechanisms of how these minerals and other factors such as diseases are involved in the mobility and accumulation of nutrients in seed are still not known. Further research to understand these mechanisms is needed.
Acknowledgements
We thank Sandra Mosley for laboratory work. Field assistance provided by Kristi Jordan, Mike Gafford, Willie Reese, Terry Newton, and Rex Manning is appreciated. Also, we would like to thank Debbie Boykin for her assistance with statistical design and data analysis. Mention of trade names or commercial products in this publication is solely for the purpose of providing specific information and does not imply recommendation or endorsement by the U.S. Department of Agriculture. This research was funded by United States Department of Agriculture, Agricultural Research Service project numbers 6402-21220-012-00D, 6402-22000-005-00D, and 6402-21000-050-00D. USDA is an equal opportunity provider and employer.
References
- Wilson, R.F. (2004) Seed Composition. In: Boerma, H. and Specht, J.E., Eds., Soybeans: Improvement, Production, and Uses, 3rd Edition, ASA, CSSA, and SSSA, Madison, 621-668.
- Cherry, J.H., Bishop, L., Hasegawa, P.M. and Leffler, H.R. (1985) Differences in the Fatty Acid Composition of Soybean Seed Produced in Northern and Southern Areas of the U.S.A. Phytochemistry, 24, 237-241. http://dx.doi.org/10.1016/S0031-9422(00)83527-X
- Schnebly, S.R. and Fehr, W.R. (1993) Effect of Years and Planting Dates on Fatty Acid Composition of Soybean Genotypes. Crop Science, 33, 716-719. http://dx.doi.org/10.2135/cropsci1993.0011183X003300040016x
- Wilson, L.A. (1995) Soy Foods. In: Erickson, D.R., Ed., Practical Handbook of Soybean Processing and Utilization, AOCS Press, Champaign, IL and United Soybean Board, St. Louis, 428-459.
- Bellaloui, N., Hanks, J.E., Fisher, D.K. and Mengistu, A. (2009) Soybean Seed Composition Is Influenced by WithinField Variability in Soil Nutrients. Crop Management, 8.
- Bellaloui, N., Abbas, H.K., Gillen, A.M. and Abel, C.A. (2009) Effect of Glyphosate-Boron Application on Seed Composition and Nitrogen Metabolism in Glyphosate-Resistant Soybean. Journal of Agriculture and Food Chemistry, 57, 9050-9056.
- Bellaloui, N., Smith, J.R., Gillen, A.M. and Ray, J.D. (2011) Effects of Maturity, Genotypic Background, and Temperature on Seed Mineral Composition in Near-Isogenic Soybean Lines in the Early Soybean Production System. Crop Science, 51, 1161-1171. http://dx.doi.org/10.2135/cropsci2010.04.0187
- Bellaloui, N., Hu, Y., Mengistu, A., Kassem, M.A. and Abel, C.A. (2013) Effects of Foliar Boron Application on Seed Composition, Cell Wall Boron, and Seed δ15N and δ13C Isotopes in Water-stressed Soybean Plants. Frontiers in Plant Physiology, 4, 270. http://dx.doi.org/10.3389/fpls.2013.00270
- Bellaloui, N., Mengistu, A., Walker, R.R. and Young, L.D. (2014) Soybean Seed Composition as Affected by Seeding Rates and Row Spacing in the Midsouth USA. Crop Science, 54, 1782-1795. http://dx.doi.org/10.2135/cropsci2013.07.0463
- Liu, K. (1997) Soybeans Chemistry, Technology, and Utilization. Chapman & Hall, New York.
- Temperly, R.J. and Borges, R. (2006) Tillage and Crop Rotation Impact on Soybean Grain Yield and Composition. Agronomy Journal, 98, 999-1004. http://dx.doi.org/10.2134/agronj2005.0215
- Marais, A., Hardy, M., Booyse, M. and Botha, A. (2012) Effects of Monoculture, Crop Rotation, and Soil Moisture Content on Selected Soil Physicochemical and Microbial Parameters in Wheat Fields. Applied and Environmental Soil Science, 2012, Article ID: 593623. http://dx.doi.org/10.1155/2012/593623
- Karlen, D.L., Varvel, G.E., Bullock, D.G. and Cruse, R.M. (1994) Crop Rotations for the 21st Century. Advances in Agronomy, 53, 1-45. http://dx.doi.org/10.1016/S0065-2113(08)60611-2
- Raimbault, B.A. and Vyn, T.J. (1991) Crop Rotation and Tillage Effects on Corn Growth and Soil Structural Stability. Agronomy Journal, 83, 979-985. http://dx.doi.org/10.2134/agronj1991.00021962008300060011x
- Bremer, E., Janzen, H.H., Ellert, B.H. and McKenzie, R.H. (2008) Soil Organic Carbon after Twelve Years of Various Crop Rotations in an Aridic Boroll. Soil Science Society of American Journal, 72, 970-974. http://dx.doi.org/10.2136/sssaj2007.0327
- Tanaka, D.L., Anderson, R.L. and Rao, S.C. (2005) Crop Sequencing to Improve Use of Precipitation and Synergize Crop Growth. Agronomy Journal, 97, 385-390. http://dx.doi.org/10.2134/agronj2005.0385
- Kaye, N.M., Mason, S.C., Jackson, D.S. and Galusha, T.D. (2007) Crop Rotation and Soil Amendments Alters Sorghum Grain Quality. Crop Science, 47, 722-727. http://dx.doi.org/10.2135/cropsci2006.05.0346
- Varvel, G.E. (2000) Crop Rotation and Nitrogen Effects on Normalized Grain Yields in a Long-Term Study. Agronomy Journal, 92, 938-941. http://dx.doi.org/10.2134/agronj2000.925938x
- Carpenter-Boggs, L., Pikul Jr., J.L., Vigil, M.F. and Riedell, W.E. (2000) Soil Nitrogen Mineralization Influenced by Crop Rotation and Nitrogen Fertilization. Soil Science Society of America Journal, 64, 2038-2045. http://dx.doi.org/10.2136/sssaj2000.6462038x
- Copeland, P.J. and Crookston, R.K. (1992) Crop Sequence Affects Nutrient Composition of Corn and Soybean Grown under High Fertility. Agronomy Journal, 84, 503-509. http://dx.doi.org/10.2134/agronj1992.00021962008400030028x
- Johnson, N.C., Copeland, P.J., Crookston, R.K. and Pfleger, F.L. (1992) Mycorrhizae: Possible Explanation for the Yield Decrease with Continuous Corn and Soybean. Agronomy Journal, 84, 387-390. http://dx.doi.org/10.2134/agronj1992.00021962008400030007x
- MSUcares (2014) http://msucares.com/crops/soybeans/index.html
- MSUcares (2014) http://msucares.com/crops/wheat/index.html
- Wilcox, J.R. and Shibles, R.M. (2001) Interrelationships among Seed Quality Attributes in Soybean. Crop Science, 41, 11-14.
- Bellaloui, N., Smith, J.R., Ray, J.D. and Gillen, A.M. (2009) Effect of Maturity on Seed Composition in the Early Soybean Production System as Measured on Near-Isogenic Soybean Lines. Crop Science, 49, 608-620. http://dx.doi.org/10.2135/cropsci2008.04.0192
- Association of Official Analytical Chemists (AOAC) (1990) Method 988.05. In: Helrich, K., Ed., Official Methods of Analysis, 15th Edition, AOAC, Arlington, VA, 70.
- Association of Official Analytical Chemists (AOAC) (1990) Method 920.39. In: Helrich, K., Ed., Official Methods of Analysis, 15th Edition, AOAC, Arlington, VA, 79.
- Boydak, E., Alpaslan, M., Hayta, M., Gercek, S. and Simsek, M. (2002) Seed Composition of Soybeans Grown in the Harran Region of Turkey as Affected by Row Spacing and Irrigation. Journal of Agriculture and Food Chemistry, 50, 4718-4720. http://dx.doi.org/10.1021/jf0255331
- Lohse, G. (1982) Microanalytical Azomethine-H Method for Boron Determination in Plant Tissue. Communications in Soil Science and Plant Analysis, 13, 127-134. http://dx.doi.org/10.1080/00103628209367251
- Dordas, C., Apostolides, G.E. and Goundra, O. (2007) Boron Application Affects Seed Yield and Seed Quality of Sugar Beets. Journal of Agricultural Sciences, 145, 377-384. http://dx.doi.org/10.1017/S0021859607006879
- John, M.K., Chuah, H.H. and Neufeld, J.H. (1975) Application of Improved Azomethine-H Method to the Determination of Boron in Soils and Plants. Analytical Letters, 8, 559-568. http://dx.doi.org/10.1080/00032717508058240
- Bandemer, S.L. and Schaible, P.J. (1944) Determination of Iron. A Study of the o-Phenanthroline Method. Industrial and Engineering Chemistry, Analytical Edition, 16, 317-319. http://dx.doi.org/10.1021/i560129a013
- Loeppert, R.L. and Inskeep, W.P. (1996) Colorimetric Determination of Ferrous Iron and Ferric Iron by the 1,10-phenanthroline Method. In: Bigham, J.M., Ed., Methods of Soil Analysis: Part 3, Chemical Methods, SSSA, Madison, WI, 659-661.
- Cavell, A.J. (1955) The Colorimetric Determination of Phosphorus in Plant Materials. Journal of the Science and Food and Agriculture, 6, 479-480. http://dx.doi.org/10.1002/jsfa.2740060814
- SAS (2001) SAS 9.1 TS Level 1M3, Windows Version. 5.1.2600. SAS Institute, Cary, NC.
- MSUcares (2014) Home Page. Mississippi State Univ., Extension Services, Mississippi State. http://ext.msstate.edu/anr/drec/weather.cgi
- Hou, A., Chen, P., Alloatti, J., Li, D., Mozzoni, L., Zhang, B. and Shi, A. (2009) Genetic Variability of Seed Sugar Content in Worldwide Soybean Germplasm Collections. Crop Science, 49, 903-912. http://dx.doi.org/10.2135/cropsci2008.05.0256
- Hartwig, E.E., Kuo, T.M. and Kenty, M.M. (1997) Seed Protein and Its Relationship to Soluble Sugars in Soybean. Crop Science, 37, 770-773. http://dx.doi.org/10.2135/cropsci1997.0011183X003700030013x
- Hymowitz, T., Collins, F.I., Panczar, J. and Walker, W.M. (1972) Relationship between the Content of Oil, Protein and Sugar in Soybean Seed. Agronomy Journal, 64, 613-616. http://dx.doi.org/10.2134/agronj1972.00021962006400050019x
- Kerr, P.S. and Sebastian, A. (2000) Soybean Products with Improved Carbohydrate Composition and Soybean Plants. US Patent No. 6147193.
- Neus, J.D., Fehr, W.R. and Schnebly, S.R. (2005) Agronomic and Seed Characteristics of Soybean with Reduced Raffinose and Stachyose. Crop Science, 45, 589-592. http://dx.doi.org/10.2135/cropsci2005.0589
- Bellaloui, N., Smith, J.R., Gillen, A.M. and Ray, J.D. (2010) Effect of Maturity on Seed Sugars as Measured on Near-Isogenic Soybean (Glycine max) Lines. Crop Science, 50, 1978-1987. http://dx.doi.org/10.2135/cropsci2009.10.0596
- Bellaloui, N., Bruns, H.A., Gillen, A.M., Abbas, H.K., Zablotowicz, R.M., Mengistu, A. and Paris, R.L. (2010) Soybean Seed Protein, Oil, Fatty Acids, and Mineral Composition as Influenced by Soybean-Corn Rotation. Agricultural Sciences, 1, 102-109. http://dx.doi.org/10.4236/as.2010.13013
- Weaver, D.B. and Rod, R. (1995) Comparison of Crop Rotation and Fallow for Management of Heterodera glycines and Meloidogyne spp. in Soybean. The Journal of Nematology, 27, 585-591.
- Lamb, J.A., Peterson, G.A. and Fenster, C.R. (1985) Wheat Fallow Tillage Systems’ Effect on a Newly Cultivated Grassland Soils’ Nitrogen Budget. Soil Science Society of America Journal, 49, 352-356. http://dx.doi.org/10.2136/sssaj1985.03615995004900020016x
- Riedell, W.E., Pikul Jr., J.L., Jaradat, A.A. and Schumacher, T.E. (2009) Crop Rotation and Nitrogen Input Effects on Soil Fertility, Maize Mineral Nutrition, Yield, and Seed Composition. Agronomy Journal, 101, 870-879. http://dx.doi.org/10.2134/agronj2008.0186x
- Yusuf, R.I., Siemens, J.C. and Bullock, D.G. (1999) Growth Analysis of Soybean under No-Tillage and Conventional Tillage Systems. Agronomy Journal, 91, 928-933. http://dx.doi.org/10.2134/agronj1999.916928x
- Gao, J., Hao, X., Thelen, K.D. and Robertson, G.P. (2009) Agronomic Management System and Precipitation Effects on Soybean Oil and Fatty Acid Profiles. Crop Science, 49, 1049-1057. http://dx.doi.org/10.2135/cropsci2008.08.0497