Food and Nutrition Sciences
Vol.5 No.1(2014), Article ID:41717,8 pages DOI:10.4236/fns.2014.51007
Metabonomic Investigation by 1H-NMR to Discriminate between Red Wines from Organic and Biodynamic Grapes
1Department of Agricultural and Food Sciences, Alma Mater Studiorum-University of Bologna, Cesena, Italy; 2Interdepartemental Centre for Industrial Agri-Food Research, University of Bologna, Cesena, Italy.
Email: *l.laghi@unibo.it, giusi.parpinello@unibo.it
Received November 5th, 2013; revised December 5th, 2013; accepted December 12th, 2013
ABSTRACT
This study aimed to discriminate red wines obtained from organic and biodynamic management by means of proton nuclear magnetic resonance (1H-NMR) and metabonomic investigation. Red wines were produced from Sangiovese grapes over the three harvests 2010-2012 from two parcels of a vineyard, managed according to organic (ORG) or biodynamic (BIO) protocol, respectively. Every year the vinifications were performed with commercial selected yeasts (CSY) according to the organic protocol. Moreover, in 2012, CSY vinification was flanked by a spontaneous vinification (SPO) carried out by microorganisms naturally present on the grapes. To gain information about the effects of production year, vineyard management, vinification protocol and vines site in the field on the wine characteristics, proton nuclear magnetic resonance spectra were registered by means of a spectrometer operating at 600 MHz and multivariate analysis was carried out. Production year and vinification protocol were found to be the factors affecting most the characteristics of wine metabolome. Vineyard management seemed to have more limited consequences on the wine composition, with effects on some aminoacids (proline, aspartic acid and valine), alcohols and some polyphenols. The latter observation could not be considered as certain, as vines site in the field acted, in this respect, as a confounding element.
Keywords:Wine; Biodynamic; Organic; Foodomics; 1H-NMR
1. Introduction
Besides the well-known organic viticulture, more recently the biodynamics approach is receiving increasing attention from both the consumers [1] and the grape growers [2]. Biodynamic agriculture differs from traditional organic systems primarily in the use of fermented preparations considered to stimulate the soil nutrient cycle and to encourage photosynthesis and the optimal evolution of compost. Currently little is known about the effect of non-conventional vine management on wine characteristics and the limited outcomes concerning either organic wine or wine produced by biodynamic management are finalized to demonstrate that wines produced with sustainable management are or are not detrimental to human health [3-5].
In studies performed by, Mulero et al. [6,7], in organic and conventional viticulture the antioxidant activity, anthocyanins, hydroxycinnamic acids, trans-resveratrol, flavonols and total amount of phenolic compounds were similar in wine grapes at the moment of the harvest, in wine at the end of fermentation and at six months storage. Similar results were obtained by Tinttunen & Lehtonen [8], although a significantly greater concentration of trans-resveratrol was detected in organic wines compared to conventional wines. Recently, Mulero et al. [9] found that different vinification practices (prolonged maceration or enological enzymes addition or traditional procedures) did not affect antioxidant activity, total phenolic compounds, anthocyanins, hydroxycinnamic acids and stilbenes in organic wine, up to three months storage. A comparative study on cold pre-fermentative and traditional maceration carried out on Tempranillo organic wines showed that low temperature may play a positive effect on phenolic composition and level of anthocyanin stabilization through copigmentation reactions [10]. The Mid Infrared (MIR) spectroscopy allowed to discriminate organic wines from conventional (73% - 100%) based on spectral area related to ethanol, glycerol, sugars, aromatic groups associated with phenolic compounds, organic acids and aldehydes [11]. With regards to biodynamic viticulture and winemaking the information is very limited. Studies reported a potential higher risk for human health due to mycotoxins formation in biodynamic management compared to conventional, integrated and genetically modified management and a lower health effect due to sulfur dioxide [12]. Tassoni et al. [13] showed that in conventional, organic and biodynamic wines the level of biogenic amines were comparable and always below the limit of risk for human health.
At today, the European regulation (Reg. EC 203/2012) clearly define the “organic wine” that must be produced with organic grape only (Reg. EC 834/2007) and limit the amount of sulfur dioxide that can be used during the vinification. On the contrary there is a lack of official European regulation for biodynamic viticulture and winemaking, thus the producers interested in this sustainable approach must refer to protocol proposed by private organizations which encourage spontaneous fermentation, instead of the use of commercial selected Saccharomyces scerevisiae yeasts. The spontaneous grape must fermentation was found to be dominated by the Saccaharomyces cerevisiae strains as well, even if other yeasts species (e.g. Hanseniaspora and Candida) are present at large extent [14]. The autochthonous yeasts are considered to improve the organoleptic quality of organic wines [15], although the consumers does not consider the “taste” as a predictor of choice between organic and other wines [16].
The present study aimed to compare organic and biodynamic red wines, by focusing the attention on the two key aspects of wine production: the agricultural management and the winemaking practices. To highlight how field management and vinification protocols influenced wine characteristics, a metabonomic approach was followed [17] by studying the characteristics of the wine metabolome mostly influenced by the factors under consideration. The metabolome of wine can be defined as the comprehensive qualitative and quantitative overview of its metabolites [18]. Being downstream of genome, transcriptome and proteome [19] of both grape and fermentative microorganisms, it can be considered as the best representation of any chemical and biological transformation having an effect on its characteristics. To characterize the wines metabolome proton nuclear magnetic resonance (1H-NMR) was applied. NMR spectroscopy is an investigation technique that, with a minimum sample preparation, offers the possibility to obtain quantitative and structural information of virtually any molecule characterized by protons. Moreover the only variables modulating an NMR spectrum are the solvent, the magnetic field, and the pulse sequence employed to transfer magnetization to the observed nuclei, with little instrument drift readily achievable [20]. Through wine metabolomics based on 1H-NMR, Lopez-Rituerto et al. [21] were recently able to discriminate wines produced by wineries operating in the same terroir. Through metabolic profiles observations, Picone et al. [22] were able to demonstrate the substantial equivalence between transgenic and control grapes.
To the best of the authors’ knowledge this is the first published metabonomic study trying to offer an insight about the differences between organic and biodynamic wines.
2. Materials and Methods
2.1. Experimental Design
Two hectares of Sangiovese grapes vineyard were equally divided in two parcels of 1-ha each devoted to either organic (ORG) or biodynamic (BIO) management. The two rows devoted to the same management were 2.8 m apart, while the distance between the rows devoted to the two managements were 10 rows apart, corresponding to 28 meters (Figure 1). Until 2007 the entire vineyard was carried out in organic in accordance with Reg. EC 834/2007, then in 2008 the conversion to BIO management started with the use of specific biodynamic preparations during the vegetative stage [23], including the application to the soil of cow manure (active principle “500” at 100 g∙ha–1) and “fladen” (cow manure enriched with basalt powder and eggshell at 100 g∙ha–1), and the application to the canopy of finely ground quartz powder (active principle “501” at 5 g∙ha–1). About 200 kg of grapes were collected during each harvest (from 2010 to 2012) from two rows either with organic or biodynamic management and processed using selected yeasts according to the organic protocol from the Italian association for Organic Agriculture (AIAB). In 2012 further 200 kg of grapes from both trials (ORG, BIO) were collected and processed using spontaneous fermentation according to the biodynamic protocol. As a consequence from 2010 and 2012 a total of 16 fermentation trials and corresponding samples were obtained.
2.2. NMR Sample Preparation and Spectroscopy
Each wine sample (800 μl) was added to 160 μl of 1 M
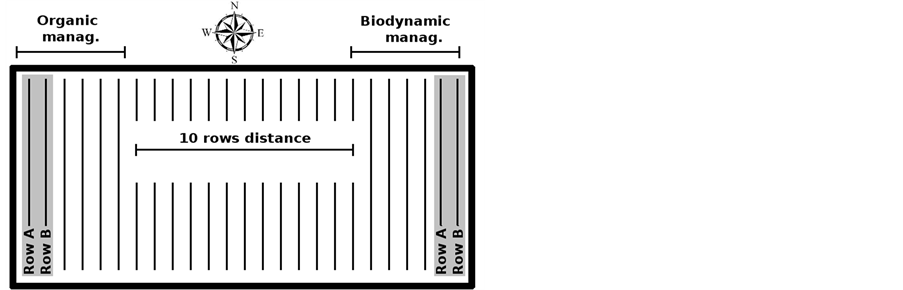
Figure 1. Schematic representation of the vineyard.
phosphate buffer in deuterium oxide (D2O), containing 3-(trimethylsilyl)-propionic-2,2,3,3-d4 acid sodium salt (TSP) 10 mM. The spectra were recorded at 298K with an AVANCE spectrometer (Bruker, Milan, Italy) at 600.13 MHz. The HOD residual signal was suppressed by applying the first increment of the NOESY pulse sequence and a spoil gradient [24]. The peaks were assigned by comparison with the literature and Amix software data bank (ver. 3.9.7, Bruker, Italy).
2.3. Data Processing and Preparation for Chemometrics
The spectra were baseline-adjusted by means of the simultaneous peak detection [25] and baseline correction algorithm (SPDBC) implemented in the baseline R package [26]. Briefly, the algorithm tries to iteratively locate peaks as consistent deviations from noise and interpolate over the spectra after peak removal. To each spectrum a linear correction was then applied to make the points pertaining to the baseline randomly spread around zero. The spectra were overall corrected for errors in chemical shift misalignments concerning some pH-dependent signals using an in-house modified version of Correlation Optimized Shifting (i-Coshift) [27] able to perform the Co-shift in localized regions of the spectrum. The shift misalignments were further reduced by summing up the points over “bins”, spectra portions of equal length. The extreme portions of the spectra and the residual HDO signal were excluded. In order to correct vertical scale errors originating from the different water content among the samples, the spectra were then normalized by means of the PQN algorithm [28], which calculates on a point by point basis the factor that most probably needs to be applied in order to superimpose the spectra to a reference.
2.4. Statistical and Chemometrics Tools
The analysis of variance (ANOVA) was used to determine whether there were significant differences between the means of three or more independent groups.
The multivariate analysis of the data revolved around Principal Component Analysis (PCA) and Hierarchical Cluster Analysis (HCA). PCA, the election approach for exploratory data analysis, calculates and sorts in decreasing order linear combinations of the original variable, called principal components, on the basis of their ability to explain the samples variance. This usually leads to simple models displaying the intrinsic data structure of the data by means of low dimensional orthogonal projections. The representation of the samples in this space (the so called score plot) highlights the similarities and differences among the groups. The representation of the coefficients assigned to the original variables to obtain the principal components (the so called loadingplot) allows the identification of the NMR peaks, thus the substances, which contribute mostly to the variance of the samples. If principal components accounting for sufficiently high samples total variance are considered, noise characterizing the measurements is excluded from the computation, with virtually no loss of information.
HCA was performed trough the “hclust” R function, by calculating the similarity among the samples based on their Euclidean distance in the space constituted by the NMR spectra. The branches of the obtained tree were ordered so that the tighter clusters appeared on the left side.
3. Results
3.1. Overview of the Factors
An example of the 1H-NMR spectra registered on the samples obtained during the present investigation is shown in Figure 2. The spectrum is dominated by ethanol signals. The region between δ 0.8 and 4.0 ppm gives information about amino acids and organic acids like succinate, acetate and tartrate. The region δ 4.0 - 5.5 ppm is considered to be the region mainly giving information about the anomeric protons of carbohydrates, where only glucose was highlighted as example. Although polyphenols showed far less intense peaks than most of the previously cited molecules, their characterization and quantification was possible due to signals in the peculiar spectrum region between 5.5 and 8.5 ppm (Figure 2(b)). The most intense signals were ascribed to gallic acid, and peaks from trans-caffeic acid, siringic acid and resveratrol were also identified, the latter particularly interesting for its healthy properties [29,30].
To gain information about the driving factor (between production year, management, vinification protocol and plants position in the field) on the wine composition, the NMR spectral points were treated as variables to build a principal component analysis (PCA) model. To avoid that the overwhelming concentration of ethanol could
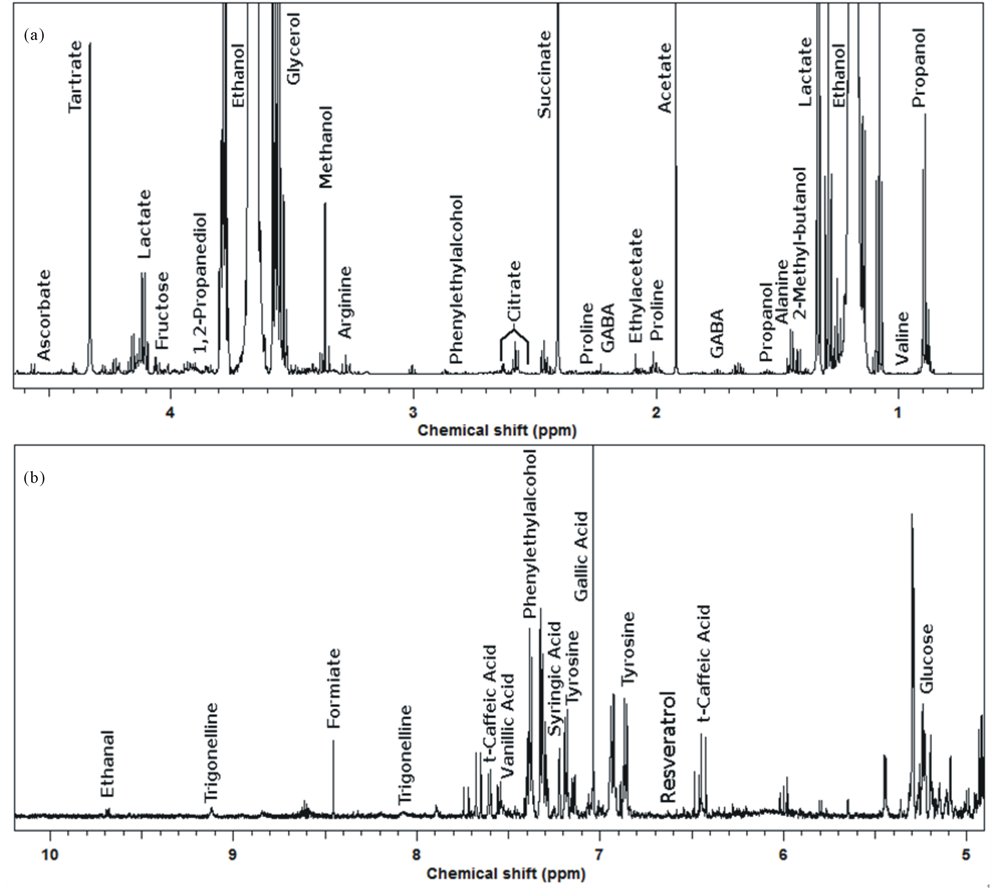
Figure 2. Example of the 1H-NMR spectra of ORG wine.
hide interesting features, two models were built on polyphenols and carbohydrates regions, respectively (figure 3). The production year resulted as the most important factor, with 2012 samples clearly separated from the others. The loadingplots of variables superimposed to the scoreplots of samples showed that the main variations regarded molecules pertaining to different chemical classes and present in quite low concentration, suggesting that the production year influenced a wide pool of metabolic cycles. Despite the predominance effect of the production year, the importance of other variables was visible, especially when the carbohydrates region was considered. The 2012 samples, in particular, spread along the second PC, accounting for the 20.3% of the total variance, according to production protocol and, to a minor extent, to vineyard management.
3.2. Effect of Vineyard Management
To focus on the effects of vineyard management, only the wines produced with commercially selected yeast (CSY) were examined and each point of the NMR spectrum was considered as a variable to build a two-ways Anova model, with vineyard management and production year as studied factors.
Trans-caffeic acid concentration was always high on biodynamic wines, whereas the opposite was found for glutamine (Table 1). This inverse relationship is intriguing in sight of the observations of Melgarejo et al. [31], whom found that some polyphenols are able to target enzymes of biogenic amines biosynthetic pathways. It is necessary to keep in mind that the biodynamic protocol was introduced in 2008 in the organically managed vineyard, thus the years 2010 is considered “conversion”
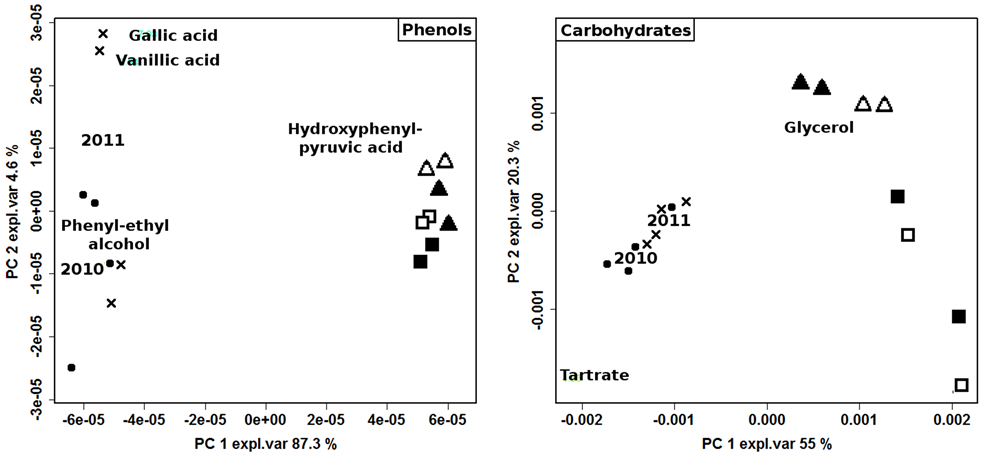
Figure 3. Biplot of PCA models built on the NMR spectra regions of phenols and carbohydrates of 2010 ( ); 2011 (
 ); ORG-CSY 2012 (
 ), ORG-SPO 2012 (
 ), BIO-CSY 2012 (
 ) and BIO-SPO 2012 (
 ) wines.

Table 1. Concentration (M/l) of the compounds with significant differences (p < 0.05) ascribable to vineyard management, as assessed by a two ways Anova model. The concentration of each compound was calculated from the NMR signal (ppm) as due to a single proton.
year. The entire NMR spectra signal of wines from 2010 to 2012 was considered as a direction of a multidimensional space and the Euclidean distance between samples here represented was calculated. Table 2 shows the ration between inter-group and intra-group distance. When the full spectrum, dominated by ethanol signals, or carbohydrates region only were considered, no bright correlation appeared between this ratio and production year, suggesting that the sugars to ethanol conversion was only limitedly affected by the switch from organic to biodynamic management. When polyphenols region was considered, at the opposite, the ratio between inter and intra-group distance increased along the years, reaching 9.5 times in 2012, suggesting a discrimination connected to management practices in the phenylpropanoid pathway [32]. In this respect it should be noticed that biodynamic wines showed along the three studied years a progressive decrease in glutamine concentration, reinforcing the idea of an antagonistic effect exerted by polyphenols.
3.3. “Within-Field” Variability
When a vineyard is divided into portions to assess the influence of different managements on the plants yield or grapes and wine characteristics, it cannot be ignored that the within-field effect may act as a confounding of the performed observation. With the wording “within-field effect”, the ensemble of differences from plant to plant modulated by the position in the field is typically considered, related to sun exposition, ground composition or water availability. In other words, as brilliantly summarized by Bramley [33], vineyards are variable. To gain a first impression about the existence of characteristics of the grapes metabolome modulated by the position in the field, differences were looked for between rows A and B cultivated according to the same protocol.
The two-ways Anova model, set up to hive off the production year effect from the within-field effect, revealed that wines produced from grapes picked from row A, oriented westward, were characterized by a significantly higher concentration of trigonelline and a lower concentration of trehalose than wines from row B (Table 3). As rows A and B were 3 m apart, and the two couples of rows were almost 30 m apart, the hypothesis that this result was probably due to the sun exposure, more than field characteristics, is formulated.
3.4. Biodynamic vs. Organic Vinification Protocol
To highlight the effects of the vinification protocol on the wine metabolome, the PCA was performed on the NMR spectra of the 2012 samples (Figure 4(a)). The first component of the corresponding scoreplot, accounting for the 51.8% of the total variance of the dataset, was indeed dominated by the effect of vinification protocol. In this respect, tyrosine seemed to play the major role, as highlighted by the loadingplot superimposed to the scoreplot, with high concentration obtained with the organic vinification protocol. Along the second principal component, accounting for 23.9% of the total samples variance, a clear pattern can be observed modulated by the vineyard management, so that ORG grapes were high in resveratrol and low in trans-caffeic acid content. The dendogram of cluster analysis has further improved the possibility to simultaneously and separately observe the two patterns generated by the vineyard management and by the vinification protocol (Figure 4(b)), In fact, the plot of samples Euclidean distances in the space built on the points constituting the NMR spectra showed a clear branches separation that reflect the greater effect of the vinification protocol compared to the vineyard management, with the row effect still visible, even if to low extent.
Table 2. Differences between ORG and BIO wines expressed as intergroup/intragroup Euclidean distance ratio. For a direct comparison, such ratio has been set to 1 for 2010 and accordingly scaled for the following years.
Table 3. Concentration (M/l) of wine compounds with significant differences (P < 0.05) ascribable to row of origin, as assessed by a two-ways Anova model. The concentration of each compound was calculated from the NMR signal (chemical shift: ppm) as due to a single proton.
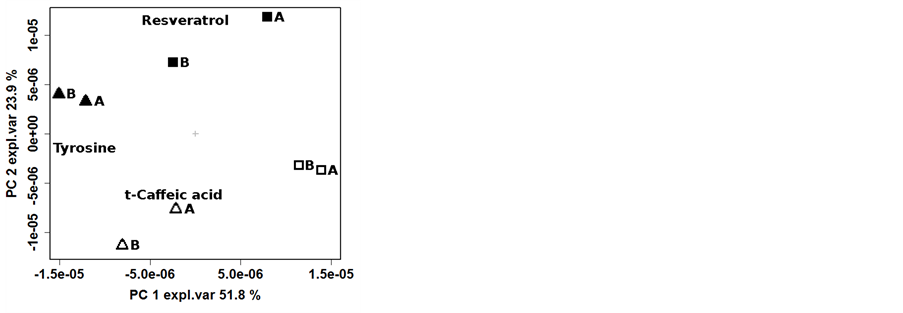
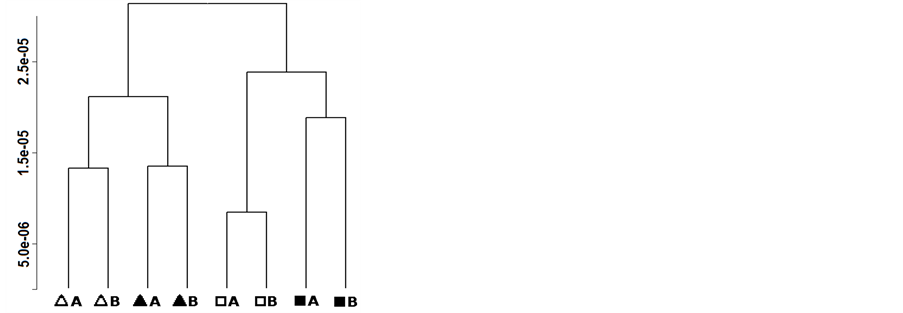
Figure 4. Biplot of the first two PCA components (left) and dendrogram based on the Euclidean distances (right) calculated on the centered NMR spectra of samples collected in 2012. Legend: ORG-CSY 2012 ( ), ORG-SPO 2012 (
 ), BIO-CSY 2012 (
 ) and BIO-SPO 2012 (
 ).
).
REFERENCES
- A. P. Vastola, “Vino Biodinamico: Un’Opportunità Economica ed Etica,” Book of Abstracts of the 31st World Congress of Vine and Wine, 15-20 June 2008, Verona.
- D. Nigro, “Green Revolutionaries. West Coast Winegrowers Fight to Save the Environment,” The Wine Spectator, Vol. 32, No. 6, 2007, pp. 56-71.
- A. Miceli, C. Negro, L. Tommasi and P. De Leo, “(DOC) Wines and Wines Obtained from Organic Farming,” Journal of Wine Research, Vol. 14, No. 2-3, 2003, pp. 115-120. http://dx.doi.org/10.1080/09571260410001678030
- H. K. Yıldırım, A. Üren and U. Yücel, “Evaluation of Biogenic Amines in Organic and Non-Organic Wines by HPLC OPA Derivatization” Food Technology and Biotechnology, Vol. 45, No. 1, 2007, pp. 62-68.
- L. Yanez, J. Saavedra, C. Martinez, A. Cordova and M. A. Ganga, “Chemometric Analysis for the Detection of Biogenic Amines in Chilean Cabernet Sauvignon Wines: A Comparative Study between Organic and Nonorganic Production,” Journal of Food Science, Vol. 77, No. 8, 2012, pp. T143-T150. http://dx.doi.org/10.1111/j.1750-3841.2012.02796.x
- J. Mulero, F. Pardo and P. Zafrilla, “Effect of Principal Polyphenolic Components in Relation to Antioxidant Activity in Conventional and Organic Red Wines during Storage,” European Food Research and Technology Vol. 229, No. 5, 2009, pp. 807-812. http://dx.doi.org/10.1007/s00217-009-1117-x
- J. Mulero, F. Pardo and P. Zafrilla, “Antioxidant Activity and Phenolic Composition of Organic and Conventional Grapes and Wines,” Journal of Food Composition and Analysis Vol. 23, No. 6, 2010, pp. 569-574. http://dx.doi.org/10.1016/j.jfca.2010.05.001
- S. Tinttunen and P. Lehtonen, “Distinguishing Organic Wines from Normal Wines on the Basis of Concentrations of Phenolic Compounds and Spectral Data,” European Food Research and Technology Vol. 212, No. 3, 2001, pp. 390-394. http://dx.doi.org/10.1007/s002170000265
- J. Mulero, P. Zafrilla, J. M. Cayuela, A. Martínez-Cachá and F. Pardo, “Antioxidant Activity and Phenolic Compounds in Organic red Wine Using Different Winemaking Techniques,” Journal of Food Science, Vol. 76, No. 3, 2011, pp. C436-C440. http://dx.doi.org/10.1111/j.1750-3841.2011.02104.x
- B. Gordillo, M. I. López-Infante, P. Ramírez-Pérez, M. L. González-Miret and F. J. Heredia, “Influence of Prefermentative Cold Maceration on the Color and Anthocyanic Copigmentation of Organic Tempranillo Wines Elaborated in a Warm Climate,” Journal of Agricultural and Food Chemistry Vol. 58, No. 11, 2010, pp. 6797-6803. http://dx.doi.org/10.1021/jf100084x
- D. Cozzolino, M. Holdstock, R. G. Dambergs, W. U. Cynkar and P. A. Smith, “Mid Infrared Spectroscopy and Multivariate Analysis: A Tool to Discriminate between Organic and Non-Organic Wines Grown in Australia,” Food Chemistry Vol. 116, No. 3, 2009, pp. 761-765. http://dx.doi.org/10.1016/j.foodchem.2009.03.022
- P. Plahuta and P. Raspor, “Comparison of Hazards: Current vs. GMO Wine,” Food Control Vol. 18, No. 5, 2007, pp. 492-502. http://dx.doi.org/10.1016/j.foodcont.2005.12.007
- A. Tassoni, N. Tango and M. Ferri, “Comparison of Biogenic Amine and Polyphenol Profiles of Grape Berries and Wines Obtained Following Conventional, Organic and Biodynamic Agricultural and Oenological Practices,” Food Chemistry, Vol. 139, No. 1-4, 2013, pp. 405-413. http://dx.doi.org/10.1016/j.foodchem.2013.01.041
- R. Guzzon, M. Malacarne and R. Larcher, “Evolution of Yeast Populations during Different Biodynamic Winemaking Processes” South African Journal of Enology and Viticulture, Vol. 32, No. 2, 2011.
- R. M. Callejon, A. Clavijo, P. Ortigueira, A. M. Troncoso, P. Paneque and M. L. Morales, “Volatile and Sensory Profile of Organic Red Wines Produced by Different Selected Autochthonous and Commercial Saccharomyces cerevisiae Strains,” Analytica Chimica Acta Vol. 660, No. 1-2, 2010, pp. 68-75. http://dx.doi.org/10.1016/j.aca.2009.09.040
- S. Mann, A. Ferjani and L. Reissig, “What Matters to Consumers of Organic Wine?” British Food Journal, Vol. 114, No. 2, 2012, pp. 272-284. http://dx.doi.org/10.1016/j.aca.2009.09.040
- J. C. Lindon, J. K. Nicholson and E. Holmes, “The Handbook of Metabonomics and Metabolomics,” Access Online via Elsevier, Amsterdam, 2011.
- J. Nicholson, J. Lindon and E. Holmes, “‘Metabonomics’: Understanding the Metabolic Responses of Living Systems to Pathophysiological Stimuli via Multivariate Statistical Analysis of Biological NMR Spectroscopic Data,” Xenobiotica Vol. 29, No. 11, 1999, pp. 1181-1189. http://dx.doi.org/10.1080/004982599238047
- I. Bertini, A. Calabro, V. De Carli, C. Luchinat, S. Nepi, B. Porfirio, et al., “The Metabonomic Signature of Celiac Disease,” Journal of Proteome Research Vol. 8, No. 1, 2009, pp. 170-177. http://dx.doi.org/10.1021/pr800548z
- J. L. Ward, J. M. Baker and M. H. Beale, “Recent Applications of NMR Spectroscopy in Plant Metabolomics,” FEBS Journal Vol. 274, No. 5, 2007, pp. 1126-1131. http://dx.doi.org/10.1111/j.1742-4658.2007.05675.x
- E. López-Rituerto, F. Savorani, A. Avenoza, J. S. H. Busto, J. S. M. Peregrina and S. B. Engelsen, “Investigations of La Rioja Terroir for Wine Production Using 1H NMR Metabolomics,” Journal of Agricultural and Food Chemistry Vol. 60, No. 13, 2012, pp. 3452-3461. http://dx.doi.org/10.1021/jf204361d
- G. Picone, B. Mezzetti, E. Babini, F. Capocasa, G. Placucci and F. Capozzi, “Unsupervised Principal Component Analysis of NMR Metabolic Profiles for the Assessment of Substantial Equivalence of Transgenic Grapes (Vitis vinifera),” Journal of Agricultural and Food Chemistry Vol. 59, No. 17, 2011, pp. 9271-9279. http://dx.doi.org/10.1021/jf2020717
- R. Spaccini, P. Mazzei, A. Squartini, M. Giannattasio and A. Piccolo, “Molecular Properties of a Fermented Manure Preparation Used as Field Spray in Biodynamic Agriculture,” Environmental Science and Pollution Research Vol. 19, No. 9, 2012, pp. 4214-4225. http://dx.doi.org/10.1007/s11356-012-1022-x
- M. F. Alum, P. A. Shaw, B. C. Sweatman, B. K. Ubhi, J. N. Haselden and S. C. Connor, “4,4-Dimethyl-4-Silapentane-1-Ammonium Trifluoroacetate (DSA), a Promising Universal Internal Standard for NMR-Based Metabolic Profiling Studies of Biofluids, Including Blood Plasma and Serum,” Metabolomics Vol. 4, No. 2, 2008, pp. 122-127. http://dx.doi.org/10.1007/s11306-008-0103-9
- K. R. Coombes, H. A. Fritsche, C. Clarke, J.-N. Chen, K. A. Baggerly, J. S. Morris, et al., “Quality Control and Peak Finding for Proteomics Data Collected from Nipple Aspirate Fluid by Surface-Enhanced Laser Desorption and Ionization,” Clinical Chemistry Vol. 49, No. 10, 2003, pp. 1615-1623. http://dx.doi.org/10.1373/49.10.1615
- M. K. H. Liland, T. Almy and B.-H. Mevik, “Optimal Choice of Baseline Correction for Multivariate Calibration of Spectra,” Appied Spectroscopy, Vol. 64, No. 9, 2010, pp. 1007-1016. http://dx.doi.org/10.1366/000370210792434350
- F. Savorani, G. Tomasi and S. B. Engelsen, “I Coshift: A Versatile Tool for the Rapid Alignment of 1D NMR Spectra,” Journal of Magnetic Resonance Vol. 202, No. 2, 2010, pp. 190-202. http://dx.doi.org/10.1016/j.jmr.2009.11.012
- F. Dieterle, A. Ross, G. Schlotterbeck and H. Senn, “Probabilistic Quotient Normalization as Robust Method to Account for Dilution of Complex Biological Mixtures. Application in 1H NMR Metabonomics,” Analytical Chemistry Vol. 78, No. 13, 2006, pp. 4281-4290. http://dx.doi.org/10.1021/ac051632c
- D. Delmas, A. Lançon, D. Colin, B. Jannin and N. Latruffe, “Resveratrol as a Chemopreventive Agent: A Promising Molecule for Fighting Cancer,” Current Drug Targets Vol. 7, No. 4, 2006, pp. 423-442. http://dx.doi.org/10.2174/138945006776359331
- R. E. King, J. A. Bomser and D. B. Min, “Bioactivity of Resveratrol,” Comprehensive Reviews in Food Science and Food Safety Vol. 5, No. 3, 2006, pp. 65-70. http://dx.doi.org/10.1111/j.1541-4337.2006.00001.x
- E. Melgarejo, J. L. Urdiales, F. Sánchez-Jiménez and M. Á. Medina, “Targeting Polyamines and Biogenic Amines by Green Tea Epigallocatechin-3-Gallate,” Amino Acids Vol. 38, No. 2, 2010, pp. 519-523. http://dx.doi.org/10.1007/s00726-009-0411-z
- M. Iriti and F. Faoro, “Plant Defense and Human Nutrition: Phenylpropanoids on the Menu,” Current Topics in Nutraceutical Research, Vol. 2, No. 2, 2004, pp. 47-65.
- R. G. V. Bramley and R. P. Hamilton, “Understanding Variability in Winegrape Production Systems,” Australian Journal of Grape and Wine Research Vol. 10, No. 1, 2004, pp. 32-45.
NOTES
*Corresponding author.