Food and Nutrition Sciences
Vol. 4 No. 6 (2013) , Article ID: 32920 , 10 pages DOI:10.4236/fns.2013.46084
An Environment Friendly, Low-Cost Extraction Process of Phenolic Compounds from Grape Byproducts. Optimization by Multi-Response Surface Methodology
![]()
1Département des Sciences de la Vie et de la Terre, Centre d’Analyse et de Recherche, Faculté des Sciences, Université Saint-Joseph de Beyrouth, Beirut, Lebanon; 2UTC/ESCOM, EA 4297 TIMR, Département de Génie des Procédés Industriels, Laboratoire Transformations Intégrées de la Matière Renouvelable, Université de Technologie de Compiègne, Centre de Recherche de Royallieu, Compiègne, France.
Email: *richard.maroun@usj.edu.lb
Copyright © 2013 Hiba N. Rajha et al. This is an open access article distributed under the Creative Commons Attribution License, which permits unrestricted use, distribution, and reproduction in any medium, provided the original work is properly cited.
Received March 26th, 2013; revised April 28th, 2013; accepted May 4th, 2013
Keywords: Phenolic Compounds; Grape Byproducts; Extraction Optimization; Free Radical Scavenging Activity; Response Surface Methodology
ABSTRACT
Due to their beneficial effects on human health, phenolic compounds are increasingly attracting the attention of scientists and researchers all over the world. The main interest is in the extraction process of those natural plant-originated compounds from fruits, vegetables and plant wastes, namely grape wastes, in which phenolic compounds are the most abundant secondary metabolites. This waste exploitation not only re-assimilates those byproducts into the food cycle, but also avoids major environmental problems. Herein, the optimization of the phenolic compounds concentration and free radical scavenging activity from Cabernet Sauvignon grape byproducts was conducted, using multi-response surface methodology. A conventional solid-liquid extraction process was performed with pure water as a solvent to study the effects of both time and temperature on the procedure. The maximal phenolic compounds concentration (878.9 mg/L) was reached at 47˚C after 30 hours while the optimal free radical scavenging activity (41.15%) was obtained at 30˚C after 20 hours. A multi-response surface methodology compromised between the quantity and the quality of the extracted phenolics, and the parameters maximizing both responses were obtained at 37˚C and 28 hours. This low-cost and energy saving process provides an excellent tool for further industrial applications.
1. Introduction
Exceeding 60 million tons of annual production, grape is one of the major cultivated fruit crops in the world. Viniculture is a significant agricultural activity in a lot of southern Europe [1] and Mediterranean countries [2]. The Mediterranean diet, rich in fruits and vegetables, explains the increase in life expectancy in this region, as epidemiological studies have linked this consumption to the fight against diseases related to oxidative stress [3]. Currently, and with the development in means of analysis, we can associate this value to the main responsible food components: bioactive molecules, especially, phenolic compounds [4]. These are divided into two major classes, the non-flavonoids include phenolic acids and stilbenes, while flavonoids, which share the flavone core consisting of a basic skeleton of 15 carbons [5], include three main families of compounds (anthocyanins, flavonols and flavan-3-ols) differing in the degree of oxidation of the central pyran ring [6,7]. Besides having many physiological functions in the plant itself [8], phenolic compounds also have many biological effects for the plants consumers. Apart from their antibacterial, antifungal and antiviral effects [9,10], phenolic compounds regulate the plasma lipids and oxidative stress [9], they protect against atherosclerosis, brain dysfunction, and cancer [11], also playing a role in several degenerative and aging-related diseases [12,13]. Phenolic compounds inhibit the in vitro degradation of DNA induced by hydrogen peroxide and reduce the oxidation of polyunsaturated fatty acids [14]. The importance of those compounds is not limited to individual and public health interests; but is highly connected to their industrial application in many fields such as cosmetics, pharmaceutics, agriculture etc., therefore the global focus is on the environment friendly phenolic compounds extraction methods based on the use of green technology. By reason of their diverse application fields, the extraction and isolation of phenolic compounds from fruits and vegetables have been conducted, however the search for renewable sources attracted scientists towards waste products. Grape byproducts are a rich source of phenolic compounds, ethanol [15], tartrates [16], citric acid [17], malic acid [18] and alimentary fibers [19]. They have been re-assimilated into the food cycle, avoiding major environmental problems, especially those of the phenols increased chemical and biochemical oxygen demands [20]. Consisting of seeds, pulp, skins and stems, grape wastes, are the rest of the winemaking process, representing 20% of the processed grapes weight [21]. Grape skins and seeds contain flavonoids (catechin, epicatechin, procyanidins and anthocyanins), phenolic acids (gallic acid and ellagic acid) and stilbenes (resveratrol and piceid) [22]. Phenolic compounds Industrial extraction from grape pomace is a batch or continuous process, joining water with other solvents, namely, ethanol, methanol or sulphur dioxide. Moderate temperatures (50˚C - 60˚C) and rather long times (3 - 20 hr) are performed in the conventional extraction process [23]. In this study, we optimized the solid-liquid extraction of phenolic compounds from grape wastes avoiding the use of organic solvents, since they represent a non-negligible cost to the industry and are not recommended for pharmaceutical, cosmetic and food applications [24]. A response surface methodology (RSM), with a two-variable central composite design was performed. The aim of the work was to obtain a significant amount of bioactive molecules, modifying the extraction experimental conditions, compromising thus between quantity and quality. We determined the optimal parameters, time and temperature, which allow the extraction of the highest phenolic compounds concentration using water as a solvent. This work meets the sustainable development concept by the optimization process itself, since it reduces time and energy consumption, and by the substitution of an organic solvent with water, which is a cheaper more ecological and available solvent. Regarding the final target of utilizing the extracted bioactive molecules in many fields related to human consumption, the remaining organic residues in the extracts are not of a concern, since the extraction process is held in water, a food safe solvent. The use of no complicated machinery, no pretreatment of the grape byproducts, no extreme heating and no organic solvent, simplified the energy and cost of the process making this method a conventional environment friendly extraction process. This could be easily adapted to several industrial applications.
2. Materials and Methods
2.1. Reagents
All reagents were of analytical grade. The Folin’s phenol reagent (Sigma Chemical Co., St. Louis, MO, USA) and sodium carbonate (Fluka, Buchs, Switzerland) were utilized to measure the total phenolic compounds concentrations using the Folin-Ciocalteu method; the calibration curve was built with gallic acid (Sigma Chemical Co., St. Louis, MO, USA). The phenolic compounds standards BHT and resveratrol, Tris-HCL buffer (Sigma Chemical Co., St. Louis, MO, USA) and DPPH (Merck, Darmstadt, Germany) were used in the free radical scavenging activity test. The samples dilutions were done by pure ethanol and methanol (Merck, Darmstadt, Germany).
2.2. Sample Preparation
The Cabernet Sauvignon grape byproducts were provided by château KSARA (Beqaa Valley, Lebanon). On arrival the raw material was stored at −20˚C until utilization. Defrosted at room temperature, the grape byproducts were milled to a particle size of 2 mm. The aqueous phenolic compounds extraction process was done with a solid/liquid ratio of 1:4 (w/v). The fixed particle size and solid/liquid ratio were chosen based on the work already done by Spigno et al. 2007 [25]. After the solid-liquid conventional extraction process was accomplished, the extracts were filtrated and analyzed.
2.3. Total Phenolic Compounds Determination
According to the Folin-Ciocalteu method previously described by Slinkard and Singleton 1977 [26], an aliquot of 10 μL of the sample solution was mixed with 100 μL of commercial Folin-Ciocalteu reagent and 1580 μL of water. After a brief incubation at room temperature (5 min), 300 μL of saturated sodium carbonate was added. The color generated was read after 2 hr at room temperature at 760 nm using a UV-Vis spectrophotometer (UV- 9200, BioTECH Engineering Management, UK). The correlation between the absorbance and gallic acid concentrations creates a calibration standard curve. The Phenolic Compounds Concentration (PCC) of the samples was expressed as gallic acid equivalent (mg/L). Phenolic Compounds Yield (PCY) derived from these values was given by transforming milligrams of Gallic Acid Equivalent (GAE) per liter (mg GAE/L) into grams of GAE per 100 g of grape dry matter (g GAE/100 g DM).
2.4. Free Radical Scavenging Activity
According to several published results [27,28], the free radical scavenging activity was measured by the capacity of the phenolic compounds contained in the samples to reduce DPPH (2,2-Diphenyl-picrylhydrazyl), a stable free radical. The free radical scavenging of extracts were examined by comparing to those of known antioxidants such as butylhydroxytoluene (BHT) (a synthetic antioxidant) and resveratrol (a natural antioxidant) by DPPH. 50 mL of various sample extracts concentrations (50 - 10 - 5 and 1 mg/mL) or positive control (BHT and resveratrol) diluted in pure ethanol were added to 450 mL of Tris-HCl buffer solution (50 mM, pH 7.4). 1.5 mL of DPPH Solution (0.1 mM) was added to the mixture. Absorbance at 517 nm was measured after 30 min of incubation at room temperature using pure methanol as a blank. All samples were analyzed in duplicate. The inhibition percentage of the DPPH free radical is calculated as follows: Inhibition Percentage = [(absorbance of control − absorbance of sample)/absorbance of control] × 100. The free radical scavenging activity of Cabernet Sauvignon grape byproducts extracts was evaluated by the decrease in the peak area of the DPPH radical which exhibits a deep purple color with maximum absorption at 517 nm.
2.5. Selection of the Appropriate Extraction Parameters
The target of an extraction process is, no doubt, the maximization of a certain substance’s yield and quality [20]. Focusing on this aim many variables have been investigated such as solvent/sample ratio, particle size, type of solvent, time, temperature of extraction, etc. In the present paper, the added objective to the main goals is the development of a low-cost environment friendly extraction process applicable on industrial scale avoiding the use of organic solvents. Particle size reduction enhances the extraction process by increasing the superficial area of mass transfer [20] like reported for crushed than uncrushed grape marc [29]. A particle size of 2 mm was adopted in this study based on some of the literature’s work [20,25]. As for the choice of the solvent, pure water, a food safe solvent was selected mainly due to its accessibility, low cost and environment friendly advantages, especially on industrial-scale applicability. Time and Temperature are important parameters to study not only to maximize phenolic compounds concentration and bioactivity in the extracts but also to minimize the energy cost of the process. The determination of the extraction time and temperature intervals was the result of a preliminary study in which phenolic compounds extraction from milled grape pomace was conducted at room temperature, 40˚C, 50˚C and 60˚C quantifying the total phenolic content by Folin-Ciocalteu method after 12, 24, 36, 48, 60 and 72 hours. Based on the results, the lower and upper levels of both variables were chosen for the Response Surface Methodology study.
2.6. Experimental Design
Optimization of phenolic compounds extraction from Cabernet Sauvignon grape byproducts in water was carried out using RSM. A rotatable central composite design was developed to assess the main impact of two factors: extraction time (t), extraction temperature (T), and their interaction on total Phenolic Compounds Concentration (PCC) and free Radical Scavenging Activity (RSA). Temperature values varied between 30˚C and 50˚C and time between 20 and 40 hours. The two independent variables were coded at five levels (−α, −1, 0, 1, α) resulting in an experimental design of twelve experimental points including four central points, i.e. the repeatability of the measurements at the center of the experimental design. All the factor levels are reported in Table 1. Considering two parameters and two responses, experimental data were fitted to obtain a second-degree regression equation of the form:
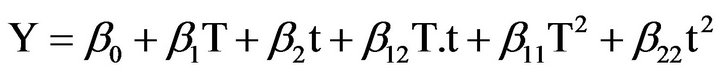
where Y is the predicted response parameter, β0 is the mean value of responses at the central point of the experiment; β1 and β2 are the linear coefficients, β11 and β22 the quadratic coefficients and β12 the interaction coefficient. The optimization process by Response Surface Methodology (RSM), took into consideration t and T as two independent variables. Experimental design and statistical treatment of the results were performed using STATGRAPHICS Plus for Windows 4.0. The software was used to generate response surfaces and contour plots.
3. Results and Discussion
3.1. Phenolic Compounds Concentration and Free Radical Scavenging Activity
The response surface methodology study was conducted in the aim of determining the experimental conditions for optimal phenolic compounds concentration (PCC) and free radical scavenging activity (RSA). In Table 1, the two independent variables, which are the experimental parameters (time (t) and temperature (T)), are shown, with their lower, middle and upper design points for RSM in coded and uncoded (natural) values. The latter
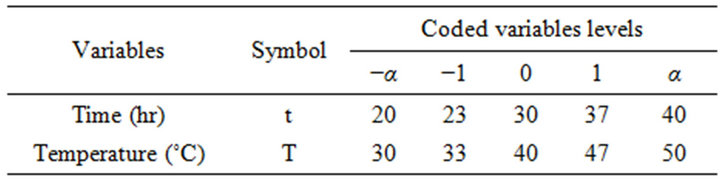
Table 1. Independent variables and their levels used for central composite rotatable design.
are modified into dimensionless coded variables with a mean zero and the same standard deviation [30].
In Table 2, are presented the employed experimental design and the data of the responses, which are the PCC and the RSA represented by the inhibition percentage, at different experimental combinations for the coded variables, using pure water as the extraction solvent. The PCC ranged from 288 to 852 mg/L and the resulting PCY equivalent to g GAE/100 g DM (Table 3), ranged from 0.23 to 0.68 g GAE/100 g DM. In general, and compared to other agricultural materials such as oat hulls (0.056 g/100 g of solid) and apple byproducts (0.11 g/100 g) [31,32], phenolic compounds extraction from grape pomace using water, gave higher yields than those obtained when extracted with organic solvents. Robards et al. 2000 [33] described that the total phenolics in grape extracts vary in the range of 0.2 to 2 g GAE/100 g and that the upper total phenolic compounds limit can reach 6 g GAE/100 g DM in aqueous methanol extraction. Results found in this study are within the mentioned range although pomace and not grape is the starting material; therefore the efficiency of the solid-liquid water extraction process adopted in this paper is highlighted. The utilized raw material and solvent are probably the explanation for the relatively low yield as compared to the upper limit of 6 g GAE/100 g. As compared to grape pomace, Escarpa and Gonzáles 2001 [34] found a 0.8 g GAE/100 g phenolic compound yield when using red wine pomace. The free radical scavenging activity ranged from 11% to 33% giving analogous values to the RSA obtained for aqueous extraction of phenolic compounds from red distilled Garnacha grapes byproducts, ranging from 2.8% to 34.41% [35], but giving superior activity to those given from Pinot Noir grape byproducts ranging from 1.2% to 6.2% [36]. In comparison with phenolic compounds extracts from Cabernet Franc grapes, El Darra et al. 2012 [37] showed a 52% inhibition percentage. Regarding the difference of the raw material, the extraction solvent and therefore the diversity of the resulting extracts in phenolic compounds, a highest free radical scavenging activity could be expected for grape extracts as compared to grape pomace extracts, especially that a phenolic quantity is partially transferred from grapes to wine during the winemaking process [38]. The PCY and RSA ranges come in agreement with other previous findings implying that solid-liquid extraction process of phenolic compounds from grape pomace with pure water is quite efficient.
3.2. Experimental Modelization and Statistics
All response values were shown by statistical analyses to fit best the second order polynomial model (Table 4). The latter expresses the relation between the response variable (PCC and RSA) and the test variables (t and T) obtained by the application of a multiple regression analysis on the experimental data. The regression equations allow the calculation of the predicted values of PCC and RSA in order to be compared with experimental values (Table 2). The predicted values are analyzed for the calculation of the coefficients of determination (R2), which, generated by the software can demonstrate the significance of each experimental variable. The coefficients of determination values (R2) were 93.7% and 99.5% for the experimental design of PCC and RSA,
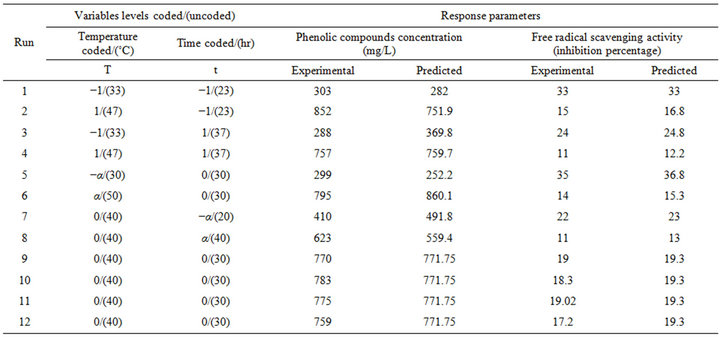
Table 2. Central composite arrangement for independent variables and their responses for water extraction process.
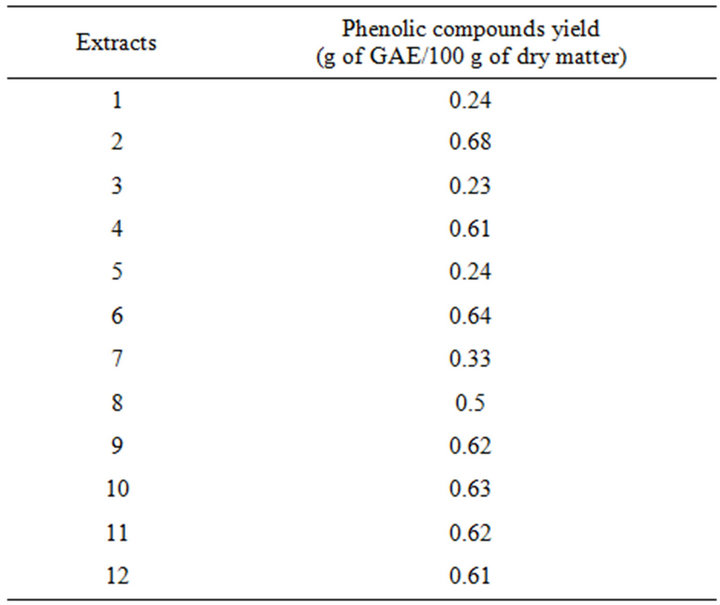
Table 3. Phenolic compounds yield (g of GAE/100 g of DM).
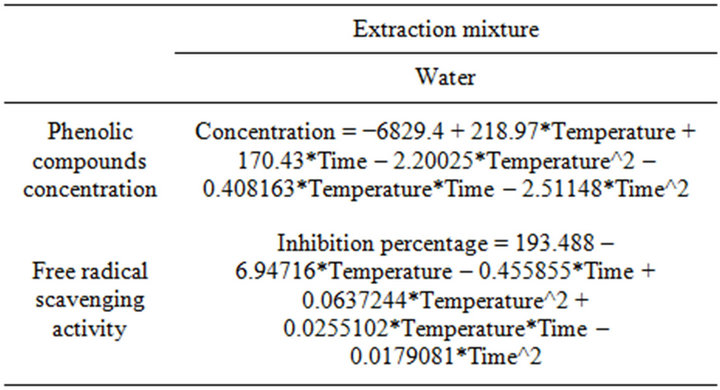
Table 4. Second order polynomial equations relating response variables (PCC and RSA), to test variables (Temperature: T, and Time: t).
respectively. The closeness to 1 of the R2 Values for PCC and RSA indicates a high degree of correlation between the observed and predicted values, which means that a reasonable agreement of the corresponding models with the experimental results is found. Using ANOVA table, the coefficients of regression analysis was carried out, enabling the determination of the Lack of fit significance of each extraction model avoiding hence poor and misleading results [30]. The model representing the free radical scavenging activity is of a high adequacy to reality conditions (P value = 0.69), nevertheless, the significance of the lack of fit (P < 0.05) found for the model representing the phenolic compounds concentration (P value = 0.0014) doesn’t mean that the model is not valid, but that the manipulator’s error calculated from the repetitions at the field centre is lower than the error induced by the model.
3.3. Parameters Significance
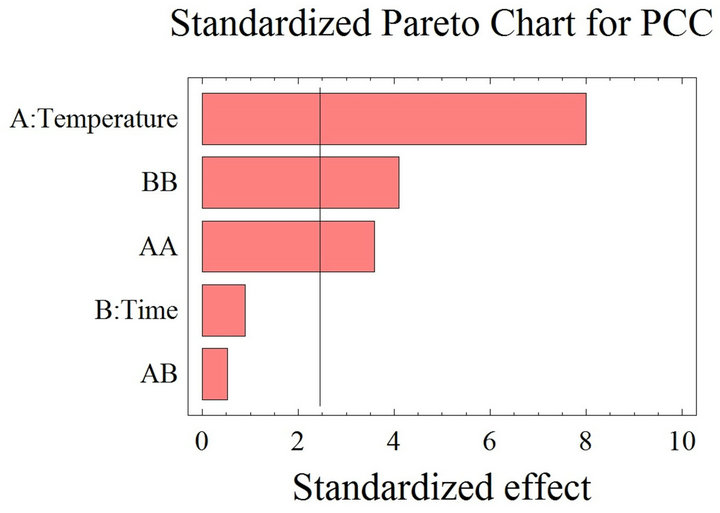
The positive or negative impact of many variables (temperature, time contact, solvent-to-solid ratio etc.) on the mass transfer of the extraction process is not always obvious. Each system consisting of a material-solvent combination shows an unpredicted different behavior, probably due to the solvent’s chemical characteristics and the various composition and structure of the natural products [35]. The Pareto charts interpretation shows the threshold of significance at 95% obtained after using the ANOVA test for the analysis of the coefficients of regression models. When the histograms, representing the parameters, cross the vertical line they are statistically considered as significant. According to Figure 1(a), the PCC is positively affected by the temperature, which had a significant linear (T) effect, but negatively affected by the quadratic effect of both time (t2) and temperature (T2). As for the RSA (Figure 1(b)), time (t) and temperature (T) have a significant negative linear effect; the quadratic effect of time (t2) is also negative. On the other hand, the quadratic effect of temperature (T2) and the time temperature (t. T) interaction have positive significant effects on the inhibition percentage. The reported positive and
 (a)
(a)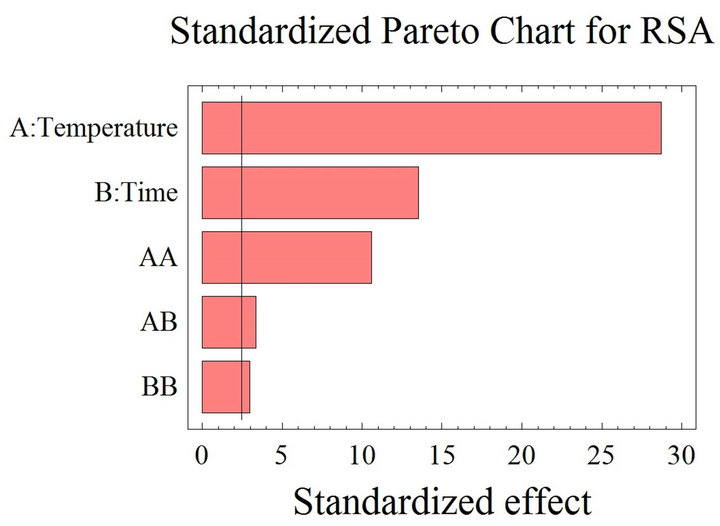 (b)
(b)
Figure 1. (a) Standardized Pareto chart. Analysis shown for phenolic compounds concentration. The variables are time and temperature. It shows the columns/parameters exceeding the vertical bar, which are statistically significant with more than 95% of confidence. (b) Standardized Pareto chart. Analysis shown for the inhibition percentage, representing the radical scavenging activity. The variables are time and temperature. It shows the columns/parameters exceeding the vertical bar, which are statistically significant with more than 95% of confidence.
negative effects of the studied parameters on the phenolic yield and free radical scavenging activity were expected, despite the significant positive effect of temperature elevation on the extraction yield, its augmentation should be limited; the membranes denaturation and phenolic compounds stability are threatened above 50˚C [39,40]. Moreover, subjecting grape pomace to high temperatures might liberate certain phenolic compounds while concurrently promoting possible thermal decomposition of others, which were already released at lower temperatures [41].
Effect of the Extraction Time and Temperature Treatment
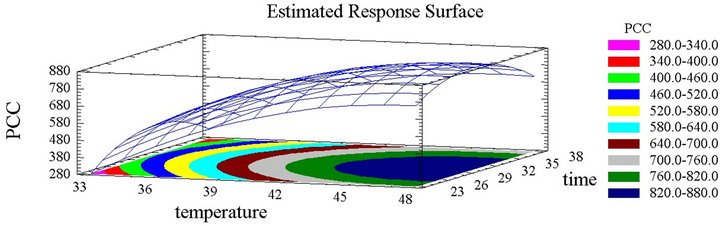
The extraction efficiency was proven to be significantly affected by many factors such as temperature, solvent, time [40] and many others. This effect can be either independent or interactive [42]. Besides Pareto charts, the response surface plots, in their three dimensional illustration, and considering their shape, give valuable data about the significance of each parameter (Figures 2(a) and (b)). It is clearly obvious that the temperature parameter significantly affects the concentration positively since obvious ascent steepness reflects the increase of PCC with the increase of temperature. The total phenolic content reached its peak at 50˚C, which is the highest temperature tested. Similarly the increase in time led to a gradual increase in the total phenolic content, which attained its maximum after 30 hours. Nevertheless this rise with time is followed by a decline since the steepness in the inclination of the plot descents beyond this period (Figure 2(a)). Time has therefore a quadratic significant negative effect. The above results were expected, since the temperature’s augmentation increases the mass transfer and the solubilization of the solutes reducing the surface tension and viscosity [43,44]. The higher the temperature is, the more the solvent is efficient, but with high temperatures and long periods of time, the effect is reversed and the phenolic compounds risk heat oxidation or degradation [22,35]. Spigno and De Faveri 2007 [20] showed higher PCY at 60˚C than at 45˚C accompanied with thermal degradation beyond 20 hours. As for the extraction period many authors chose long extraction times [20,36]. From a recovery point of view, it is more convenient to work with moderate temperatures and long periods of times [25]. In this work, a decrease of the PCY was observed after a 30 hours extraction time.
Further investigations are necessary to associate this reduction to a real degradation phenomenon or polymerization reactions creating new compounds that responds differently to analytical measurements [35]. As for the inhibition percentage representing the free radical scavenging activity of the phenolic compounds, both temperature and time have negative effects, showed by
 (a)
(a)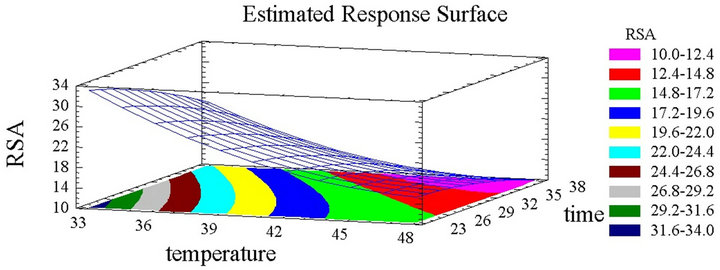 (b)
(b)
Figure 2. (a) Phenolic compounds concentration surface plots. Three-dimensional expressions by surface plots of phenolic compounds concentration. The three-dimensional graphs were plotted between two independent variables (time and temperature). (b) Inhibition percentage surface plots. Threedimensional expressions by surface plots of phenolic compounds concentration. The three-dimensional graphs were plotted between two independent variables (time and tem- -perature).
the descending plots for both parameters (Figure 2(b)). The highest free radical scavenging capacity of those compounds is observed when extracted at low time and temperature since the competition between the extraction and the oxidation phenomena is manifested at high temperatures and long periods of time. Considering the solvent choice, literature review shows several solvent mixtures for phenolic compound extraction from grape materials, like acetone, methanol and ethanol [20,35,45-50].
Despite the capacity of these solvents to elevate the PCY, we found that phenolic compounds aqueous extraction is cheaper and more environment friendly, since no recycling of the organic solvent is of a concern, nor its removal from the final extracts. The benefit of this study is highlighted when considering an industrial-scale extraction process; regarding the enormous decrease in the cost and energy consumption. The optimal conditions for maximizing the phenolic compounds yield were shown by this model to be a 30 hours extraction time at a 47˚C temperature, while the optimal RSA was reached after 20 hours at 30˚C, as shown in Table 5. In order to seek the extraction of increased phenolic compounds yields enhancing simultaneously the quality of the extracts, a simultaneous response optimization is necessary to compromise between both response variables.
3.4. Simultaneous Response Optimization
Response Surface Methodology has proven to be an efficient tool in the maximization of several responses,
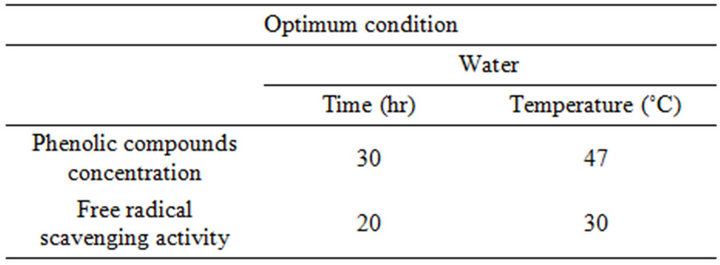
Table 5. Optimum experimental conditions for maximal extraction concentrations and free radical scavenging activities.
optimizing thus experimental conditions [39,41,51,52] that cannot be generalized regarding the diverse nature of plant material antioxidants [35]. The optimization of the PCC and the RSA were effected separately, and the parameters giving the highest quantity, and free radical scavenging activity were revealed. Nevertheless, the final goal is the compromise between the concentration and the bioactivity; this is why desirability function in the response surface methodology was used, to show simultaneously the two responses (PCC and RSA) affected by the combination of the experimental parameters (t and T). In this study, the desirability was set to show the best conditions that maximize the PCC and RSA at the same time (Figure 3). The graphic of the outlines superposetion shows that the concentric circles of the PCC and RSA are convergent towards opposite localization, which is expected, since the temperature is known to increase the coefficient of diffusion and solubility of the solvent [20,35,53,54], while the heating process negatively affects the quality of the phenolic compounds, vulnerable to oxidation and degradation, thus their RSA decreases. Nevertheless, a compromise between the experimental parameters should be made, enabling the extraction of a significant quantity of bioactive molecules, hence, the optimal conditions maximizing both the PCC and RSA of grape byproducts extracts through conventional heated water extraction were found to be: 37˚C and 28 hours, for the obtainment of 645 mg/L phenolic compounds with an RSA of 23%. Regarding the method’s simplicity, cost and accessibility, the obtained phenolic compounds quantity and activity are valuable. Finally, it is worth mentioning that the interpretation of the simultaneous response optimization is relative to the necessity. For instance, on an industrial scale, the extraction time reduction is more beneficial in terms of energy even with a slight loss of quantity; whereas for pharmaceutical or nutraceutical applications, the main focus is on the bioactive properties of phenolic compounds and not their quantity, therefore the results of this study can be adapted to fit different necessities. An accurate economical evaluation of the extraction process energy cost v/s the overall production cost will allow the confirmation of our choice of parameters and solvent.
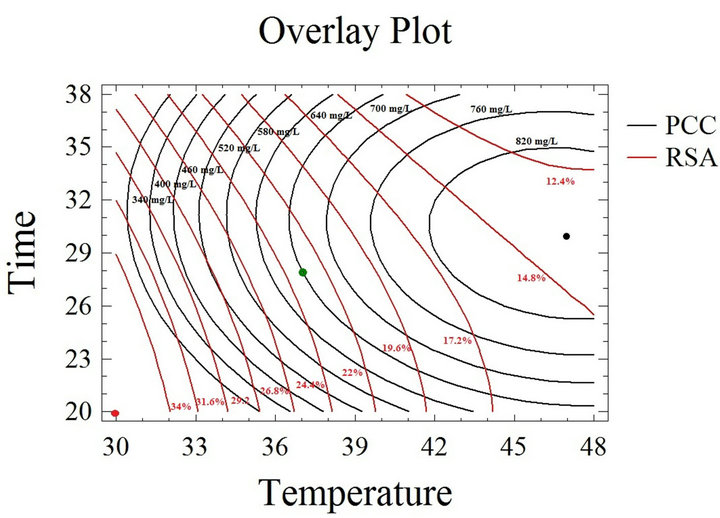
Figure 3. Desirability analysis. Superposition plots, showing the best experimental parameters (time and temperature) that maximize both phenolic compounds concentration and radical scavenging activity in water extraction solvent. The green spot shows the parameters that compromise between the phenolic compounds concentration and the inhibition percentage. The black spot shows the optimal parameters for the phenolic compounds concentration while the red is for the free radical scavenging activity.
4. Conclusion
Cabernet Sauvignon grape byproducts are a rich source of phenolic compounds. The application of these active molecules in many industries steadily increases. Therefore, the economical applicability of a large-scale extraction process involves the maximization of its efficiency, searching for optimal extraction conditions. This study targeted the low-cost, environment friendly valorization of grape byproduct; thus, both the phenolic content and free radical scavenging activity were maximized, varying the extraction time and temperature. The optimization of the experimental parameters permitted the obtainment of high quality and quantity phenolic compounds extracts. The response surface methodology showed that the highest PCC (878.9 mg/L) is obtained by a conventional extraction with water at 47˚C after 30 hours, while the highest RSA (41%) is obtained at 30˚C after 20 hours. In order to compromise between both responses, a multiresponse optimization was performed, showing that the maximal PCC (645.2 mg/L) and RSA (23%) were obtained when extracting at 37˚C for 28 hours. The results of this study confirm the efficiency of solid-liquid extraction with no use of organic solvent. They could be a leading step towards a large-scale implementation process from several industrial applications, considering not only the quantity and quality of the desired substances but also the facility of implementation of such a low-cost environment friendly method.
5. Acknowledgements
The Research Council of Saint Joseph University (Project FS54) and to the society Château KSARA funded this work. We are grateful to Joseph Yaghi for helpful technical assistance.
REFERENCES
- P. Rondeau, F. Gambier, F. Jolibert and N. Brosse, “Compositions and Chemical Variability of Grape Pomaces from French Vineyard,” Industrial Crops and Products, Vol. 43, 2013, pp. 251-254. doi:10.1016/j.indcrop.2012.06.053
- “The Lebanese Observatory for Agricultural Development,” 2001. http://www.loadleb.org/files/agricultural-foodChain/filiere-vegetale/rapport-synthese/RS-Filiere%20Viticoles.pdf
- A. J. Parr and G. P. Bolwell. “Phenols in the Plant and in Man. The Potential for Possible Nutritional Enhancement of the Diet by Modifying the Phenols Content or Profile,” Journal of the Science of Food and Agriculture, Vol. 80, No. 7, 2000, pp. 985-1012. doi:10.1002/(SICI)1097-0010(20000515)80:7<985::AID-JSFA572>3.0.CO;2-7
- D. Del Rio, L. G. Costa, M. E. J. Lean and A. Crozier, “Polyphenols and Health: What Compounds Are Involved?” Nutrition, Metabolism and Cardiovascular Diseases, Vol. 20, No. 1, 2010, pp. 1-6. doi:10.1016/j.numecd.2009.05.015
- O. Palomino, M. P. Gómez-Serranillos, K. Slowing, E. Carretero and A.Villar, “Study of Polyphenols in Grape Berries by Reversed-Phase High-Performance Liquid Chromatography,” Journal of Chromatography A, Vol. 870, No. 1-2, 2000, pp. 449-451. doi:10.1016/S0021-9673(99)01225-X
- M. Bourzeix, E. Weiland and N. Heredia, “A Study of Catechins and Procyanidins of Grape Clusters, the Wine and Other By-product of the Wine,” Bulletin de l’Organisation Internationale de la vigne et du Vin, Vol. 59, 1986, pp. 669-670.
- C. Perret, “Analyse des Tanins Inhibiteurs de la Stilbène Oxydase Produite par Botrytis cinerea,” Ph.D. Thesis, Université de Neuchâtel, Faculté des Sciences, 2001.
- M. Naczk and F. Shahidi, “Phenolics in Cereals, Fruits and Vegetables: Occurrence, Extraction and Analysis,” Journal of Pharmaceutical and Biomedical Analysis, Vol. 41, No. 5, 2006, pp. 1523-1542. doi:10.1016/j.jpba.2006.04.002
- E. Q. Xia, G. F. Deng, Y. J. Guo and H. B. Li, “Biological Activities of Polyphenols from Grapes,” International Journal of Molecular Sciences, Vol. 11, No. 2, 2010, pp. 622-646. doi:10.3390/ijms11020622
- J. Khalil, “Pulsed Electric Field (P.E.F.) and Pectinase for the Extraction of Polyphenols from Grape Pomace and Peel,” Dissertations & Thesis in Food Science and Technology, Paper 16, 2011.
- M. H. Gordon, “Dietary Antioxidants in Disease Prevention,” Natural Product Reports, Vol. 13, No. 4, 1996, pp. 265-273. doi:10.1039/np9961300265
- M. S. Brewer, “Natural Antioxidants: Sources, Compounds, Mechanism of Action, and Potential Applications,” Comprehensive Reviews in Food Science and Food Safety, Vol. 10, No. 4, 2011, pp. 221-247. doi:10.1111/j.1541-4337.2011.00156.x
- D. Procházková, I. Boušová and N. Wilhelmová, “Antioxidant and Prooxidant Properties of Flavonoids,” Fitoterapia, Vol. 82, No. 4, 2011, pp. 513-523. doi:10.1016/j.fitote.2011.01.018
- A. Ojeil, N. El Darra, Y. El Hajj, P. Bou Mouncef, T. J. Rizk and R. G. Maroun, “Identification et Caractérisation de Composés Phénoliques Extraits du Raisin Château KSARA,” Lebanese Science Journal, Vol. 11, No. 2, 2010, pp. 117-131.
- M. L. Silva, A. C. Macedo and F. X. Malcata, “Review: Steam Distilled Spirits from Fermented Grape Pomace,” Food Science and Technology International, Vol. 6, No. 4, 2000, pp. 285-300. doi:10.1177/108201320000600403
- C. Nurgel and A. Canbas, “Production of Tartaric Acid from Pomace of some Anatolian Grape Cultivars,” American Journal of Enology and Viticulture, Vol. 49, No. 1, 1998, pp. 95-99.
- Y. D. Hang and E. E. Woodams, “Grape Pomace: A Novel Substrate for Microbial Production of Citric Acid,” Biotechnology Letters, Vol. 7, No. 1, 1985, pp. 253-254. doi:10.1007/BF01042372
- M. Stredansky and E. Conti, “Xanthan Production by Solid State Fermentation,” Process Biochemistry, Vol. 34, No. 6-7, 1999, pp. 581-587. doi:10.1016/S0032-9592(98)00131-9
- N. Girdhar and A. Satyanarayana, “Grape Waste as a Source of Tartrates,” Indian Food Packer, Vol. 54, 2000, pp. 59-61.
- G. Spigno and D. M. De Faveri, “Antioxidants from Grape Stalks and Marc: Influence of Extraction Procedure on Yield, Purity and Antioxidant Power of the Extracts,” Journal of Food Engineering, Vol. 78, No. 3, 2007, pp. 793- 801. doi:10.1016/j.jfoodeng.2005.11.020
- N. Boussetta, N. Lebovka, E. Vorobiev, H. Adenier, C. Bedel-Cloutour and J. L. Lanoisellé, “Electrically Assisted Extraction of Soluble Matter from Chardonnay Grape Skins for Polyphenol Recovery,” Journal of Agriculture and Food Chemistry, Vol. 57, No. 4, 2009, pp. 1491- 1497. doi:10.1021/jf802579x
- Y. Yilmaz and R. T. Toledo, “Oxygen Radical Absorbance Capacities of Grape/Wine Industry Byproducts and Effect of Solvent Type on Extraction of Grape Seed Polyphenols,” Journal of Food Composition and Analysis, Vol. 19, No. 1, 2006, pp. 41-48. doi:10.1016/j.jfca.2004.10.009
- N. Boussetta, J. L. Lanoisellé, C. Bedel-Cloutour and E. Vorobiev, “Extraction of Soluble Matter from Grape Pomace by High Voltage Electrical Discharges for Polyphenol Recovery: Effect of Sulphur Dioxide and Thermal Treatments,” Journal of Food Engineering, Vol. 95, No. 1, 2009, pp. 192-198. doi:10.1016/j.jfoodeng.2009.04.030
- N. Boussetta, “Intensification de l’Exraction des Polyphé- nols par Electrotechnologies pour la Valorisation des Marcs de Champagne,” Ph.D. Thesis, Université de Technologie de Compiègne, Compiègne, 2010.
- G. Spigno, L. Tramelli and D. M. De Faveri, “Effects of Extraction Time, Temperature and Solvent on Concentration and Antioxidant Activity of Grape Marc Phenolics,” Journal of Food Engineering, Vol. 81, No. 1, 2007, pp. 200-208. doi:10.1016/j.jfoodeng.2006.10.021
- K. Slinkard and V. L. Singleton, “Total Phenol Analysis: Automation and Comparison with Manual Methods,” American Journal of Enology and Viticulture, Vol. 28, No. 1, 1977, pp. 49-55.
- M. A. Gyamfi, M. Yonamine and Y. Aniya, “Free-Radical Scavenging Action of Medicinal Herbs from Ghana: Thonningia Sanguine on Experimentally-Induced Liver Injuries,” General Pharmacology: The Vascular System, Vol. 32, No. 6, 1999, pp. 661-667. doi:10.1016/S0306-3623(98)00238-9
- S. Kallithraka, A. A.-A. Mohdaly, D. P. Makris and P. Kefalas, “Determination of Major Anthocyanin Pigments in Hellenic native Grape Varieties (Vitis vinifera sp.): Association with Antiradical Activity,” Journal of Food Composition and Analysis, Vol. 18, No. 5, 2005, pp. 375- 386. doi:10.1016/j.jfca.2004.02.010
- F. Bonilla, M. Mayen, J. Merida and M. Medina, “Extraction of Phenolic Compounds from Red Grape Marc for Use as Food Lipid Antioxidants,” Food Chemistry, Vol. 66, No. 2, 1999, pp. 209-215. doi:10.1016/S0308-8146(99)00046-1
- R. H. Myers and D. C. Montgomery, “Response Surface Methodology: Process and Product Optimization Using Designed Experiments,” 2nd Edition, Wiley, New York, 2002.
- M. Rubilar, M. Pinelo, D. Franco, J. Sineiro and M. J. Núñez, “Agroindustrial Residues as a Source of Antioxidants. Residuos Agroindustriales Como Fuente de Antioxidantes,” Afinidad, Vol. 60, No. 504, 2003, pp. 153- 160.
- Y. Xing and P. J. White, “Identification and Function of Antioxidants from Oat Groats and Hulls,” Journal of the American Oil Chemists’ Society, Vol. 74, No. 3, 1997, pp. 303-307. doi:10.1007/s11746-997-0141-x
- K. Robards, M. Antolovich, P. Prenzler and D. Ryan, “Sample Preparation in the Determination of Phenolic Compounds in Fruits,” Analyst, Vol. 125, No. 5, 2000, pp. 989- 1009. doi:10.1039/b000080i
- A. Escarpa and M. C. Gonzáles, “Approach to the Content of Total Extractable Phenolic Compounds from Different Food Samples by Comparison of Chromatographic and Spectrophotometric Methods,” Analytica Chimica Acta, Vol. 427, No. 1, 2001, pp. 119-127. doi:10.1016/S0003-2670(00)01188-0
- M. Pinelo, M. Rubilar, M. Jerez, J. Sineiro and M. J. Nez, “Effect of Solvent, Temperature, and Solvent-to-Solid Ratio on the Total Phenolic Content and Antiradical Activity of Extracts from Different Components of Grape Pomace,” Journal of Agriculture and Food Chemistry, Vol. 53, No. 6, 2005. pp. 2111-2117. doi:10.1021/jf0488110
- B. Lapornik, M. Prošek and A. G. Wondra, “Comparison of Extracts Prepared from Plant By-products Using Different Solvents and Extraction Time,” Journal of Food Engineering, Vol. 71, No. 2, 2005, pp. 214-222. doi:10.1016/j.jfoodeng.2004.10.036
- N. El Darra, J. Tannous, P. BouMouncef, J. Palge, J. Yaghi, E. Vorobiev, N. Louka and R. G. Maroun, “A Comparative Study on Antiradical and Antimicrobial Properties of Red Grapes Extracts Obtained from Different Vitis vinifera Varieties,” Food and Nutrition Sciences, Vol. 3, No. 10, 2012, pp. 1420-1432. doi:10.4236/fns.2012.310186
- R. S. Jackson, “Wine Sciences,” Academic Press, New York, 1994. doi:10.1016/S0260-8774(02)00497-1
- J. E. Cacace and G. Mazza, “Mass Transfer Process During Extraction of Phenolic Compounds from Milled Berries,” Journal of Food Engineering, Vol. 59, No. 4, 2003, pp. 379-389.
- H. G. Schwartzberg and R. Y. Chao, “Solute Diffusivities in Leaching Processes,” Food Technology, Vol. 36, No. 2, 1982, pp. 73-86.
- M. Wettasinghe and F. Shahidi, “Evening Primrose Meal: A Source of Natural Antioxidants and Scavenger of Hydrogen Peroxide and Oxygen-Derived Free Radicals,” Journal of Agriculture and Food Chemistry, Vol. 47, No. 5, 1999, pp. 1801-1812. doi:10.1021/jf9810416
- D. C. Montgomery, “Design and Analysis of Experiments,” 5th Edition, Wiley, New York, 2001.
- B. E. Richter, “Extraction of Hydrocarbon Contamination from Soils Using Accelerated Solvent Extraction,” Journal of Chromatography A, Vol. 874, No. 2, 2000, pp. 217-224.
- L. Ramos, E. M. Kristenson and U. A. T. Brinkman, “Current Use of Pressurised Liquid Extraction and Subcritical Water Extraction in Environmental Analysis,” Journal of Chromatography A, Vol. 975, No. 1, 2002, pp. 3-29. doi:10.1016/S0021-9673(02)01336-5
- K. Zhou and L. Yu, “Effects of Extraction Solvent on Wheat Bran Antioxidant Activity Estimation,” LWTFood Science and Technology, Vol. 37, No. 7, 2004, pp. 717-721. doi:10.1016/j.lwt.2004.02.008
- Q. Liu and H. Yao, “Antioxidant Activities of Barley Seeds Extracts,” Food Chemistry, Vol. 102, No. 3, 2007, pp.732-737. doi:10.1016/j.foodchem.2006.06.051
- E. Revilla, J. M. Ryan and G. Martin-Ortega, “Comparison of Several Procedures Used for the Extraction of Anthocyanins from Red Grapes,” Journal of Agriculture and Food Chemistry, Vol. 46, No. 11, 1998, pp. 4592-4597. doi:10.1021/jf9804692
- Z. Y. Ju and L. R. Howard, “Effects of Solvent and Temperature on Pressurized Liquid Extraction of Anthocyanins and Total Phenolics from Dried Red Grape Skin,” Journal of Agriculture and Food Chemistry, Vol. 51, No. 18, 2003, pp. 5207-5213. doi:10.1021/jf0302106
- R. P. Metivier, F. J. Francis and F. M. Clydesdale, “Solvent Extraction of Anthocyanins from Wine Pomace,” Journal of Food Science, Vol. 45, No. 4, 2006, pp. 1099- 1100. doi:10.1111/j.1365-2621.1980.tb07534.x
- Y. El Hajj, N. Louka, C. Nguyen and R. G. Maroun, “Low Cost Process for Phenolic Compounds Extraction from Cabernet Sauvignon Grapes (Vitis vinifera L. cv. Cabernet Sauvignon). Optimization by Response Surface Methodology,” Food and Nutrition Sciences, Vol. 3, No. 1, 2012, pp. 89-103. doi:10.4236/fns.2012.31014
- L. Gao and G. Mazza, “Extraction of Anthocyanin Pigments from Purple Sunflower Hulls,” Journal of Food Science, Vol. 61, No. 3, 1996, pp. 600-603. doi:10.1111/j.1365-2621.1996.tb13167.x
- F. F. Liu, C. Y. W. Ang and D. Springer, “Optimization of Extraction Conditions for Active Components in Hypericum perforatum Using Response Surface Methodology,” Journal of Agriculture and Food Chemistry, Vol. 48, No. 8, 2000, pp. 3364-3371. doi:10.1021/jf991086m
- N. Turker and F. Erdogdu, “ Effects of pH and Temperature of Extraction Medium on Effective Diffusion Coefficient of Anthocyanin Pigments of Black Carrot (Daucuscarota var. L.),” Journal of Food Engineering, Vol. 76, No. 4, 2006, pp. 579-583. doi:10.1016/j.jfoodeng.2005.06.005
- T. Vatai, M. Škerget and Z. Knez, “Extraction of Phenolic Compounds from Elder Berry and Different Grape Marc Varieties Using Organic Solvents and/or Supercritical Carbon Dioxide,” Journal of Food Engineering, Vol. 90, No. 2, 2009, pp. 246-254. doi:10.1016/j.jfoodeng.2008.06.028
NOTES
*Corresponding author.