Food and Nutrition Sciences
Vol. 4 No. 9 (2013) , Article ID: 36062 , 9 pages DOI:10.4236/fns.2013.49120
Impact of Pesticides Contamination on Nutritional Values of Marinefishery from Karachi Coast of Arabian Sea
![]()
1Center for Environmental Studies, Pakistan Council of Scientific and Industrial Research, Karachi, Pakistan; 2Department of Pharmacology, Bahria University Medical & Dental College, Karachi, Pakistan; 3Department of Community Health Sciences, Hamdard College of Medicine& Dentistry (HCMD), Hamdard University, Karachi, Pakistan.
Email: dr_ssan@yahoo.com, nsm_Karim@yahoo.com, *aliamunshi@gmail.com, kmystry@hotmail.com, sohailshaukat786@yahoo.com
Copyright © 2013 Hina Ahsan et al. This is an open access article distributed under the Creative Commons Attribution License, which permits unrestricted use, distribution, and reproduction in any medium, provided the original work is properly cited.
Received January 13th, 2013; revised February 13th, 2013; accepted February 20th, 2013
Keywords: Organochlorines; Contamination; Lipids; Fishes; GC and GC-MS; Nutritional Values
ABSTRACT
The present study explores the chemical and economic aspects of pesticide contamination of marinefishery in relation to nutritional values Marine Pollution of pesticides poses signify can tricks to the environment and non-target organisms ranging from beneficial marine micro organisms, to insects, seaweeds, fish, and mangroves at Karachi Coast. Fish typically contains good quality nutrition, particularly oily fish has maximum commercial values but contamination of fishery is the major problem caused by pesticides and PCBs pollution resulting in serious health hazards. A number of fish and shell fish samples were analyzed for determination of pesticides contamination due to marine environment pollution. It was found that most pesticides pose risk to humans, fishery or the environment because they are designed to kill or adversely affect living organisms. Quantitative analysis of pesticides and PCBs was performed using GC equipped with ECD and the FPD for organophosphorus and GC-MS. The arithmetic mean concentrations of each pesticide were calculated and statistical evaluation was done. Relationship of protein and pesticides level has been determined to determine impact of pesticide on protein content of each type of fish. There is a considerable difference found in the pesticides contents of each type of fishery, which reveals that environmental pollution status that attributes towards pesticides distribution.
1. Introduction
Fish being a best nutritional source is a component of a balanced diet that is a vital part of a healthy lifestyle. Sea is one of the precious gifts awarded by nature for the human beings. It is full of each and every type wealth but unfortunately man has exploited sea for the sake of development and for the sake of more luxuries livings. Sea has always been a great source of multifunctional natural benefits. It provides a habitat for marine flora and fauna, as well as a means of commerce and dump. Fish is a very nutritious protein source from sea that is low in saturated fat, providing essential fatty acids, antioxidants and vitamins. It is far healthier than many alternative foods. As the Oceanic environment is subject to an ever increasing range of man-made (anthropogenic or xenobiotic) pollutants, reflecting the evermore rapid innovations of our technology to manufacture goods to satisfy a perceived increase in consumer demand on which our economy is based. Whether such release was into the atmosphere, onto land or into the rivers, it all eventually comes to rest in the aquatic ecosystem. Fish has high nutritional values (Table 1). Fish provides a good source of quality protein, essential for body building and repair of tissues. Our bodies are not equipped to store protein, therefore, consuming fish daily helps you fulfill your daily requirement. Fish is a good source of unsaturated fats containing Omega-3 and Oily fishes like mackerel, sardines, herring and sprats are rich in Omega-3. Fish is a great staple of a lowfat diet due to containing high content of unsaturated fat. The majority of fish contain low levels of saturated fats.
Beneficial health effects of unsaturated fat are well demonstrated and include the prevention of a number of diseases, such as coronary heart diseases, inflammation, hypotrigly ceridemic effect, allergies, hypertension, arthritis, autoimmune disorders, and cancer [1]. Like all other marine fauna Fishes are also constantly exposed to chemicals in polluted waters and found to be as a good
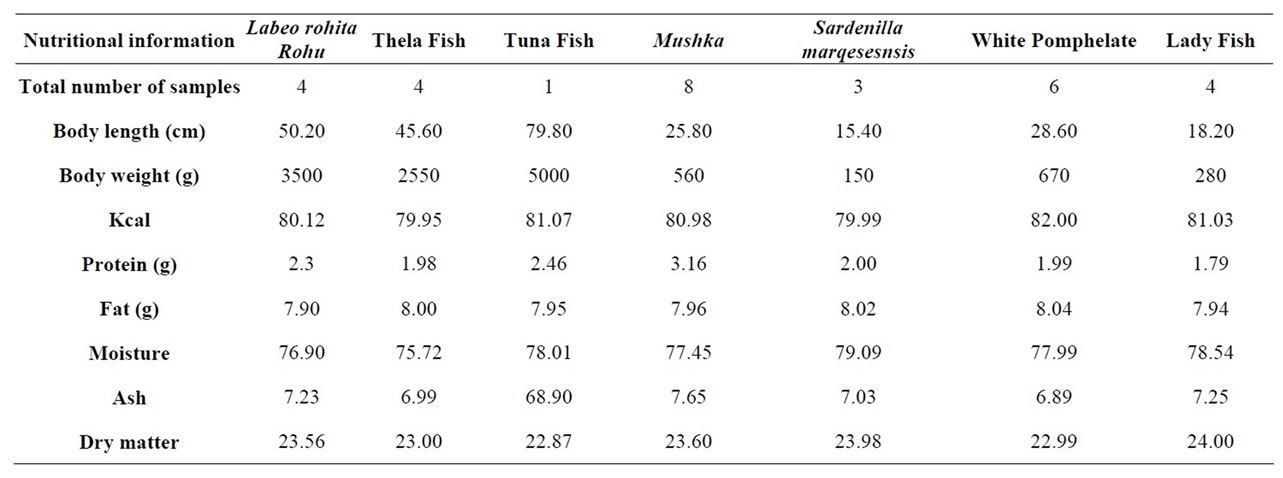
Table 1. Seafood nutritional information (g/100g, dry weight basis).
indicator of marine pollution [2]. Application of chemical pesticides and fertilizers for the management of plant growth and disease is backbone of modern agriculture and it has introduced a revolution in the industrial and agricultural sector from the second half of the past century. Fish exposed to pesticides in four primary ways [3] dermal, direct absorption through the skin by swimming in pesticide-contaminated waters [4], breathing, by direct uptake of pesticides through the gills during respiration, orally, by drinking pesticide contaminated water and feeding on dead insects which poisoned by insecticides or contaminated prey [5].
Pakistan has very well developed agricultural community. In the past, large quantities of POPs and other insecticides, fungicides, and herbicides have been used in Pakistan to maximize crop production in agricultural settings and have also been used for pest and weed control in urban settings. Local manufacturing of pesticides in the country is limited to aluminium phosphide, copper oxychloride and zinc phosphide and has increased from 14% in 1984 to about 70% in 2004 of the total needed supply. In Pakistan, herbicides are mostly used that caused contamination in fish muscles.
This class of pesticides is characterized by persistence in the environment and the tendency to accumulate in aquatic organisms. Residues and metabolites of many OC arevery stable with long half lives in the environment [4]. SP pesticides are a class of lipophilic insecticide very easily degraded in the natural environment, sensitive to sunlight with relatively low toxicity as compared with OC [6]. The pesticides applied on land eventually find their way to the aquatic environment, thus contamination occurred and subsequently get accumulated in fish [7].
The main objectives of the present study was to evaluate the approximate chemical composition of fish muscles including moisture, crude protein, fat, ash contents carbohydrates etc. and determination of the presence of pesticide residues.
2. Materials and Methods
2.1. Sampling
Fish samples were collected from different locations and also purchased from fish harbor at Karachi and then individually placed into numbered clean polyethylene bags. The mean weight and length of fish are given in Table 1.
2.2. Chemical and Reagents
All the reagents and solvents used were of GC grade supplied by Merck (Darmstadt, Germany). The 12 pesticide reference standards consisted of hexachlorobenzene, lindane, heptachlor, aldrin, dieldrin, endrin, alfa-endosulfan, beta-endosulfan, dicofol, p,p-DDT, p,p-DDD, p,p-DDE, linadane and Polychlorinated biphenyl PCBs- 18, 28, 52, 101, 118, 153, 180, 194 and PCB-209 of all near-100% purity were obtained from Dr. Ehrenstorfer GmbH (Augsburg, Germany). Individual Stock solutions of 1 mg/ml and working solutions containing the 11 pesticides and 9 PCBs at 750 and 7500 μg/L for the 2 fortification levels were prepared in 85:15 (v:v) acetone: isooctane.
For validation experiments, Mushka fish was purchased from fish harbor and analyzed to ensure that it was negative for target analyses. All organic solvents used in the study were pesticide or HPLC grade. High purity anhydrous sodium sulphate, alumina and silica gel were obtained from Merck. The alumina oxide and silica gel were activated at 250˚C and 120˚C respectively for 4 hrs.
2.3. Apparatus
Samples were analyzed using Gas Chromatograph (Perkin Elmer, Clarus-500). Other equipments used in the study included Brawn chopper to comminute fish samples; mortar pistols, soxhlet apparatus, a Digisystem vortex mixer, heating mantle, rotary evaporator, 20/20 glass columns and Round bottom and flat bottom flasks.
Preliminary Steps
Fortification experiment was done on Mushka Fish purchased from a local market, brought to the lab and length, width, and weight were recorded. Fish skin was removed and then bones and muscles tissues/meat were separated. This whole muscle tissue of the fish was homogenized in a high speed chopper until a paste like consistency was formed. Fish homogenate was divided into 200 g portions and stored in a deep freezer at −18˚C till the analysis (Table 1).
For screening, fish/shell fish samples were collected from different locations (deep sea/shallow waters/markets) by boats/trawlers/nets with the help of expert fishermen. These samples were given separate identification number, their length; width and weight were recorded then were wrapped in aluminum foil and sealed in ziplock bags. All fish samples were kept in ice box until return from the field and were frozen to −18˚C until processed. Fish skin and bones were removed and muscle tissues from each fish were taken for further analysis.
2.4. Extraction Procedure
Method was adopted from [8-10] are followed after some modification. For validation experiment aliquots (15 g) of previously homogenized sample of Tuna fish were weighed and transferred in mortar. The samples were fortified with appropriate pesticides-PCBs mixture solution (200 μL) to yield 10 and 100 μg/kg concentrations. 6 replicates at each level (i.e. total 12 samples in one study) were tested in two different occasions. The fortified samples were allowed to stand for 30 minutes for the components to interact with the matrix and some of the solvent to evaporate. Now anhydrous Na2SO4 was mixed with each sample and the mixture was ground until it achieved the consistency of a free flowing powder. The powder of each sample was transferred to filter paper thimble and extracted in a soxhlet apparatus using 300 mL of solvent (n-Hexane:Dichloromethane, 1:1) for 12 hrs. The extracts were then evaporated on rotary evaporator to 1 mL. This extract was then subjected to cleanup and isolation. Column was prepared using 2 g silica gel as lower layer and 4 g alumina as upper layer and column was prewashed with n-hexane.
Now soxhlet extracts (1 mL) of each sample were poured on to the column and column was eluted first with 10 mL n-Hexane for PCBs and then with 10 mL 15% diethylether inn-Hexane for pesticides. Eluate was collected in a same flask and then sample was concentrated under nitrogen stream till 1 mL. This was transferred to GC vials for GC analysis. Same experiments were performed with muscle tissue samples from each fish except the fortification step. And prior to injection d6-lindane was added in all vials as an internal standard.
2.5. GC-Analysis
The samples were analyzed by Perkin Elmer clarus-500 Gas Chromatograph, equipped with Elite-5 capillary column of 30 m, 0.25 mm i.d, and 0.25 μm film thickness. The GCECD was used in split less mode. Injector temperature was 270˚C. The ECD temperature was 375˚C with 60 mL/min combined flow of carrier and makeup gas. Nitrogen was used as make up gas and as a carrier gas with constant flow at a flow rate of 2 mL/min. Injection volume was 0.5 μL and the oven temperature was set at 70˚C for 2 min, ramped to 200˚C at 5˚C/min, and a 10˚C/min ramp to 280˚C held for 20 min. Quantification was performed using weighted-regression calibration curves. The standard solutions were prepared at 50, 100, 150, 200, 300, 400, 500 and 600 pg/μL concentrations for ECD. All results are reported on wet-weight basis.
For quantitation of pesticides in samples, a separate calibration curve was established for each organchlorines. Triplicate samples were used for setting calibration curve, determining LODs and extraction recovery.
2.6. Method Performance or Quality Control and Quality Assurance
Certified reference standards and deuterated internal standards were used to compensate for loses involved in sample extraction and work up. For each batch of samples; matrix blank, reagent blank and a recovery sample were also analyzed to monitor method performance and instrumental sensitivity. Recovery studies were conducted by spiking uncontaminated samples with pesticide standard solution. Three replicated fish samples were spiked with four concentration levels (0.1, 0.25, and 0.5 μg/kg) with Heptachlor, Dieldrin, chlorpyrifosand Dichlorvos. The fortified samples were extracted and analyzed using the entire procedure. The limits of detection (LOD) was estimated using the signal-to-noise ratio as S/N = 3 and S/N = 10, respectively.
3. Results and Discussion
The performances of the employed analytical method were satisfactory for the purpose. Analysis gave clean chromatograms and recoveries were considered as valid for analyzing residues of organochlorines. This study deals with the approximate composition of fish found at Karachi coast and commonly used pesticide residues in Pakistan including banned pesticides (Table 2). OCPs and PCBs load in fish samples collected from Karachi coast of Pakistan are shown in Figure 1.
3.1. Recoveries of Fortified EDCs
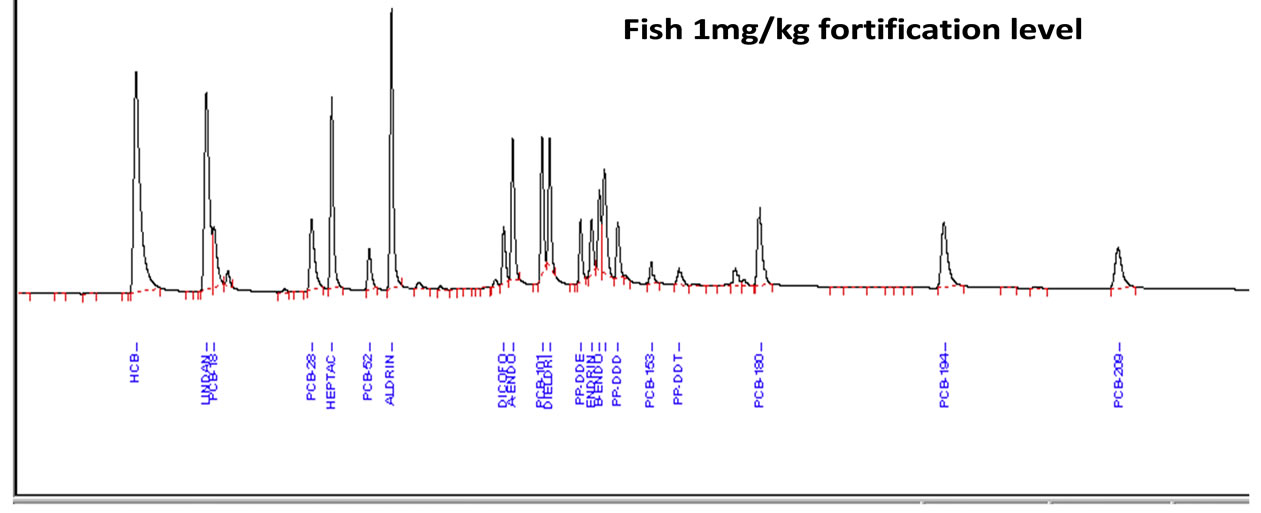
A mixture of 12 pesticides and 9 PCBs standards was spiked at two fortification levels (10 μg/kg and 100 μg/kg). Figure 2 shows the representative GC-ECD chromatograms of analysis of pesticide and PCBs standard mixture, fortified fish extract and extracts of highly contaminated fish samples.
All pesticides and PCBs recoveries fell within codex acceptable range 70% - 120% atboth fortification levels, except dicofol having recovery 67%. Overall recovery of the method was 79% with RSD of 11% (n = 363). Limit of detection (LOD) is calculated as three times the standard deviation of the absolute recoveries at the lowest spiking level, i.e. 10 μg/kg. Limit of detection of the method was 20.4 - 35.3 μg/kg using GC-ECD. Recoveries and LOD values for individual analyte are given in Table 3.

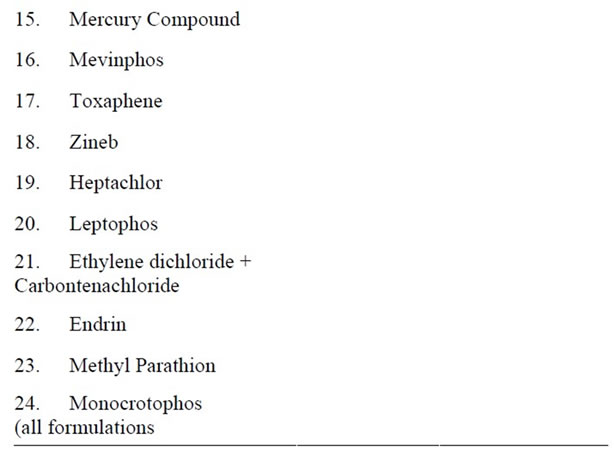
Table 2. List of pesticides banned in Pakistan.
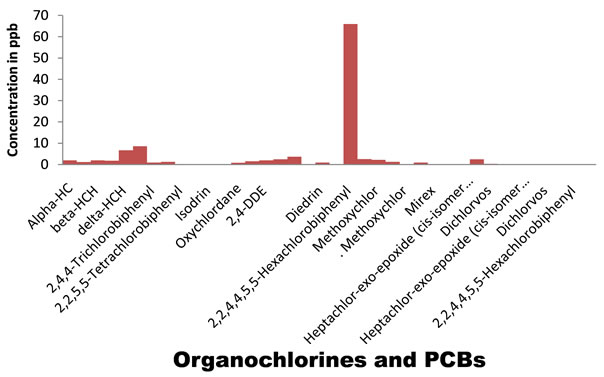
Figure 1. OCPs and PCBs load in fish samples from Karachi coast.
3.2. Approximate Chemical Composition
Approximate chemical composition as percentage of fish is demonstrated in Table 1. It could be observed from its analytical data that the sequence of the average values of moisture, ether extract, crude protein and ash con-tents are graded in reduction at considerable levels ranged from 79.09% to 75.72%, 8.04% to 7.20%, 80.49% to 77.86%, 7.28% to 5.72% and 1.98% to 2.92% respectively.
The average value of total dry matter was 23.13% in fish and seafood Nutritional Information on dry weight basis given as g/100g (Table 1).
These results were in agreement with those of [11] found that moisture content of some fresh water fish ranged from 70.00% to 79.00% and the Nile fishes had crude protein and ash contents at levels ranged from 15.20% to 21.50% and 1.38% to 1.62% as wet weight respectively [12], also stated that the ash content of fish were 4.73% and 1.05% basis as dry and wet weight respectively.
Mean concentrations of individual pesticides and PCBs and their ranges and percentage of contaminated at least ten samples are given in Table 4. According to the results Rahu fish was found most contaminated with a mean 0.013 μg/g for pesticides and PCBs altogether. The second fish was Tilapia fish was found contaminated a mean 0.020 μg/g for pesticides and PCBs collectively.
Mean value of pesticides and PCBs for Tuna was found Lower than reportable value (<LOR) however in Mushka fish samples it was found to be 0.010 μg/g for organochlorines pesticides and Polychlorinated biphenyls collectively.
Load of contaminants in Sardinella Marqesesnsis was found with a mean of 0.022 μg/g for pesticides and PCBs altogether. In white pomphelate and Lady fish these values were found to be 0.014 μg/g and 0.013 μg/g for pesticides and PCBs collectively. Among all analyzed compounds, at all samples lindane (gamma-HCH) is in high percentage as 58% of total OCPs concentration, Average
 (a)
(a)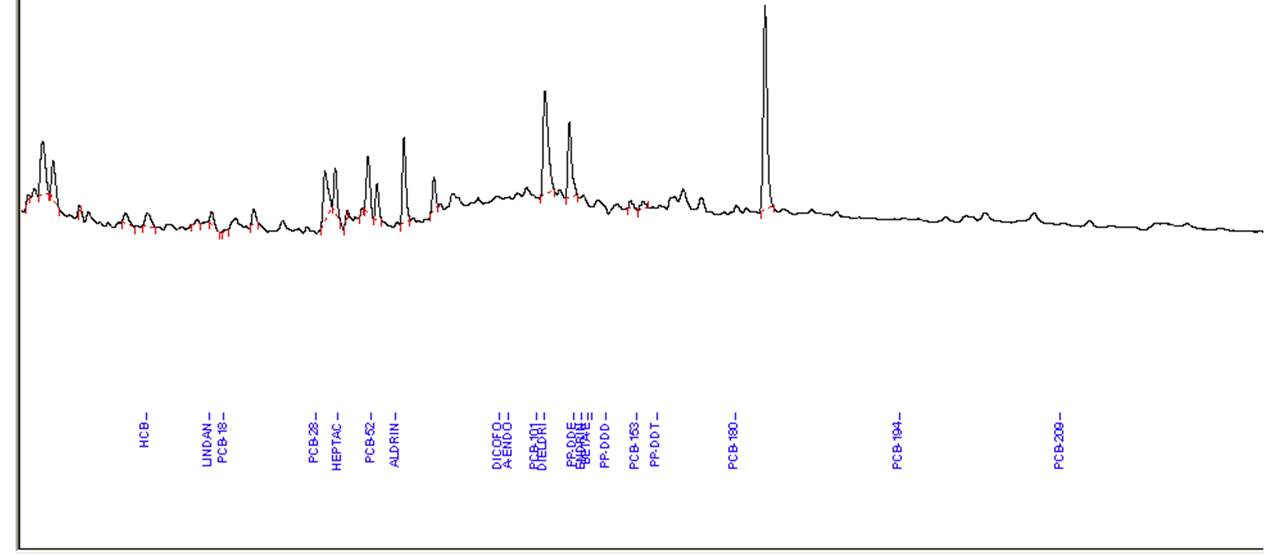 (b)
(b)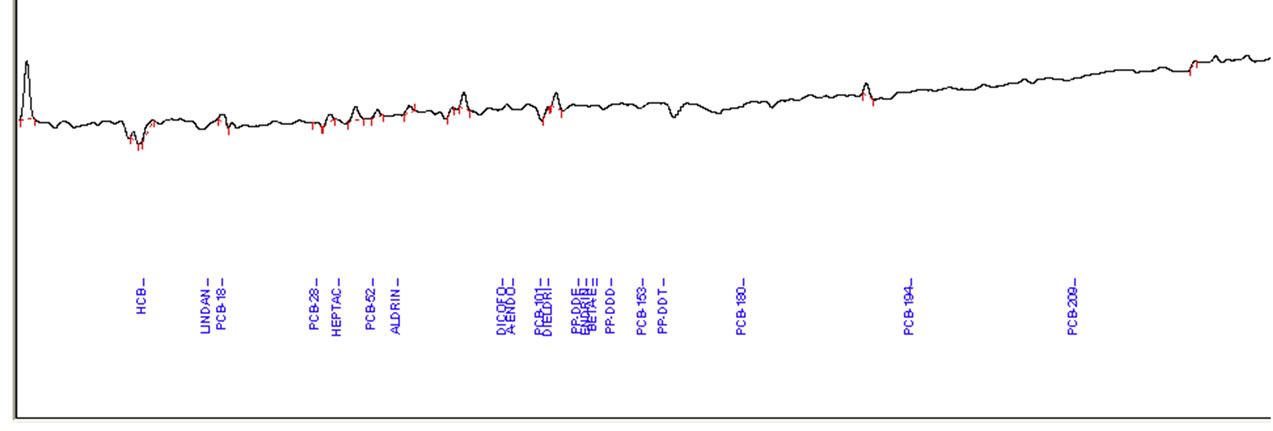 (c)
(c)
Figure 2. (a) Example of Elite-5 capillary gas chromatography (GC)-electron capture detector (ECD) chromatograms of pesticides standard, spiked in fish extract with highest concentration; (b) Level of OCPs and PCBs in fish extract; (c) Blank sample of fish.
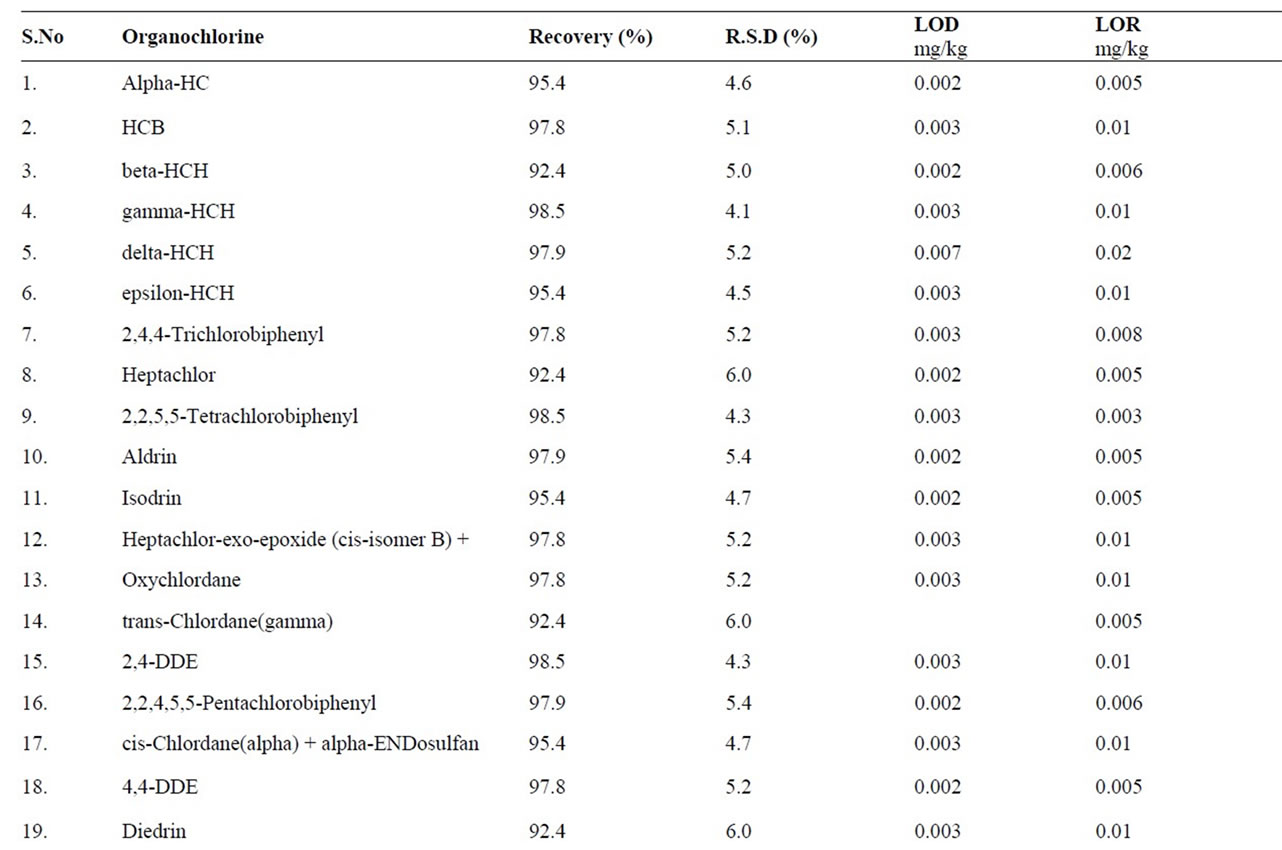
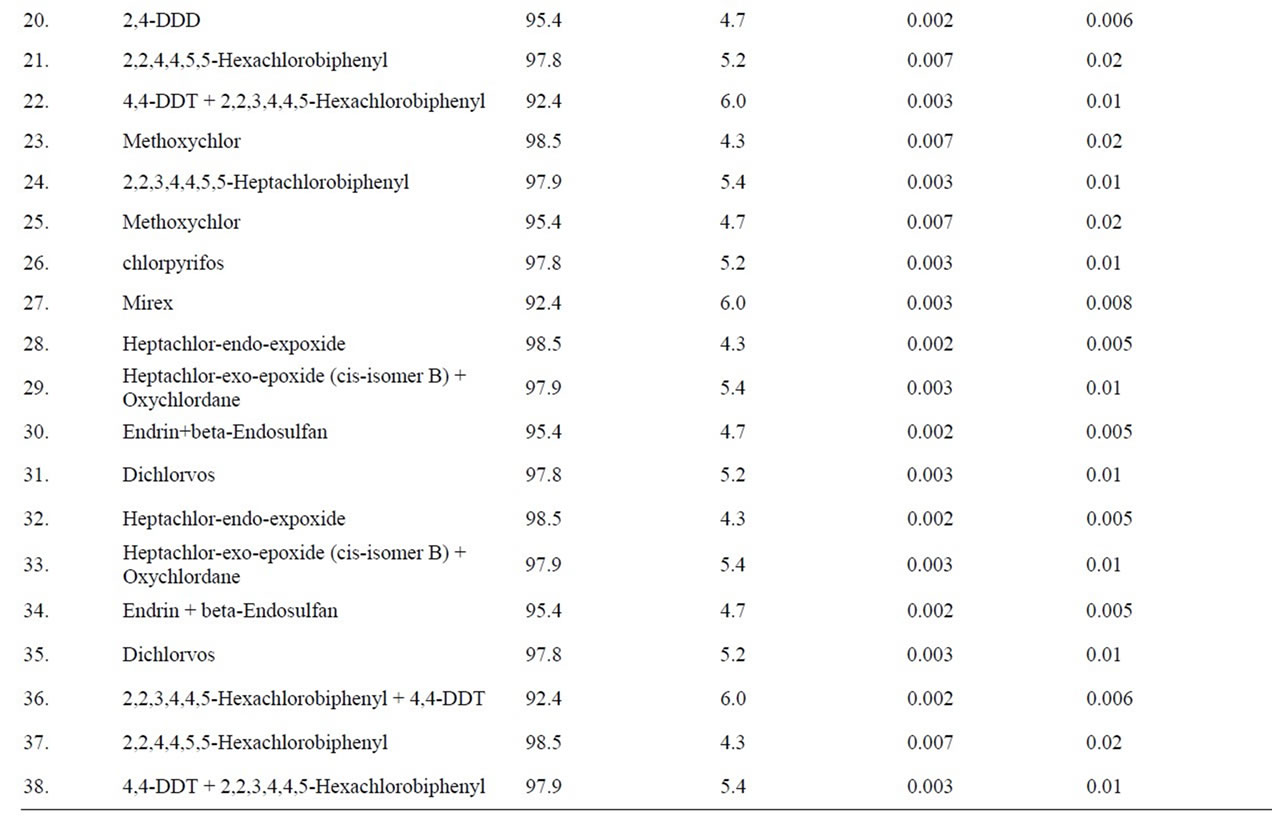
Table 3. Recovery of pesticides from fish samples.
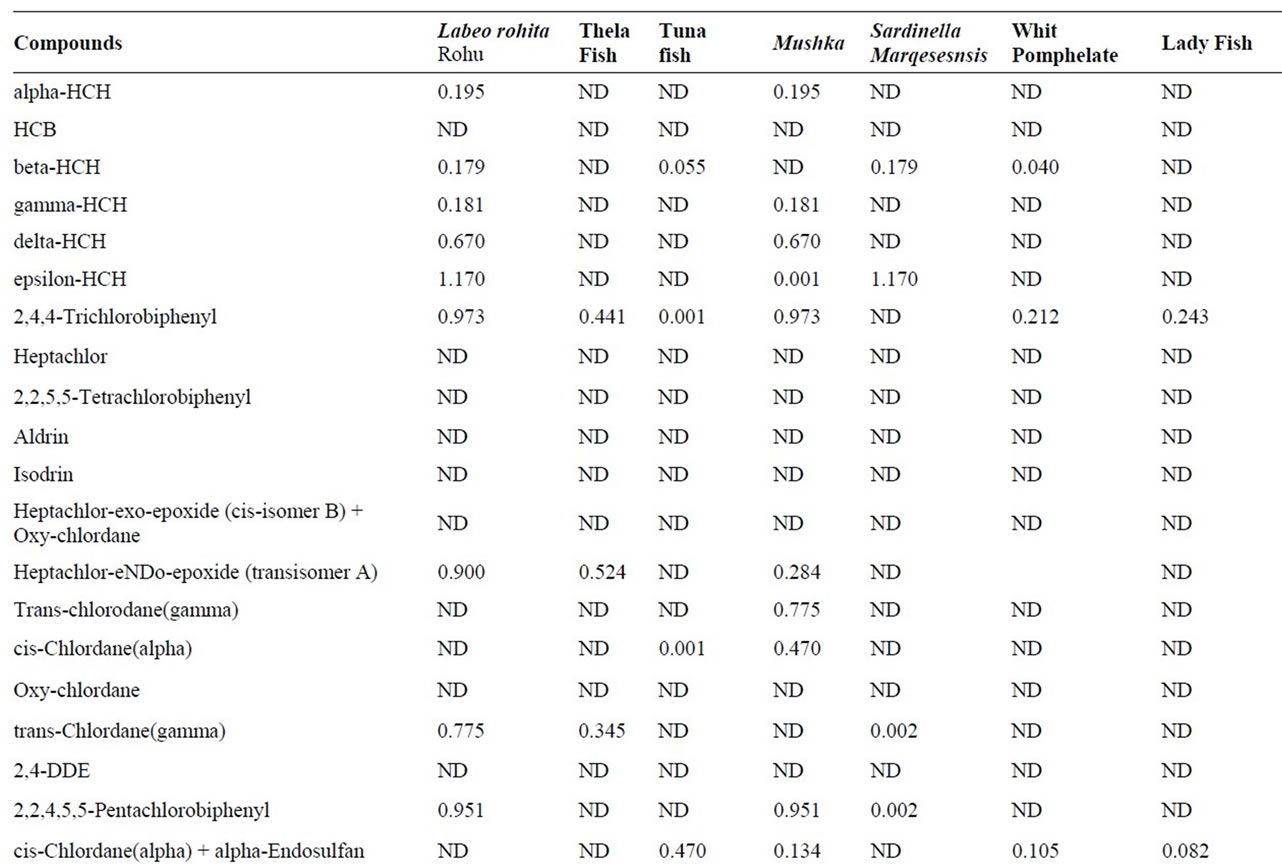
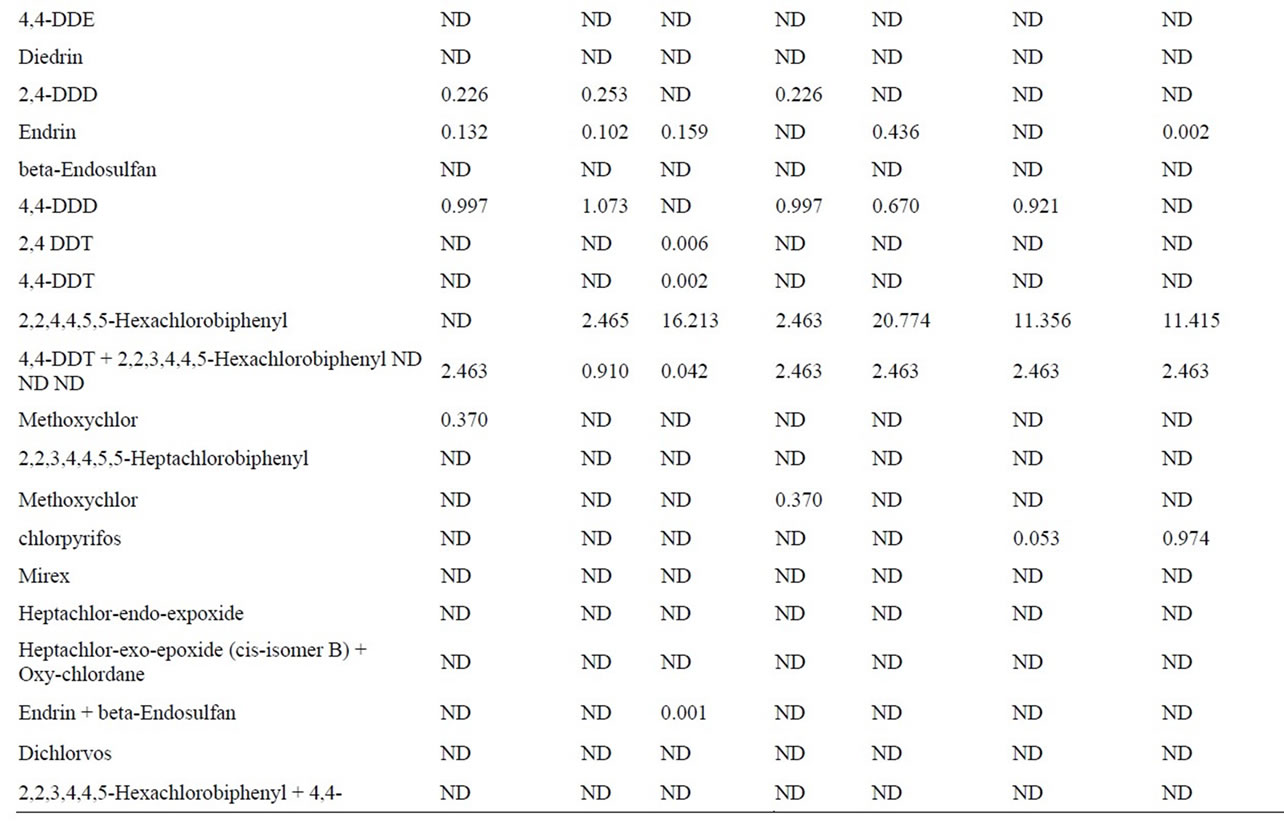
Table 4. Pesticides concentration (μg/g) in fish samples.
highest concentration of lindane was found in Rahu fish as 0.0036 μg/g and 0.0028 μg/g in Mushka. While alphaendosulfan was at least, as 13% of total OCPs concentration. Beta-endosulfan was not detected in any of the samples analyzed. OCs and PCBs are present in the fauna in the karachian marine environment but the concentration levels found in this study were below the extraneus residue limit (ERC) of 5 ppm (5000 ng/g) set by codex alimentarious commission of [13]. Form any pesticides, two types of guidelines apply to fish and shellfish tissue for human consumption; EPA fish tissue concentrations and EPA recommended screening values.
Pesticide residues in edible fish and shellfish tissue can be compared with FDA action levels or EPA tolerances. To evaluate potential adverse health effects due to consumption of pesticide contaminated fish or shellfish, it is appropriate to compare measured residues with EPA recommended screening values or EPA fish-tissue concentrations [14].
Although, none of the sample was found to be contaminated above the extraneous residue limit (ERC) and beyond the acceptable daily intake (ADI) for the respective pesticide, set by the FAO-WHO codex alimentary commission. But as suggested we have compared the fish contaminated data obtained from this study with the EPA’s screening criteria for recommended levels of fish consumption.
Then pesticides are again used during live stock production and Non-agricultural use of pesticides covers many areas. Local authorities use a great variety of pesticides in their farms, gardens, lawns, golf courses and similar recreation areas. These days, pesticides are sprayed in residential areas too for mosquito control. Some herbicides and chemicals are applied around canals and various water ways to remove excessive weeds. Most of the shopkeepers catch fish from these streams too and sell in the market. Pesticides are also used in wooden Furniture, wall paper pastes, and carpets and in some shampoos thus shown adverse use of pesticides along with pesticides contamination through dumping waste into the sea.
4. Conclusions
The results from this study do not appear to be very alarming; these levels of pesticides (trace and ultra trace) are still low to the amounts reported from other parts of the world especially for PCBs [15].
The fish basis on dry weight, showed significant decrease in its nutritive value for fat, crude protein and ash but showed fairly increase in the total solids and carbohydrates. As the fats decreased it reduce toxic chemicals that have accumulated in fatty tissue. None of residues of OCPs or PCBs pesticides in fish muscles exceed the permissible limits set by the FAO. If the hazards are as great as some research indicates, delaying control and elimination of pesticides means condemning future generation of wildlife and people to irreversible harm. The Government should greatly increase investment in research in non chemical pest in agriculture and greatly introduce organic farming at local. Prevention and education for source control is the first step.
REFERENCES
- F. Sahena, I. S. M. Zaidul, S. Jinap, A. M. Yazid, A. Khatib and N. A. N. Norulaini, “Fatty Acid Compositions of Fish Oil Extracted from Different Parts of Indianmackerel (Rastrelliger kanagurta) Using Various Techniques of Super-Critical CO2 Extraction,” Food Chemistry, Vol. 120, No. 3, 2010, pp. 879-885. doi:10.1016/j.foodchem.2009.10.055
- M. Tuzen and M. Soylak, “Determination of Trace Metals in Canned Fish Marketed in Turkey,” Food Chemistry, Vol. 101, No. 4, 2007, pp. 1378-1382. doi:10.1016/j.foodchem.2006.03.044
- M. M. Storelli, G. Barone and G. O. Marcotrigiano, “Residues of Polychlorinated Biphenyls in Edible Fish of the Adriatic Sea: Assessment of Human Exposure,” Journal of Food Science, Vol. 72, No. 4, 2007, pp. 183-187. doi:10.1111/j.1750-3841.2007.00348.x
- UNEP, “United Nations Environment Program Chemicals. Indian Ocean Regional Report,” Industry and Economics Division, 2002, pp. 15-67.
- A. H. Louis, D. L. Weigmann, P. Hipkins and E. R. Stinson, “Pesticides and Aquatic Animals: A Guide to Reducing Impacts on Aquatic Systems,” Virginia State University, 2009, pp. 1-24.
- J.-P. Demoute, “A Brief Review of the Environmental Fate and Metabolism of Pyrethroids,” Pesticide Science, Vol. 27, No. 4, 2006, pp. 375-385. doi:10.1002/ps.2780270406
- M. Kaur, J. K. Sharma, J. P. Gill, R. S. I. Aulakh, J. S. Bedi and B. S. Joia, “Determination of Organochlorine Pesticide Residues in Freshwater Fish Species in Punjab, India,” Bulletin of Environmental Contamination and Toxicology, Vol. 80, No. 2, 2008, pp. 154-157. doi:10.1007/s00128-007-9335-z
- M. Bloxham, A. Rowe, E. Mcgovern, M. Smyth and E. Nixon, “Heavy Metal and Organochlorinein Fin-Fish and Shellfish from Irish Waters, 1996, Marine Environmental Series 2/198,” Marine Institute, Fisheries Research Centre, Abbotstown, 1998.
- D. L. Poster, M. J. Lopez de Aldade, M. M. Schantz, L. C. Sander, M. G. Vangel and S. A. Wise, “Development and Analysis of Three Diesel Particulate-Related Standard Reference Materials for the Determination of Chemical, Physical, and Biological Characteristics,” Polycyclic Aromatic Compounds, Vol. 23, No. 2, 2003, pp. 141-191. doi:10.1080/10406630308056
- D C. G. Muir, S. M. Backus, A. E. Derocher, R. Dietz, T. Evans, G. W. Gabrielsen, J. Nagy, R. J. Norstrom, C. Sonne, I. Stirling, M. K. Taylor and R. J. Letcher, “Brominated Flame Retardants in Polarbears (Ursusaritimus) from Alaska, the Canadian Arctic, Reenland, and Svalbard,” Environmental Science and Technology, Vol. 40, No. 2, 2006, pp. 449-455. doi:10.1021/es051707u
- Galhom GFAM, “Chemical and Technological Studies on Some Dried Fish Products,” M.Sc. Thesis, Faculty of Agriculture, Cairo University, Cairo, 2002.
- P. M. Darweish and N. M. Shams El-Din, “Chemical Composition and Storage Stability of Fish as Influenced by Cooking,” Smoking and Irradiation, 1993.
- “Evaluation of Certain Veterinary Drug Residues in Foods (48th Report of the Joint FAO/WHO Expert Committee on Food Additives),” WHO Technical Report Series No. 879, 1997.
- C. Botham, P. Holmes and P. Harrison, “Endocrine Disruption in Mammals, Birds, Reptiles and Amphibians,” In: R. M. Harrison and R. E. Hester, Eds., Endocrine Disrupting Chemicals, RSC Publishing, Cambridge, 1999.
- G. Lyons, “WWF-UK, Pesticides News. No. 46, December 16-19, 1999, FAO-WHO, Codex Maximum Residue Limits for Pesticides,” FAO, Rome, 1997.
NOTES
*Corresponding author.