Food and Nutrition Sciences
Vol. 2 No. 6 (2011) , Article ID: 6614 , 15 pages DOI:10.4236/fns.2011.26080
Social and Personal Determining Factors in the Results on Contents of Food Handlers’ Formation Plans
![]()
Food Science and Technology Department, Veterinary Faculty, University of Las Palmas de Gran Canaria, Spain.
Email: estebanpg@gmail.com
Received May 29th, 2011; revised June 28th, 2011; accepted July 6th, 2011.
Keywords: food handlers, social, personal, training, evaluation, HACCP
ABSTRACT
This study has two main objectives: on one hand, the evaluation of food items related to the food training courses in order to know which ones require better explanations from trainers and a further development and refinement by food handlers. It is also a goal of this work to appreciate the level of general knowledge of food handlers before receive any training session and then see if there was some improvement after the course. On the other hand, identifying potential social and personal factors of food handlers that influence on the results of the evaluation. To this end, two tests were performed (one before the training and at the end) and evaluated the results per modules. In general, knowledge levels both initially and after taking the course proved to be satisfactory. Personal and social factors determined better or worse scores on the basis of these.
1. Introduction
Food handlers’ training is of paramount importance. All people who work as food handlers must be informed and made aware of their role in protecting food from contamination and deterioration, before starting their duties.
According to the chapter XII, annex II of Regulation (EC) N˚ 852/2004, food business operators have to ensure that food handlers are supervised and instructed and/or trained in food hygiene matters commensurate with their work activity.
All persons employed in food-related operations that will have direct or indirect contact with food must be trained, and/or instruction at a level appropriate to the operations to be carried out.
Training is critical to any system of food hygiene. Training, and/or instruction and supervision, inadequate hygiene, any person involved in food-related operations represents a potential threat to the safety of food and its suitability for consumption [1].
At each step of the chain involving the foods there is direct human contact, either through manipulation or through contact caused by personal carelessness. Due to intense handling suffered by food products, we must combine quality assurance and control hygiene, to make possible the production of food with the standards of quality and identity expected.
Many causes of food contamination are from inadequate cleaning procedures and inappropriate behaviors of food handlers. The Good Manufacturing Practices are a set of rules that define the ideal forms of manufacture, from changes in cleaning methods, behavior the people involved, equipment and buildings, trying to eliminate the sources of generic possible contamination of a product [2].
Sustainability of safe food handling practices depends on the ability to link positive behavior, attitudes and continued education of food handlers.
While several authors have identified the relative importance of various food handling practices, a general consensus is that food handlers must attain high levels of food safety knowledge, as well as the ability to effecttively apply such knowledge in food handling practices; both attributes are essential to consistent safe food handling practices in restaurants [3,4]. An American study suggested that improper food handling practices contributed to approximately 97% of all food borne illnesses in food-service establishments and homes [5]. Previous studies on beliefs and self-reported practices of food handlers [6] indicated that while food handlers were aware of food safety behaviors, fully 63% of respondents admitted that they did not always carry out these behaviors. Food handlers also reported carrying out food safety practices, particularly washing hands with soap and water, much more frequently than they performed these practices [7].
The US Food and Drug Administration reported that the most common food handler behaviors contributing to food borne outbreaks include obtaining food from unsafe sources, using improper holding times and temperatures, inadequately cooking food, having poor personal hygiene, and contaminating equipment [8-11].
Food-safety training programs address the full range of food preparation behaviors in restaurants [8,12] and food contamination may occur at any point during its production, processing, distribution, and preparation [8,9,13]. The transmission of food borne pathogens through cross contamination by food handlers is directly a result of their knowledge of food-safety practices [11].
Food handlers have a major role in the prevention of food poisoning during food production and distribution. Food handlers may cross-contaminate raw and processed foodstuffs as well as inadequately cook and store foods. They can also be asymptomatic carriers of food poisoning organisms [14]. Food borne illness has been associated with improper storage or reheating (50%), food stored inappropriately (45%) and cross contamination (39%) [15] and a correlation between management attitude towards training, levels of food hygiene knowledge and standards of food handling practice has been identified [16,17].
HACCP (Hazard Analysis and Critical Control Points) implementation in a food business requires the recognition of hazards and their control. Therefore a major challenge in the food industry is to motivate food handlers to apply what they have learnt regarding food hygiene [18].
Because of all of these reasons, we have achieved a food handler assessment with the objective of evaluate the level of knowledge of food handlers in food hygiene, before and after a training course, which have informed in one hand about the effectiveness of the given training (and helping us in the verification point) and in the other hand, about the units of the training course which are susceptible of larger or better explanations to improve, knowing well that subsequent application of the acquired knowledge at work will not depend in a direct way of this fact, [18,19] shows, that it is not only the ignorance of food hygiene that causes food poisoning, but also the lack of applying the acquired knowledge. Also some studies have demonstrated a lack of correlation between food hygiene training and improvements in food hygiene behavior [5,20-21].
Rennie [22] argues that too little emphasis is placed on changing individuals’ beliefs and attitudes and that the model fails to take into account cultural, social and environmental influences.
In order to design effective training for food handlers there is a need to fully understand all the factors underlying current food hygiene behavior in the workplace. Some authors [22,23] describe how Social Cognition Models (SCMs) such as “The Theory of Planned Behavior” [24], “Tones Health Action Model” [25] and “The Health Belief Model” [26] could be used to understand food hygiene behavior.
Researchers have advocated using theories and models from the behavioral sciences to improve our understanding of food hygiene behavior [22,27]. Social cognitive theories such as the Theory of Reasoned Action (TRA) [28], the Theory of Planned Behavior (TPB) [24] and the Health Belief Model (HBM) [26] have provided a framework to investigate a wide range of behaviors [30] including food safety behavior in the home [30-32] and hand hygiene behavior in hospitals [33].
A study in Italy of 411 food handlers interviewed on a face-to-face basis determined that whilst they had a positive attitude towards food safety this was not supported by observed practices [34]. This confirmed that knowledge alone does not lead to changes in food handling practices.
But it doesn’t mean that Food hygiene training is not crucial in food safety and is an essential part of the hazard analysis critical control point (HACCP) concept [35].
2. Material and Methods
2.1. Sample Population
During the years 2007 and 2008, in the referral collective restoration center chosen for this study, we conducted a total of ten courses for obtaining a health card for food handlers. These courses were aimed at a population consisting of 193 items, older adults of Spanish nationality, permanent or temporary residents in the Canaria Autonomous Community.
2.2. Social and Personal Criteria for Classification
The population was classified according to social and personal criteria listed in Table 1, in the following groups:
Age: have considered four groups according to this criterion.
1) Younger than 20 years, formed by 61 persons (31.6%

Table 1. Classification of the population according to social and personal criteria.
of the population);
2) Age between 20 and 29, formed by 71 persons (36.8% of the population);
3) Age between 30 and 39, formed by 32 persons (16.6% of the population);
4) Age equal or superior to 40 years, formed by 29 persons (15.0% of the population).
Post: attending to the professional category and level of responsibility, with direct work or not in the food handling, were considered to be two groups.
1) Supervisors, persons in charge, managers or kitchen chiefs, formed by 27 persons (14.0% of the population). This group is constituted by those that realized a labor of coordination inside a workgroup and that in the main were not in the habit of manipulating the food. They named as persons in charge;
2) Rest of the population, coordinated by the previous group, which they could realize a particular labor, according to his category, in relation to the food handling. This group was integrated by 166 persons (86.0% of the total population). They were named like not persons in charge.
Center: attending to the food sector of the food chain in which one was developing or was going to develop the occupation, they were considered to be two groups.
1) Persons who were employed or were going to be employed inside at the sector of collective restoration (cooks, kitchen assistants, scullions, maîtres, waiters, personnel of cleanliness), formed by 116 persons (60.1 % of the population). It named to this group as collective restoration;
2) Group that was working or it would be employed at other links of the food chain, different from the collective restoration (butchers, makers of cheeses, fishmongers, warehousemen, distributors). Formed by 77 persons (39.9% of the population). It named to the above mentioned group as food chain.
Experience: having in it counts the experience in the food handling, they were considered to be the following groups.
1) Group with experience, constituted by 108 persons (56.0% of the population) who were working as food handlers;
2) Group without experience, formed by 85 persons (44.0% of the population) who were not devoting themselves still to the food handling.
Studies: according to the level of studies reached, other two groups were established.
1) With cultural standard equivalent or lower than the Secondary Obligatory Education (SOE), formed by 126 persons (65.3% of the population). It named up to SOE;
2) With cultural standard superior to the Secondary Obligatory Education, constituted by 67 persons (34.7% of the population). Was named a Superior SOE.
Profession: attending to the profession declared by every pupil they were considered to be two groups.
1) Professionals of the collective restoration, integrated by 52 persons (26.9% of the population), who like that indicated it in the corresponding paragraph of the tab (Table 2);
2) Other professions, group integrated by those persons that autoconsidered professionals of other sectors different from the collective restoration, formed by 141 persons (73.1% of the population).
2.3. Food Handler’s Tab
At the beginning of each course are provided attendees with a chip on the various items that they requested information based on personal and social criteria considered. The tab model is shown in Figure 1.
Food handlers’ training consisted in two exams, preliminary and final in order to assess the evolution of food-related knowledge and application of good handling practices. A total of ten training courses, in which, invariably, statements and content of exam questions were chosen in the following terms which are related.
2.4. Preliminary Exam
Made up of ten questions very basic test on the content type of the different units of work which were included

Figure 1. Tab model.
in the training course for food handlers. This test was carried out at the beginning of the first session of each course.
2.5. Final Exam
The review was based on Title III, Article 5 of R.D. 2505/1983 and according to paragraph IV, Article 14.2 of the Standard of food handlers in the Canary Islands. The questionnaire consisted of forty questions multiple choice single answer, on the course materials developed for and included in the chapters of the Handbook for Food Handlers, released by the Ministry of Health of the Canary Islands [36]. It created five teaching units whose contents are shown in Figure 2.
It was established as a threshold a 75% of correct answers to consider that training has been successful. This score has been considered in our study as a reference in different taxa.
Study on food handlers: valuation of the hygienicsanitary education.
2.6. Quantitative Variables
There has been described by means of the index of centralization arithmetic mean, which is accompanied always of an index of dispersion that is the standard deviation, represented in the text as X ± TD. And they have been considered to be the following ones:
1) Results obtained in the preliminary exam;
2) Results obtained in the final exam;
3) Results obtained in each of five units indexed previously (Figure 2).
The data analysis, from the statistical point of view, has been realized for the quantitative variables by means of the comparison of two averages across t of Student.
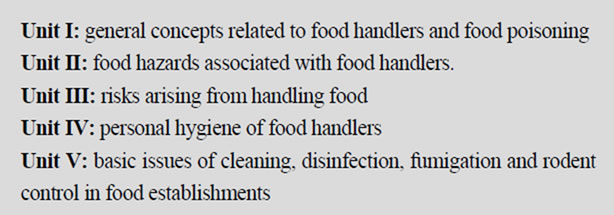
Figure 2. Teaching units of food handlers’ course.
When more than two averages are compared, the statistical used test has been the analysis of the variance (ANOVA). It thought that the test was statistically significant when the p-value was lower than 0.05.
2.7. Qualitative Variables
Have been created on having checked the information gathered in the database considering as characteristic to the cases of outstanding and not outstanding successes, which are:
1) In the preliminary exam:
9 or 10 correct answers: outstanding
Less than 9 correct answers: not outstanding;
2) In the final exam:
39 or 40 correct answers: outstanding
Less than 39 correct answers: not outstanding;
3) In each unit:
7 or 8 correct answers: outstanding
Less than 7 correct answers: not outstanding.
And there have been described by means of relative frequencies, that is to say, the number of cases that fulfill the characteristic, divided by the total number of studied cases.
For these variables, the statistical used test has been the test of Chi-square. In those cases in which the samples are very small (tables 2 × 2 with at least a theoretical cell with minor size to 5 cases) there has been in use Fisher’s exact test. It thought that the test was statisticcally significant when the p-value was lower than 0.05.
2.8. Statistical Analysis of Adjusted Data
To analyze the averages of the punctuations of the preliminary exam depending on the post and center was considered to be the model of analysis of the variance:
mij = q + (post)i + (center)j; i = 1,2; j = 1,2 (1)
where mij represents the previous average punctuation the i-th post (i = 1,2), and center j-th (j = 1,2). The parameters (post)i and (center)j represent the principal effects of the same ones in his levels i-th and j-th, respectively. In previous analyses of the variance were considered other factors that finally did not turn out to be significant and therefore they were not in use for the calculation of adjusted averages. We have supposed that the data Yijk observed in every group determined by post and center follow a law of normal probability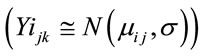 , being Yijk the previous corresponding punctuation to k-th subject, belonging to i-th post and j-th center. The model (1) was estimated by maximum verisimilitude, and there were obtained the adjusted averages for every group of post and every group of center. To confirm the existence of the considered effects there were in use the F-test fitted by other effects. From the esteeming ones of the parameters there decided the level of influence of every significant factor. To determine the degree of adjustment one considered to be the coefficient R square.
For the punctuation of the final exam a completely similar analysis fulfilled only that considering to be the model (2):
mij = q + (post)i + (studies)j; i = 1,2; j = 1,2 (2)
provided that these were the factors that were situated significant.
2.9. Statistical Analysis of Observed Data
For the analysis of the data used statistical packages SPSS/PC+, version 13.0 (SPSS Inc., Chicago) and SAS/ STAT, V.6.06.
3. Results and Discussion
3.1. Evaluation of Food Handlers
3.1.1. Overall Performance Evaluation
Table 2 shows the mean scores (X) obtained and the dispersion (TD), maximum and minimum scores in the preliminary examination, final exam for each teaching unit, and the percentage of outstanding.
3.1.2. Previous Knowledge (Preliminary Exam)
A maximum of 10, the mean score of 8.80 ± 0.91, results ranging between values of 5 and 10, and regarded as outstanding as criteria of paragraph (Material and Methods), 67.9%.
3.1.3. Final Knowledge (Final Exam)
After delivery of the course, the average value was obtained from a maximum of 40 points was 37.62 ± 2.29, very similar to those obtained by other correlated studies [37] reaching the score range between 29 and 40, reaching the percentage of outstanding 45.6%.
3.1.4. Performance of Educational Units
With the goal of a clear interpretation of the results of the final exam, and obtain information from the knowledge of individuals examined in the different aspects health and hygiene issues, then the scores reflect, according to the classification of educational units considered in Material and Methods.
UNIT I: general concepts related to food handlers and

Table 2. Overall assessment results.
food poisoning. Of a total of 8 points, the average score obtained was 7.24 ± 1.01, ranging between 4 and 8 hits. The highlights were considered by 79.1%.
UNIT II: food hazards associated with food handling. The average result obtained was 7.33 ± 1.03, a total of 8 points, ranging between 4 and 8 hits. 84.0% were regarded as outstanding.
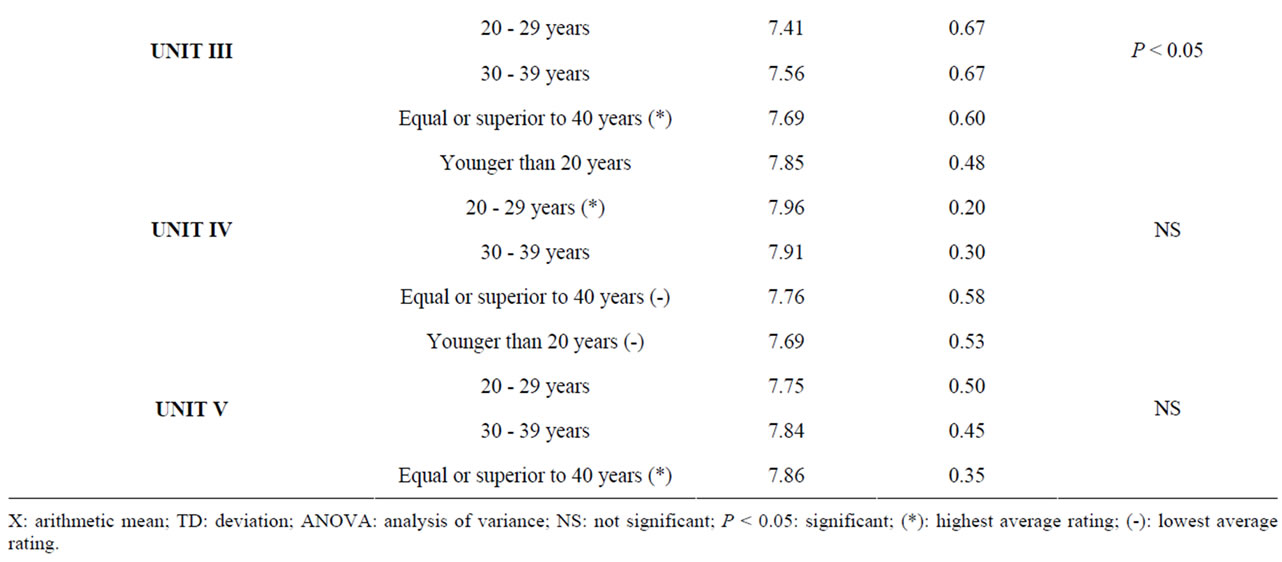
UNIT III: risks arising from handling food. A maximum of 8 points, got an average score of 7.41 ± 0.76, with variations between 4 and 8 hits. Those identified as outstanding were 88.9%.
UNIT IV: personal hygiene of food handlers. The average result obtained was 7.89 ± 0.39, a total of 8 points, successes ranging between 5 and 8 hits. 98.0% were considered outstanding.
UNIT V: basic Issues of cleaning, disinfection, fumigation and rodent control in food establishments.
A maximum of 8 points, the average score obtained was 7.76 ± 0.48, with a variation between 6 and 8 hits. Those identified as outstanding were 98%.
Previous knowledge (Preliminary Exam) (Table 3).
The best result was obtained by the group of age of 30 - 39 years, with an average qualification of 9.06 ± 0.50, being the group of age of less than 20 years the one that worse result obtained, 8.67 ± 1.09. No significant differences were found between the considered groups of different age.
Final knowledge (Final Exam) (Table 3).
Was it the group of age of 20 - 29 years the one that obtained the best average qualification, 37.97 ± 2.13, whereas the group of 40 or more years obtained the lowest, 36.97 ± 2.13. No significant differences were found.
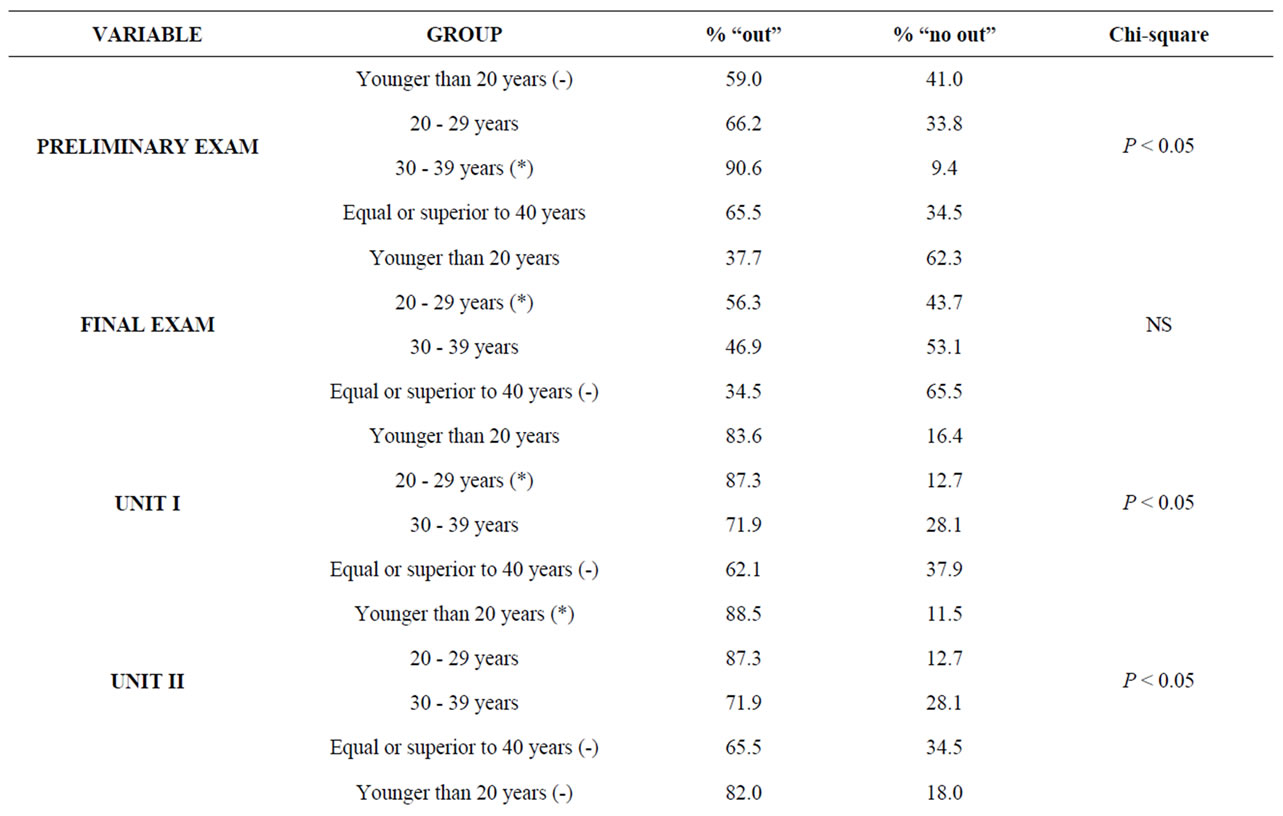
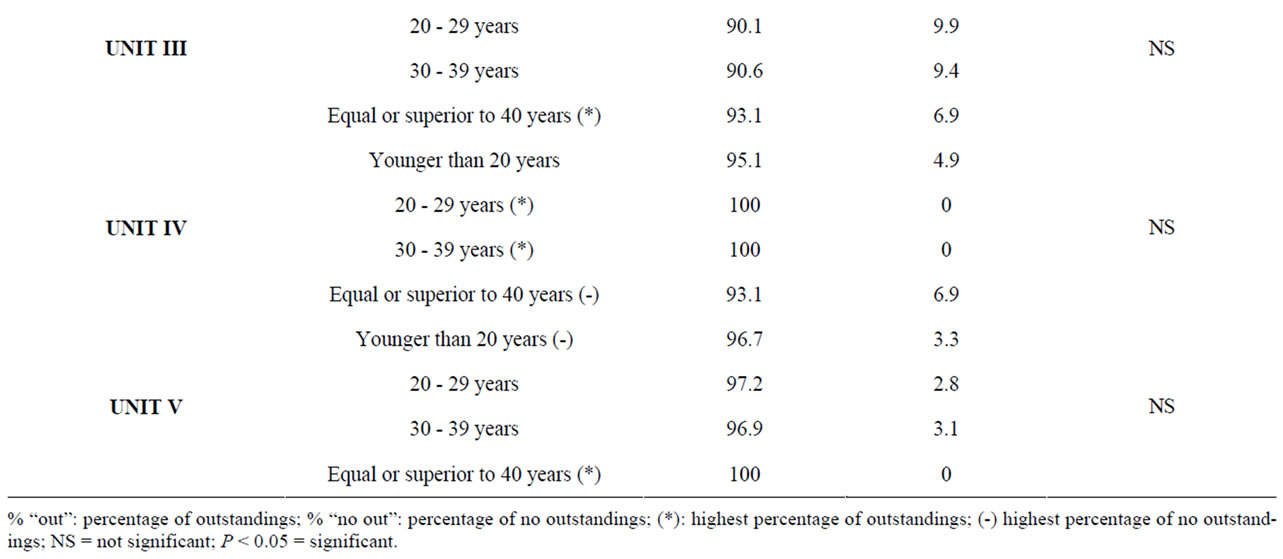
According to the Table 4, were observed significant differences (p < 0.05) in the results on previous knowledge (Preliminary Exam), standing out the group of age of 30 - 39 years (90.6% of outstandings), though they

were not for the final knowledge (Final Exam), where stood out the group of 20 - 29 years with 56.3% of outstandings.
Previous knowledge (Preliminary Exam) (Table 5).
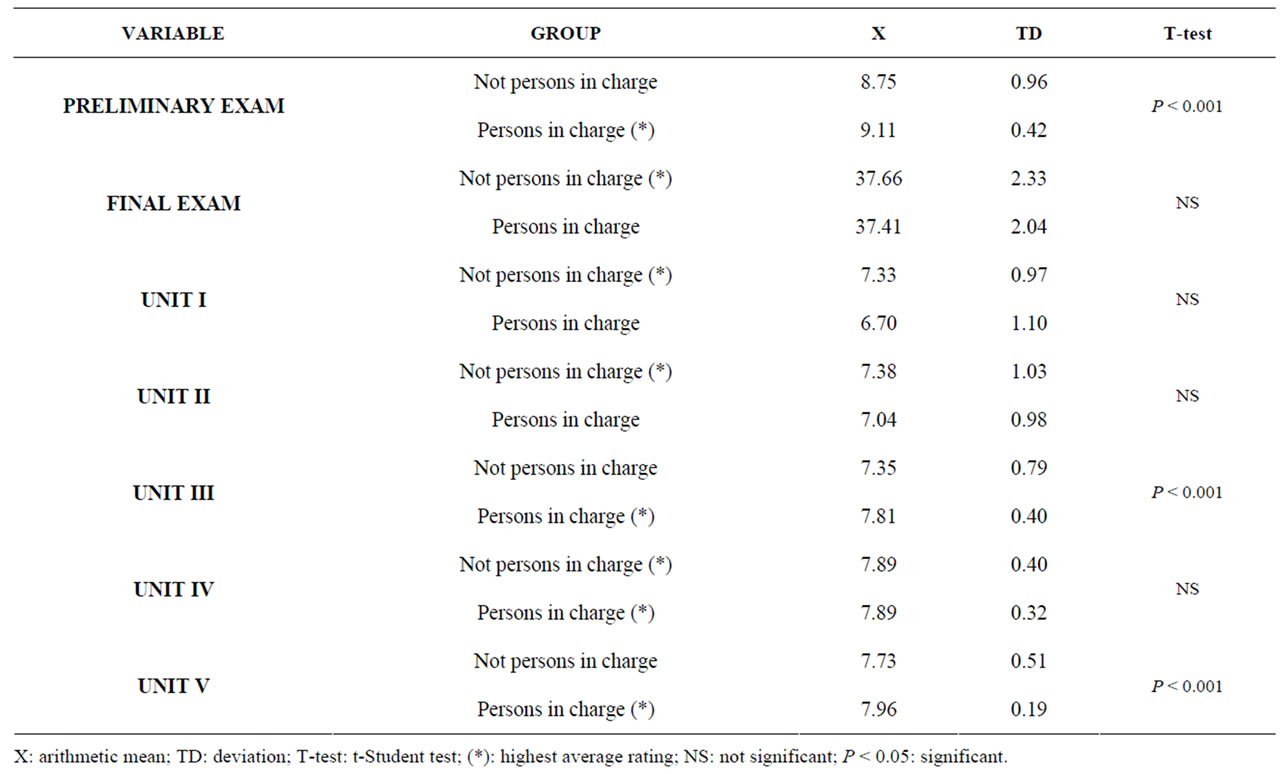
The best result was obtained by the group of persons in charge (supervisors, kitchen chiefs, managers), with an average qualification of 9.11 ± 0.42, obtaining the group of not persons in charge (rest of the population), an average qualification of 8.75 ± 0.96. Both groups were significantly different (p < 0,001).
Final knowledge (Final Exam) (Table 5).
It was the group of not persons in charge the one that obtained the best average qualification, 37.66 ± 2.33, whereas the group of persons in charge obtained the lowest, 37.41 ± 2.04. No significant differences were found.
According to the Table 6, were observed significant differences (p < 0.001) in the results on previous knowledge (Preliminary Exam), standing out the group of persons in charge (96.3% of outstandings), although there were no differences for the final knowledge (Final Exam), where re-emphasized to a lesser extent the persons in charge group with 48.1% of outstandings.
Previous knowledge (Preliminary Exam) (Table 7).
The best result was obtained by the group of food chain, with an average qualification of 8.88 ± 0.92, obtaining the group of collective restoration an average of 8.74 ± 0.91. The difference found between both groups was not significant.
Final knowledge (Final Exam) (Table 7).
The average qualifications obtained by both groups were similar resulting 37.62 ± 2.21 for the group of col-

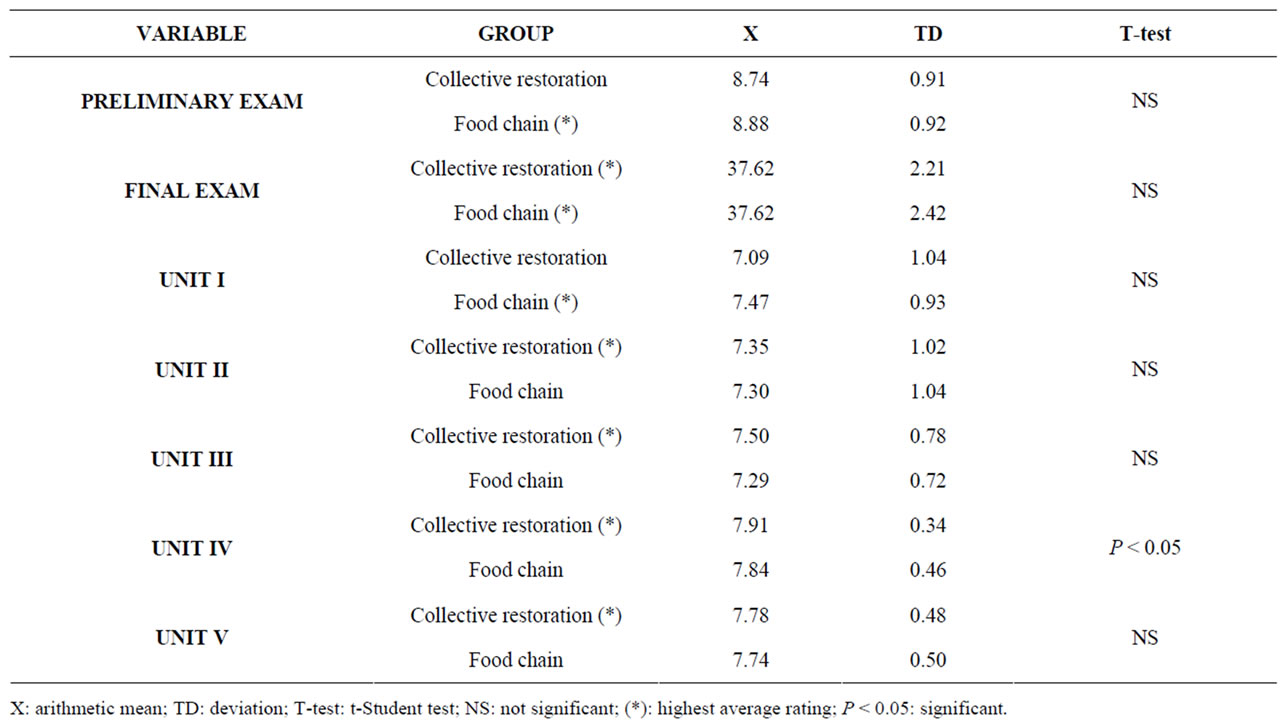
lective restoration and 37.62 ± 2.42 for the group of food chain. No significant differences were found.
According to the Table 8, significant differences were not observed in the results on previous knowledge (Preliminary Exam), though there stood out the group of food chain (68.8% of outstandings). Neither were differences for the final knowledge (Final Exam), where it returned to emphasize the group of food chain with 48.1% of excellent cases.
Previous knowledge (Preliminary Exam) (Table 9).
The group without experience was the best qualified, with 8.99 ± 1.00, group in addition significantly differently (p < 0.005). The qualification obtained by the group with experience was lower, 8.65 ± 0.75.
Final knowledge (Final Exam) (Table 9).
The group without experience obtained an average qualification of 37.76 ± 2.17. The qualification of the group with experience was lower, 37.51 ± 2.38. The statistical analysis did not detect significant differences.
According to the Table 10, were observed significant differences (p < 0.05) in the results on previous knowledge (Preliminary Exam), standing out the group of without experience (76.5% of outstandings). On the other hand they were not for the final knowledge (Final Exam), where a punctuation returned to obtain lightly top the group of without experience with 45.9% of outstandings.
Previous knowledge (Preliminary Exam) (Table 11).
The group superior S.O.E. was the best qualified, with 8.93 ± 0.75, group in addition significantly differently (p = 0.01). The qualification obtained by the group up to S.O.E was lower, 8.73 ± 0.98.
Final knowledge (Final Exam) (Table 11).
The group superior S.O.E. obtained an average quailfication of 38.54 ± 1.36. The qualification of the group up to S.O.E. was lower, 37.13 ± 2.53. The statistical analysis detected significant differences (p < 0.001).
According to the Table 12, significant differences were not observed in the results on previous knowledge (Preliminary Exam), though the group superior S.O.E. stood out (74.6% of outstandings). On the contrary yes were found significant differences (p < 0.001) for the final knowledge (Final Exam), where it returned to emphasize considerably the group superior S.O.E. with 64.2% of outstandings cases.
Previous knowledge (Preliminary Exam) (Table 13).
The group of collective restoration professionals obtained an average qualification of 8.52 ± 1.09, lower than the obtained one for other professionals, 8.90 ± 0.81, existing between both groups significant differences (p = 0.001).
Final knowledge (Final Exam) (Table 13).
It was the group of other professionals the one that obtained the best qualification, 37.84 ± 2.04, whereas the group of collective restoration professionals obtained the lowest one, 37.02 ± 2.79. Were found significant differences (p < 0.05).

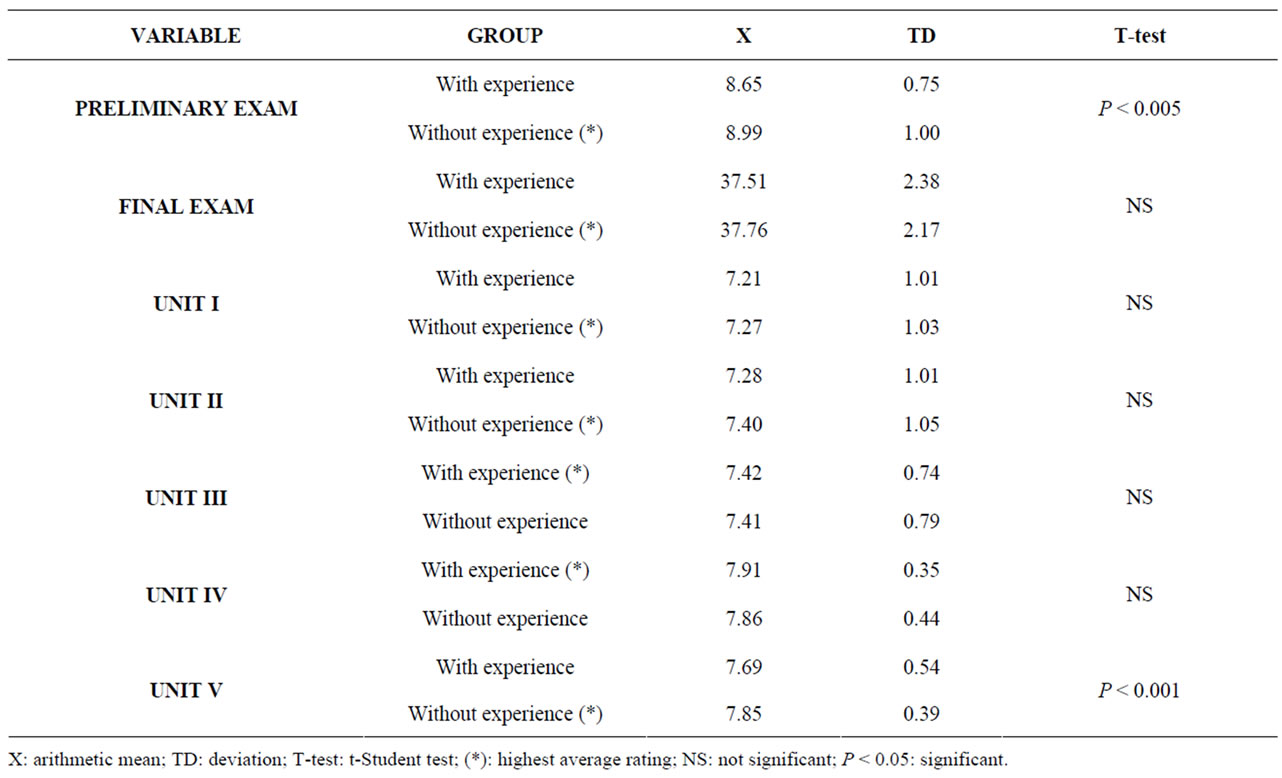
Table 9. Experience: results obtained in quantitative variables.

Table 10. Experience: results obtained in qualitative variables.
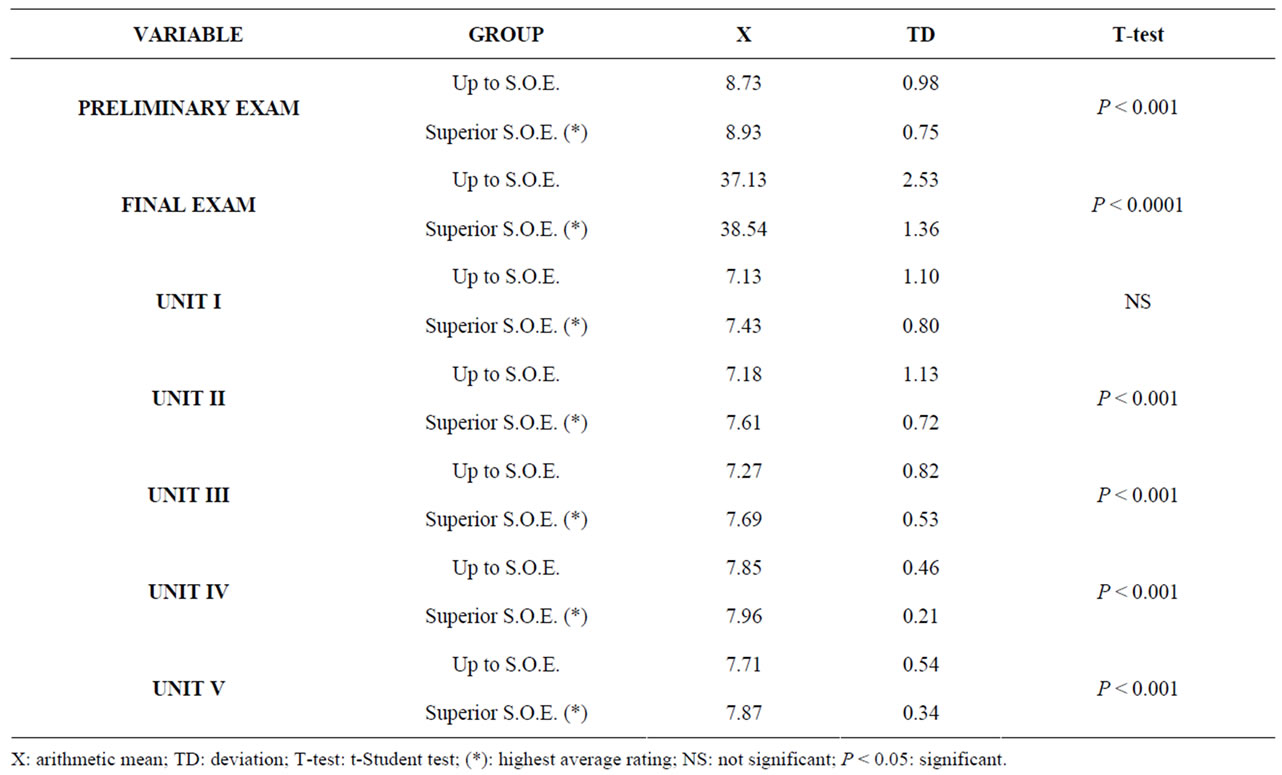
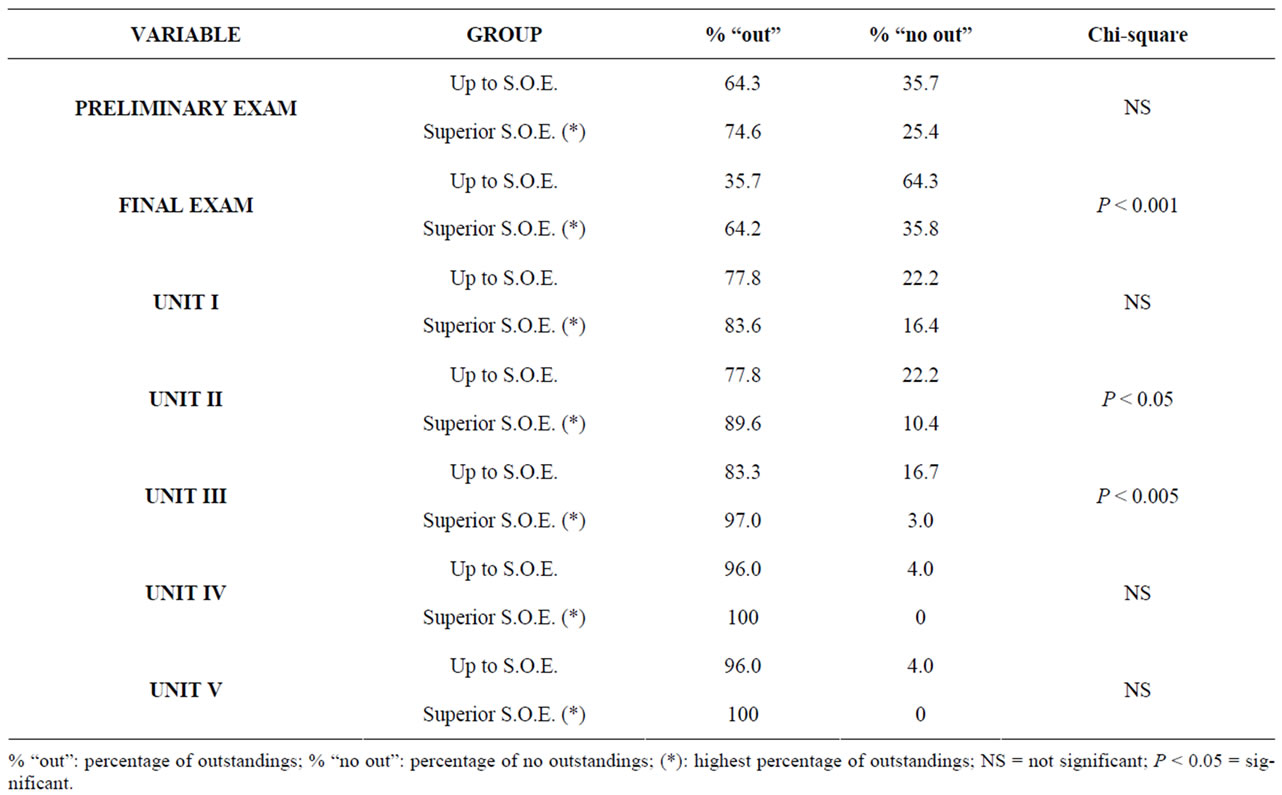
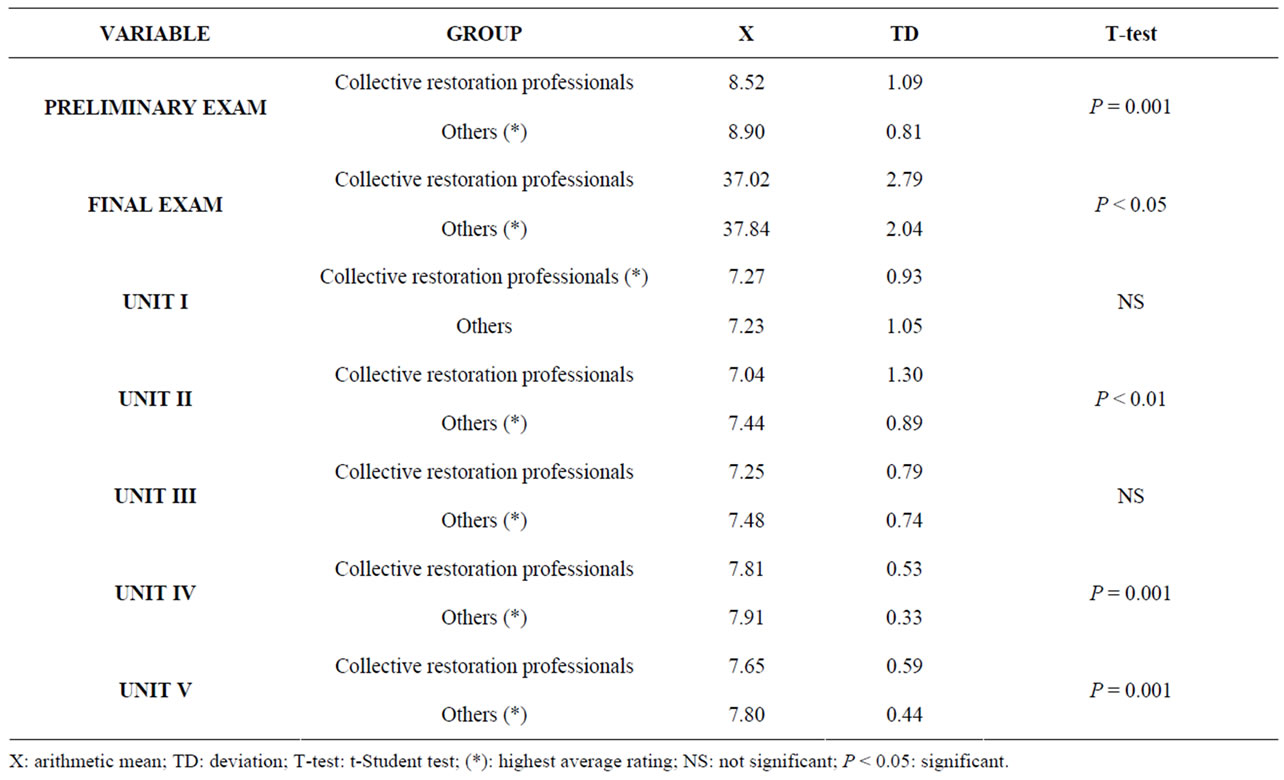
Table 13. Profession: results obtained in quantitative variables.
According to the Table 14, only were observed significant differences (p < 0.005) in the results on previous knowledge (Preliminary Exam), standing out the group of other professionals (73.8% of outstandings). On the contrary, there were no differences for the final knowledge (Final Exam), where returned to stand out the group of other professionals with 48.9% of outstandings.
3.2. Determination of the Most Influential Criteria in the Results of the Exams
Preliminary Exam
Of all the initially considered criteria, turned out to be significant the post (p = 0.012) and the center (p = 0.007). For the model (1) indicated on Statistical analysis of adjusted data of Material and Methods, a value of 0.056 was obtained for the coefficient R square.
In view of the Table 15, we can conclude that the change of group in the criterion post has a similar influence on the result in the preliminary exam that the change of group on the criterion center, not influencing the rest of factors.
After effecting the analysis of the adjusted data, is reflected that the influence of other factors is associated with the criteria post and center.
4. Conclusions
The overall result of the control of food handlers’ train ing was 8.80 ± 0.91 (of an overall of 10 points) for the preliminary exam and 37.62 ± 2.29 (of an overall of 40 points) for the final exam, with the highest average score for those in the field units of personal hygiene (Unit IV). Subsequently being integrated food handlers in HACCP training plan, achieving an effective reduction of food risk level.
The unit received the worst score, and that therefore we should discuss in greater depth was to UNIT I: Ge-
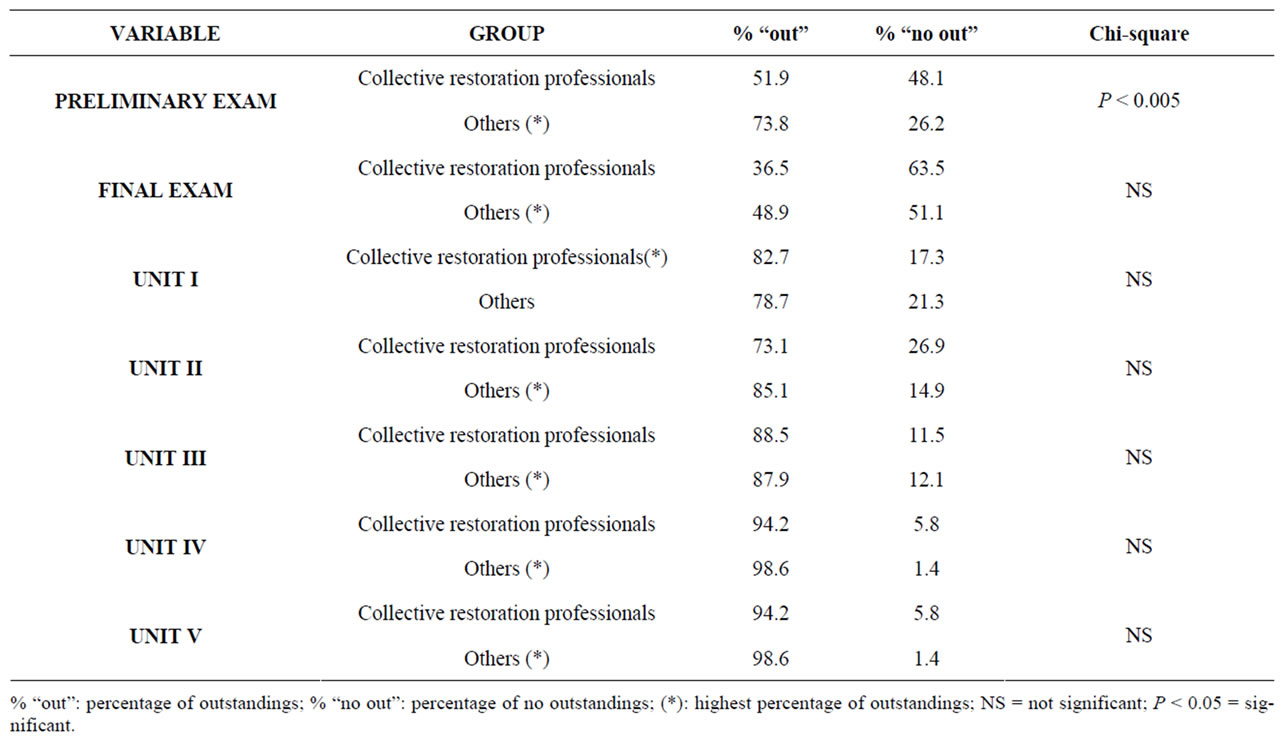
Table 14. Profession: results obtained in qualitative variables.
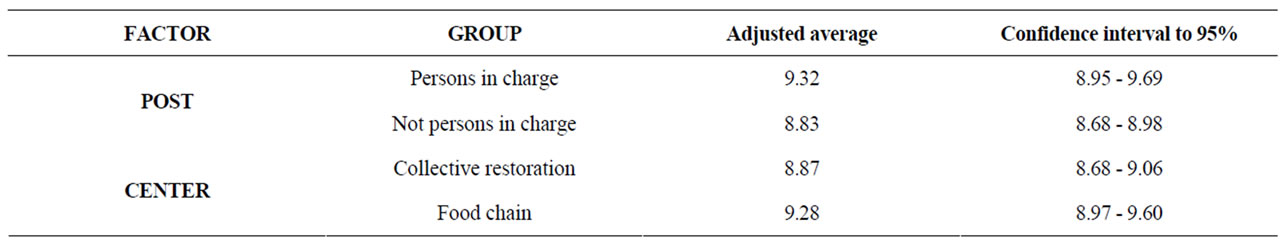
Table 15. Adjusted averages by post and centre in each of his groups, as well as the confidence interval to 95%.
neral concepts related to food handlers and food poisoning, with an average score of 7.24 ± 1.1.
We might say that an “ideal” food handler according to the results, would be one with studies superior to S.O.E. with an age from 30 to 39 years, which it was experienced at the working place and which some position of responsibility had in his working place.
The effect of the center of work on the punctuations was not statistically significant in any case.
In general, the results were satisfactory with a high rate of uptake of courses and a high initial knowledge.
REFERENCES
- Codex Alimentarius, Section X, Capacitation. CAC/RCP 1-1969, Rev. 4-2003.
- J. R. Carballido, A. R. Viyella and I. J. Moreno, “Exigencias de Calidad en las Empresas Alimentarias: Industria Cárnica,” Alimentaria, No. 249, 1994, pp. 23-26.
- M. O. Jannadi, “Impact of Human Relations on the Safety of Construction Workers,” International Journal of Project Management, Vol. 13, No. 6, 1999, pp. 383-386. HHHUdoi:10.1016/0263-7863(95)00031-3U
- M. P. Mortlock, A. C. Peters and C. J. Griffith, “Food Hygiene and Hazard Analysis Control Points in the United Kingdom Food Industry: Practices, Perceptions and Attitudes,” Journal of Food Protection, Vol. 62, No. 7, 1999, pp. 786-792.
- M. Howes, S. McEwan, M. Griffiths and L. Harris, “Food Handler Certification by Home Study: Measuring Changes in Knowledge and Behavior,” Dairy, Food and Environmental Sanitation, Vol. 16, No. 11, 1996, pp. 737-744.
- D. A. Clayton, C. J. Griffith, P. Price and A. C. Peters, “Food Handlers’ Beliefs and Self-Reported Practices,” International Journal of Environmental Health Research, Vol. 12, No. 1, 2002, pp. 25-39. HHHUdoi:10.1080/09603120120110031U
- C. K. Manning and O. S. Snider, “Temporary Public Eating Places: Food Safety Knowledge, Attitudes and Practices,” Journal of Environmental Health, Vol. 56, No. 1, 1993, pp. 24-28.
- L. Green, C. Selman, et al., “Food Service Workers’ Self-Reported Food Preparation Practices: An EHS-Net Study,” International Journal of Hygiene Environmental Health, Vol. 208, No. 1-2, 2005, pp. 27-35. HHHUdoi:10.1016/j.ijheh.2005.01.005U
- T. F. Jones and F. J. Angulo, “Eating in Restaurants: A Risk Factor for Foodborne Disease?” Clinical Infectious Diseases, Vol. 43, No. 10, 2006, pp. 1324-1328. HHHUdoi:10.1086/508540U
- S. P. Luby, J. L. Jones and J. M. Horan, “A Large Salmonellosis Outbreak Associated with a Frequently Penalized Restaurant,” Epidemiology and Infection, Vol. 110, No. 1, 1993, pp. 31-39. HUdoi:10.1017/S0950268800050652U
- M. Lynch, J. Painter, et al., “Surveillance for Food Borne Disease Outbreaks—United States, 1998-2002,” Morbidity and Mortality Weekly Report Surveillance Summaries, Vol. 55, No. SS-10, 2006, pp. 1-42.
- M. A. Widdowson, A. Sulka, et al., “Norovirus and Food Borne Disease, United States, 1991-2000,” Emerging Infectious Diseases, Vol. 11, No. 1, 2005, pp. 95-102.
- T. W. Hennessy, L. H. Cheng, et al., “Egg Consumption is the Principal Risk Factor for Sporadic Salmonella Serotype Heidelberg Infections: A Case-Control Study in FoodNet Sites,” Clinical Infectious Diseases, Vol. 38 Supplement 3, 2004, pp. S237-S243. HUdoi:10.1086/381593U
- J. G. Cruickshank, “Food Handlers and Food Poisoning: Training Programmes are Best,” British Medical Journal, Vol. 300, No. 6719, 1990, pp. 207-208. HHHUdoi:10.1136/bmj.300.6719.207U
- N. H. Bean and P. M. Griffin, “Food Borne Disease Outbreaks in the United States 1973-1987: Pathogens, Vehicles and Trends,” Journal of Food Protection, Vol. 53, No. 9, 1990, pp. 804-817.
- C. Kitcher, “Case for Food Hygiene Training,” Journal of Environmental Health, Vol. 102, No. 6, 1994, pp. 139- 140.
- G. M. Tebbutt, “An Assessment of Food Hygiene Training and Knowledge Among Staff in Premises Producing or Selling High-Risk Foods,” International Journal of Environmental Health Research, Vol. 2, 1992, pp. 131-137. HUdoi:10.1080/09603129209356744U
- J. E. Ehiri and G. P. Morris, “Food Safety Control Strategies: A Critical Review of Traditional Approaches,” International Journal of Environmental Health Research, Vol. 4, No. 4, 1994, pp. 254-263. HUdoi:10.1080/09603129409356824U
- F. L. Bryan, “Risks of Practices, Procedures and Processes That Lead to Outbreaks of Food Borne Diseases,” Journal of Food Protection, Vol. 51, 1988, pp. 663-673.
- G. R. Laverack, “Content Analysis of a Food Hygiene Course and the Assessment of Its Effectiveness in Fulfflling the Training Needs of Food Handlers,” Master of Science Thesis, University of Manchester Medical School, Manchester, 1989.
- E. Taylor, “Is Food Hygiene Training Really Effective?” Environmental Health, Vol. 104, 1996, pp. 275-276.
- D. M. Rennie, “Health Education Models and Food Hygiene Education,” Journal of the Royal Society of Health, Vol. 115, No. 2, 1995, pp. 75-79. HHHUdoi:10.1177/146642409511500203U
- L. Ackerley, “Consumer Awareness of Food Hygiene and Food Poisoning,” Environmental Health, Vol. 102, No. 3, 1994, pp. 69-74.
- I. Ajzen, “The Theory of Planned Behavior,” Organizational Behavior and Human Decision Processes, Vol. 50, No. 2, 1991, pp. 179-211. HHUdoi:10.1016/0749-5978(91)90020-TU
- K. Tones, “Past Achievement and Future Success,” In: I. Sutherland, Ed., Health Education Perspectives and Choices, George Allen & Unwin, London, 1979.
- N. Janz and M. H. Becker, “The Health Belief Model: A Decade Later,” Health Education Quarterly, Vol. 11, 1984, pp. 1-47.
- C. J. Griffith, B. Mullan and P. E. Price, “Food Safety: Implications for Food, Medical and Behavioral Scientists,” British Food Journal, Vol. 97, No. 8, 1995, pp. 23-28.HHH HHH HHHUdoi:10.1016/0749-5978(91)90020-TU
- I. Ajzen and M. Fishbein, “Understanding Attitudes and Predicting Social Behavior,” Prentice Hall, Englewood Cliffs, 1980.
- C. J. Armitage and M. Conner, “Social Cognition Models and Health Behavior: A Structured Review,” Psychology Health, Vol. 15, 2000, pp. 173-189. HHHUdoi:10.1080/08870440008400299U
- B. Mullan, “Knowledge, Beliefs and Attitudes Concerning Food Hygiene in Children and Young Adults in South East Wales,” PhD Thesis, Open University, United Kingdom, 1997.
- K. Ralston, C. P. Brent, Y. Starke, T. Riggins and C. T. J. Lin, “Consumer Food Safety Behavior: A Case Study in Hamburger Cooking and Ordering,” Consumer Food Safety Behavior (Unpublished Report), 2002.
- J. B. Trenda and V. Hillers “Associations between Food Safety Beliefs, Self-Reported Behaviors, Knowledge and Observed Hamburger Patty Handling and Cooking,” Poster presented at: Changing Strategies-Changing Behavior:
- What Food Safety Communicators Need to Know, 12-13 June 1997, Washington.
- C. O’Boyle, S. J. Henly and E. Larson, “Understanding Adherence to Hand Hygiene Recommendations: The Theory of Planned Behavior,” American Journal of Infection Control, Vol. 29, No. 6, 2001, pp. 352-360. HHHUdoi:10.1067/mic.2001. 18405U
- I. F. Angellilo, N. M. A. Viggiani, L. Rizzio and A. Bianco, “Food Handlers and Food Borne Diseases: Knowledge, Attitudes and Reported Behavior in Italy,” Journal of Food Protection, Vol. 63, No. 30, 2000, pp. 381-385.
- F. L. Bryan, “Teaching HACCP Techniques to Food Processors and Regulatory Officials,” Dairy, Food and Environmental Sanitation, Vol. 11, No. 10, 1991, pp. 562-568.
- P. García, F. J. Ehaña, H. Marino, G. Brito and T. González, “Manual para Manipuladores de Alimentos,” Series of Public Health, Canary Islands Health Service, Ministry of Health of the Canary Islands, 1993.
- R. Millán, C. Agudo, A. Cardona, M. Castelo and L. Tudela, “La Formación de los Manipuladores de Alimentos Como Base del Sistema HACCP (ARCPC). Análisis del Rendimiento Escolar en los Cursos de Manipuladores de Alimentos,” 2nd Meeting of Veterinarians of the Autonomous Regions of Madeira, Azores and Canary Islands, Funchal, 1993.