Advances in Remote Sensing
Vol.2 No.4(2013), Article ID:41247,13 pages DOI:10.4236/ars.2013.24037
Comparison of a New Percent Tree Cover Dataset with Existing One and Categorical Land Cover Datasets in Eurasia
1Graduate School of Science, Chiba University, Chiba, Japan
2Center for Environmental Remote Sensing, Chiba University, Chiba, Japan
Email: kobayashit@graduate.chiba-u.jp
Copyright © 2013 Toshiyuki Kobayashi, Ryutaro Tateishi. This is an open access article distributed under the Creative Commons Attribution License, which permits unrestricted use, distribution, and reproduction in any medium, provided the original work is properly cited.
Received September 2, 2013; revised October 2, 2013; accepted October 9, 2013
Keywords: Vegetation; Mapping; Estimation; MODIS; Forestry
ABSTRACT
The global tree cover percentage is an important parameter used to understand the global environment. However, the available percent tree cover products on global or continental-scale are few, and efforts to quantitatively validate these maps have been limited. We produced a new percent tree cover dataset at 500 m resolution in 2008 for Eurasia using reference data interpreted from Google Earth. It is a part of percent tree cover (PTC) data in Global Mapping project. In this study, the dataset was compared with existing global percent tree cover dataset, MODIS Vegetation Continuous Fields, MOD44B. We assessed the agreement of these datasets with two existing global categorical land cover datasets and statistic data in Eurasia. The result showed that estimates of tree cover in our new map and MOD44B were relatively similar at randomly sampled sites. Our map and MOD44B agreed with either or both of land cover maps at 93% of sites and 91% of sites, respectively, for pixel blocks. However, we found that MOD44B disagreed with our map and categorical land cover datasets at about half of the sampled sites where the difference of tree cover percentage between our map and MOD44B was large, especially in the areas with significant differences (more than 50%). Disagreed areas were concentrated in forests of Russia and Indonesia, and in herbaceous dominated vegetation of UK and Ireland. We also found that both our map and MOD44B were somewhat different from the data reported by FRA 2010.
1. Introduction
Forests, by playing an important role in regulating the climate and water resources, and by providing habitats for many species, are of great importance for life on earth. Nevertheless, they have recently been converted to unsustainable forms of land use because of urbanization and deforestation by expanding human populations. About 16.1 million hectares of natural forest were lost annually worldwide during the 1990s [1,2]. Trees are important structural members of forests that remove carbon dioxide from the atmosphere as they grow and emit it when they decay or burn. Some attempts to estimate the global tree cover percentage have been made to date [3-8]. Some reports describe studies of tree cover percentage on a regional scale [9-11]. Continuous field maps present some advantages to measuring the change in spatially complex land cover compared to traditional discrete classifications. Estimates of proportional tree coverage can distinguish dense forest from sparse forest, and forests with small patches of cleared areas [4,12,13]. Maps showing the tree cover percentage are useful in many fields [14,15]. They were used as one independent variable to model the global forest canopy height for mapping ecosystem vertical structures [16]. They are also useful for making environmental policies and elucidating the present environmental situation for education. However, the available global percent tree cover products are few, and efforts to validate these maps have been limited to some regions or countries because of the difficulty of obtaining reference data or field data [12,14, 17,18]. There are studies showing that existing maps’ accuracy of estimating global tree cover is not high, particularly in sparsely forested areas of the circumpolar taiga-tundra transition zone and special areas and ecosystems [14,17,18]. For global land cover maps, some datasets have been released in the last decade [19,20], and users can choose the most suitable map for their application among them. There are also some efforts to evaluate and compare the quality of these maps [21,22]. Therefore, producing a new percent tree cover dataset on a global or continental scale and comparing the quality among maps are valuable. Users of these maps can choose the most suitable map for their particular application and know areas of potential low or high map uncertainty by it.
In this paper, we compared our new percent tree cover map in 2008 [23] with Vegetation Continuous Fields MOD44B, 2008 Percent Tree Cover Collection 5 product (hereafter MOD44B) published by University of Maryland [24]. It is difficult to assess the accuracy of tree cover percentage maps by random sampling method, because collecting ground truth data for global or continental scale is difficult. Therefore, they were compared using two new global categorical land cover datasets: (1) GlobCover land cover product [19]; and (2) the MODIS Collection 5.1 Land Cover Type product (V51 MCD12Q1) [20]. They were also compared with statistic data reported by Global Forest Resources Assessment 2010 [25] at the country level.
2. Data Used
Our new percent tree cover map in Eurasia was produced for 2008. Therefore, the data in 2008 were used for MOD44B and MODIS Land Cover Type product, and land cover map produced for the year 2009 was used for GlobCover product. The summary of the datasets used in this study is shown in Table 1.
2.1. Percent Tree Cover Datasets
2.1.1. Our New Percent Tree Cover Map in Eurasia
A new percent tree cover (PTC) dataset was produced in Global Mapping project [26]. The detail methodology of this dataset production is in the process of publication [23]. Here, the methodology is described briefly.
Our map was produced using Global MODIS 2008 data processed by CEReS Chiba University [27], which were produced from the TERRA/AQUA Nadir BRDFAdjusted Reflectance 16-day L3 Global 500 m product (MCD43A4 NBAR) [28-30]. We also used Google Earth images as reference data. Flowchart of percent tree cover estimation in our new map is shown in Figure 1.
1) The reference data for training were obtained from various land cover types. They were collected only from areas where the tree cover percentage was about 100% or 0%, as judged from Google Earth images, because it was sometimes too difficult to distinguish trees from Google Earth images.
2) Training data of 0% - 100% tree cover percentage were created in a simulation by combining many reference data using 7 bands’ reflectance values of MODIS data in 2008. In the simulation, more than 5,000,000 training data were created.
3) For estimating the tree cover percentage, original MODIS band values were converted into predictor variables. Annual predictor variables at the peak of the growing season and the annual brightest reflectance for bands 1 - 7 were mainly used for the estimation of tree cover percentage.
4) A tree model for estimating tree cover percentage was fitted using training data.
5) The tree model was applied to all pixels in Eurasia.
6) We randomly collected the sites (approximately 10 × 10 pixels) for modifying the tree model in advance to create an unbiased model. The sampled sites were overlaid on Google Earth images, and they were used as evaluation data. For the evaluation data, totally 716 sites were collected.
7) The estimation result was compared with evaluation data by visual interpretation of tree cover in Google Earth. We modified the model further to fit the evaluation data. We collected more reference data for training when it was necessary for modification.
In our map, tree cover percentage referred to the percentage of the ground surface area covered by a vertical projection of the foliage and branches of trees when the leaves were at full growth. Small openings inside each crown were included (percent crown cover). A “tree” meant a woody perennial with a single selfsupporting main stem, with minimum height of ca. 3 - 6 m. Trees for agricultural production or in gardens, and trees on plantations were included. Bamboos and palms were also included as trees. This definition was conceptual because it was difficult to ascertain these characteristics from satellite images.
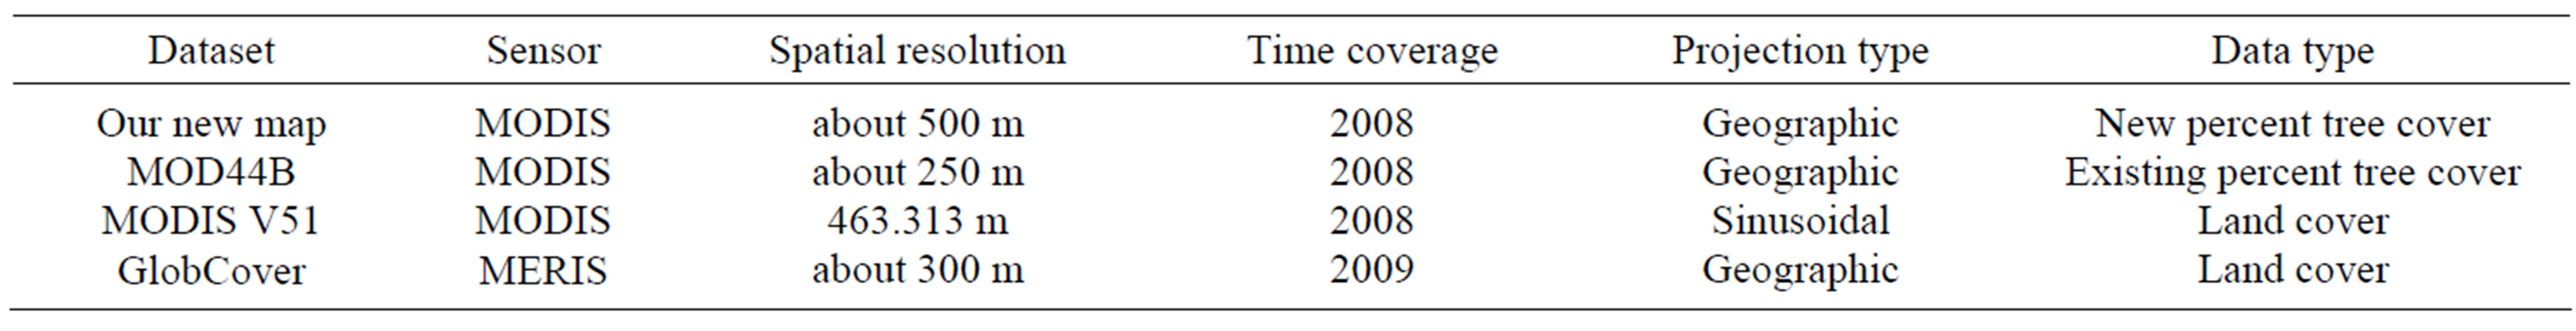
Table 1. Summary of the four datasets used in this study.
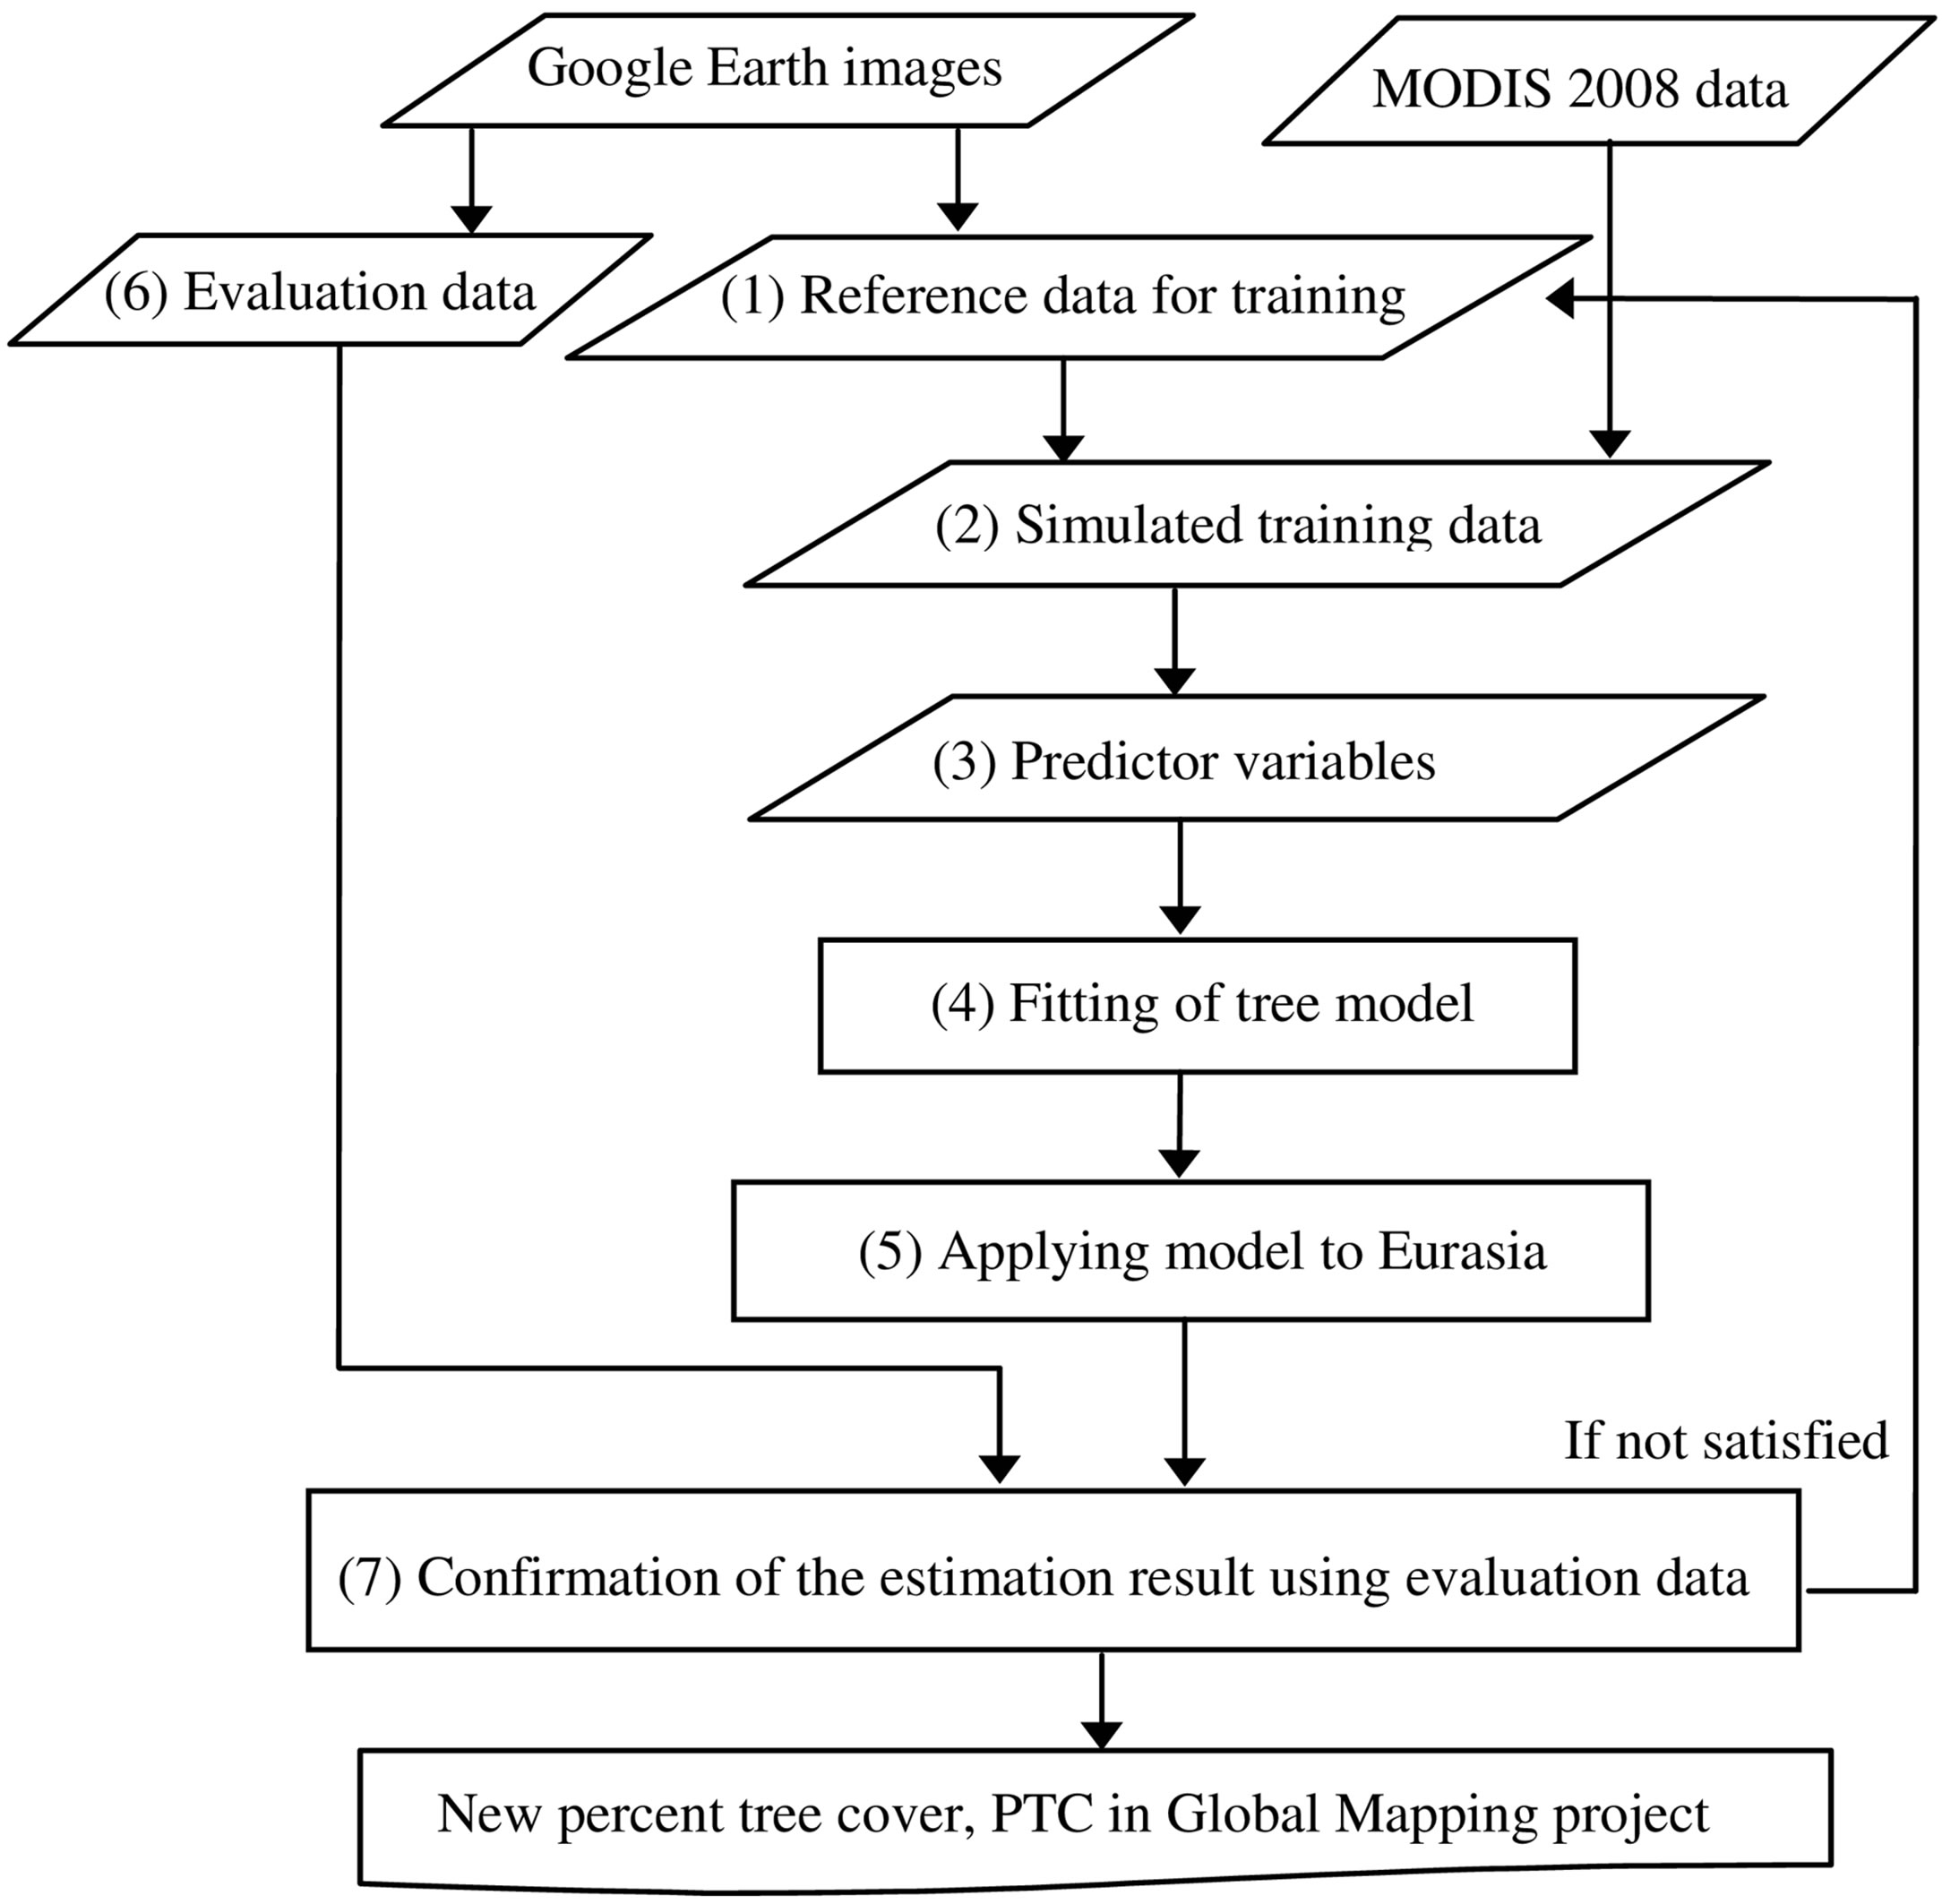
Figure 1. Flow of a new percent tree cover map, PTC, in global mapping project.
2.1.2. MOD44B
This product was derived through an automated procedure using supervised regression tree algorithm, and produced at annual time steps since 2000. The inputs data used for the product were MODIS data for bands 1 - 7 and Land Surface Temperature data. Training data were created by aggregating discretely classified Landsat images to the MODIS cells. They were refined using a lot of fine resolution data [5,13,24].
Definitions of “tree” and “tree cover percentage (or tree crown cover)” differ among reports of the literature [5,10,31]. For MOD44B, tree cover percentage meant the amount of light obstructed by tree canopies equal to or greater than 5 m in height per 500-m MODIS pixel (percent canopy cover) [5]. A reasonable relation was found between canopy cover and crown cover, by which 80% canopy cover corresponded to 100% crown cover, although this relation differed by tree type [5]. In this study, tree cover percentage in MOD44B was divided by 0.8 because tree cover percentage of our map referred to percent crown cover.
2.2. Global Categorical Land Cover Datasets
Several global categorical land cover maps using remote sensing have been available since 1990s. We used two new global datasets, GlobCover product and MODIS Land Cover Type product.
2.2.1. GlobCover Land Cover Map
The GlobCover 2009 V2.3 global land cover map is the newest version of GlobCover land cover product and was derived from Medium Resolution Imaging Spectrometer Instrument (MERIS) Fine Resolution (FR) surface reflectance mosaics for the year 2009. It was developed using an automatic and regionally-tuned unsupervised classification techniques for the stratified equal-reasoning areas, and supervised classification techniques for urban and wetland areas [19,32]. The land cover classes of this map were defined using the United Nations (UN) Land Cover Classification System (LCCS) [33]. The data were downloaded from the European Space Agency GlobCover Portal [34]. Hereafter, we refer to this product as GlobCover.
2.2.2. MODIS Collection 5.1 Land Cover Type (V51 MCD12Q1) Product
This product (MCD12Q1) is produced using data from MODIS at annual time steps since 2001. Collection 5.1 is the newest version of this product. It was derived through a supervised decision-tree classification algorithm using a database of 1860 high quality land cover training sites. MODIS NBAR data for bands 1 - 7 and Land Surface Temperature data were used for input features [20]. We obtained the data through the NASA online Reverb tool [35]. We used land cover classes defined by the International Geosphere-Biosphere Programme classification (IGBP) [36,37] among available five different land cover classification layers. Hereafter, we refer to this product as MODIS V51.
2.3. Global Forest Resources Assessment 2010
Global Forest Resources Assessment provides the data and information on forests. It is carried at five-year intervals by FAO. Global Forest Resources Assessment 2010 (hereafter FRA2010) examined the current status and recent trends for more than 90 variables and all type of forests for the years 1990, 2000, 2005 and 2010 [2,25]. We used the provided information on extent of forest, other wooded land and other land areas in 233 countries and areas for the year 2010. The information was derived from officially validated country reports [25]. In FRA 2010, “forest” means the land spanning more than 0.5 hectares with tree canopy cover greater than 10%. Tree canopy cover is the same meaning as tree crown cover in our map. A “tree” must be higher than 5 meters or able to reach a height of 5 meters. Land that is predominantly under agriculture or urban land use is not included. The definition of other wooded land is the same as forest except that a canopy cover is between 5 and 10% and land with a combined cover of shrubs, bushes and trees above 10 % is included [1,25].
2.4. Google Earth Images, Landsat Enhanced Thematic Mapper Plus Data and Corine Land Cover Map
Google Earth images were used as reference data. In recent years, high-resolution imagery in Google Earth has been valuable and used for reference data in the field of remote sensing [18,38]. It can be used for validation data of continuous field products [38]. The salient advantage of using Google Earth is that high-resolution images of inaccessible places are obtainable at no cost. We could also obtain several images in different years at specific places. Landsat 7 Enhanced Thematic Mapper Plus (ETM+) Scan Line Corrector Off (SLC-Off) data, which were available from the U.S. Geological Survey, were also used for reference data. Images obtained from Google Earth were examined by comparison with these Landsat images because the images in 2008 might differ from that shown in the acquired date of Google Earth images. We also used a land cover map of Europe in 2006 published by the Commission of the European Communities as reference data. The map was produced based on the aims of the CORINE (Coordination of information on the environment) program. The resolution of this map is 100 and 250 meters. The land cover classes of the map are defined in three levels and the most detailed level has 44 classes. The data were downloaded from the site of European Environment Agency (EEA). Hereafter, we refer to this product as CLC2006.
3. Methods
3.1. Study Area
The comparison was made for Eurasia, extending from 11˚W to 180˚E and 10˚S to 80˚N. Eurasia includes various climate zones: tropical, temperate, cold and arid climates [39].
3.2. Methods
First, we compared our map and MOD44B with categorical land cover datasets at randomly sampled sites, and assessed the consistency between percent tree cover maps and land cover maps. For the assessment, we calculated the range of tree cover percentage for land cover maps, and computed an agreement score. Second, we assessed the sites where the difference between two tree cover percentage maps was large. This assessment was made using land cover maps, and Google Earth and Landsat images when available. Finally, we compared our map and MOD44B with the data reported by FRA 2010 at country level.
3.2.1. Comparison of Percent Tree Cover Datasets at Randomly Sampled Sites
The comparison of percent tree cover datasets was made for individual pixels and for blocks of multiple pixels, because a pixel-level comparison is not accurate when their geo-location is not correct. The comparison was made at randomly sampled sites across the study area. We first sampled two hundreds sites on our map and MOD44B throughout the study area using a stratified random sampling approach. Water areas were excluded from the sampling beforehand. In this process, all pixels in percent tree cover maps were divided into ten strata by the estimated tree cover percentage (0% - 10%, 11% - 20%, 21% - 30%, 31% - 40%, 41% - 50%, 51% - 60%, 61% - 70%, 71% - 80%, 81% - 90% and 91% - 100%) in both maps. Ten pixels for each stratum were randomly sampled from the two maps. Our map was further overlaid on MOD44B, and the pixels which the center of each sampled pixel on MOD44B lay inside were also sampled on our map, and the pixels which the center of each sampled pixel on our map lay inside were also sampled on MOD44B. Totally two hundreds pixels on our map and two hundreds pixels on MOD44B were sampled and used for pixel-level comparison. We also sampled 5 × 5 windows of pixels centered on each sampled pixel on our map, and 11 × 11 windows of pixels on MOD44B corresponding to almost the same window size as that of our map were sampled. These windows of pixels were used for pixel-block comparison. For the comparison with categorical land cover datasets, each map legend need to be converted to a tree cover percentage because the categorical land cover datasets indicate discrete classes. We determined the maximum and minimum tree cover percentages for the LCCS and the IGBP classes from their definitions (Table 2). When the tree cover percentage of sampled pixels on our map or MOD44B was within the range of tree cover percentage calculated from
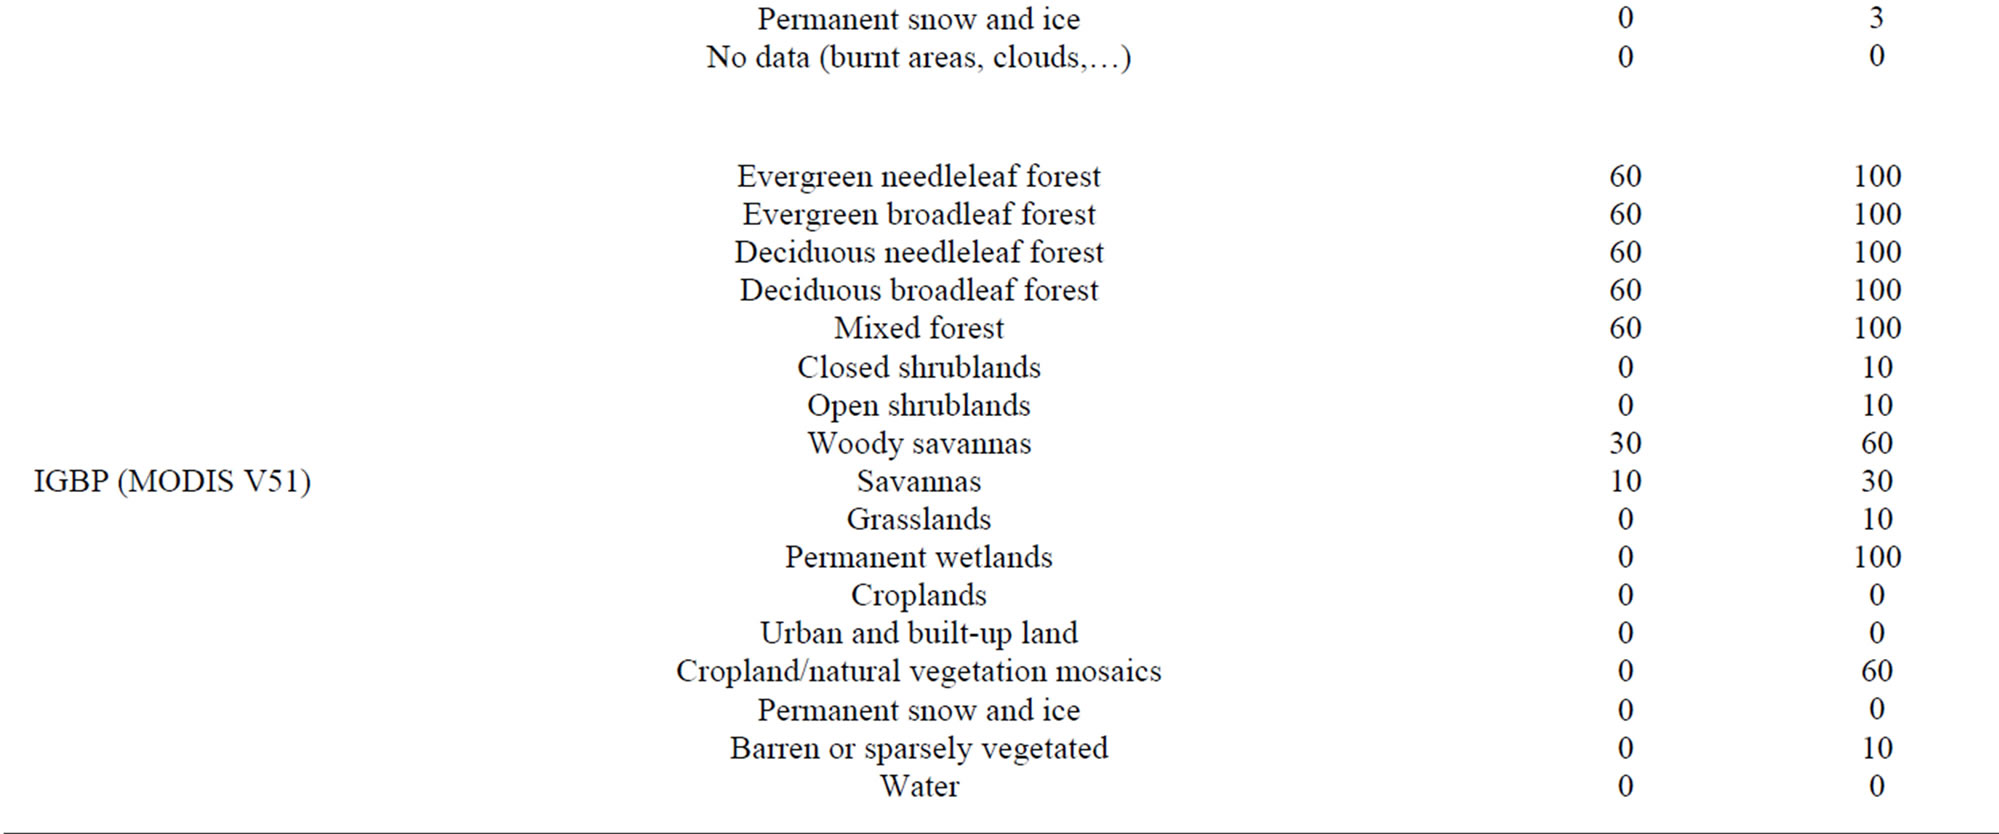
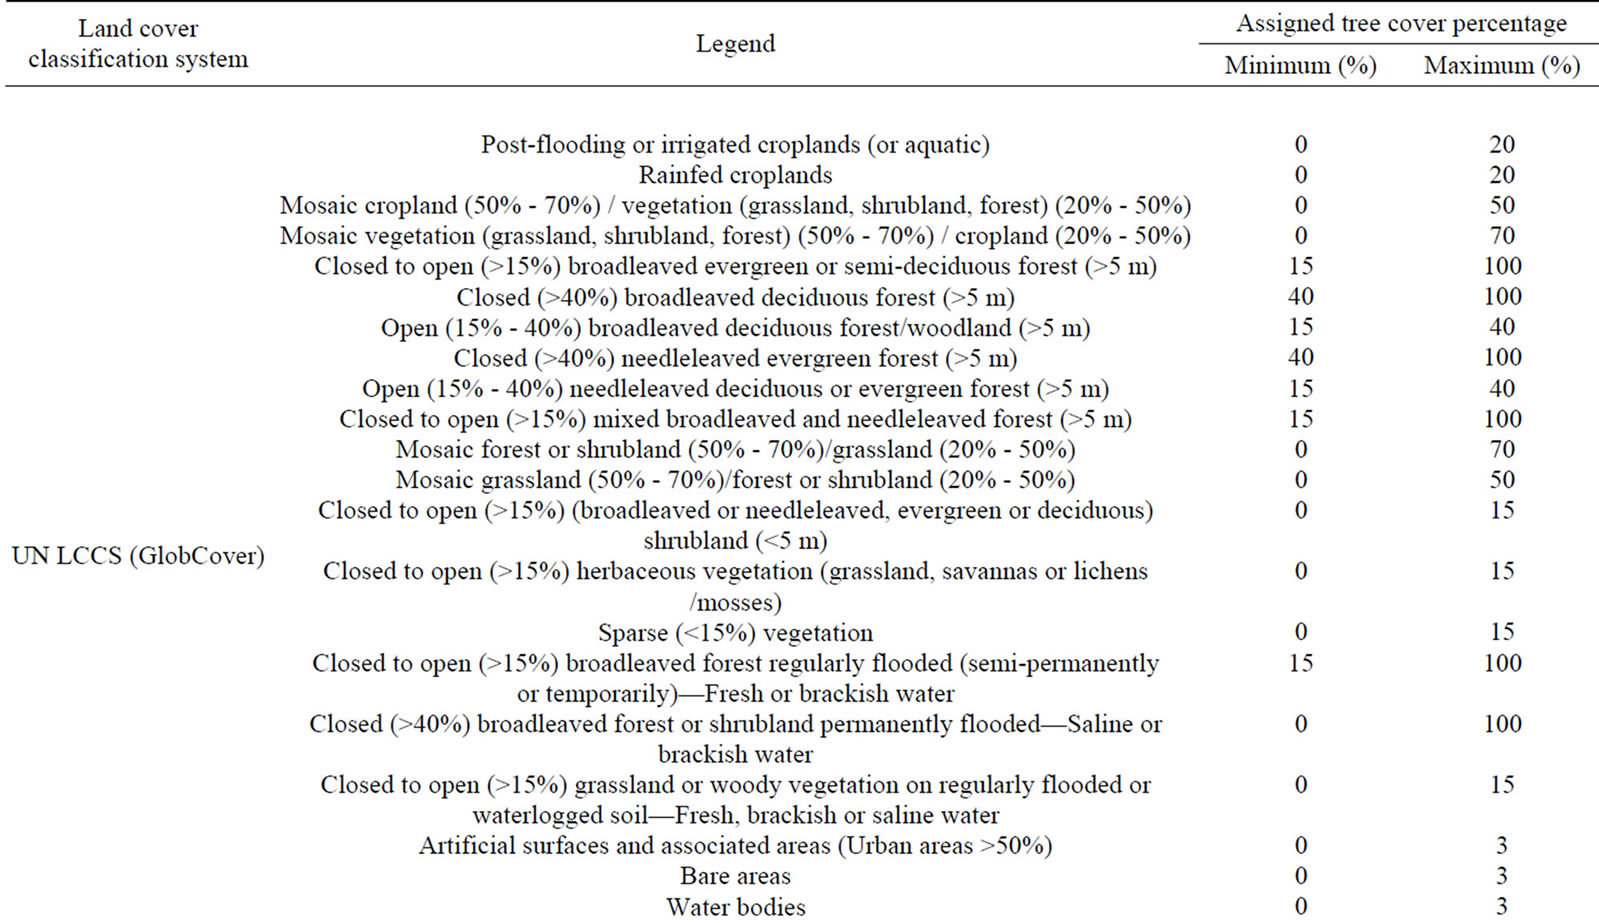
Table 2. The maximum and minimum tree cover percentage assigned to each land cover class for the comparison. It was determined from its definition.
the maximum and minimum values for land cover maps, we interpreted that it agreed with the land cover map. Because the projection, resolution and geo-location were not different among maps, we compared a pair of pixels whose center is the closest for a pixel-level assessment. For the assessment of 5 × 5 window of sampled pixels, we calculated the range of tree cover percentage of land cover maps using all pixels whose center was inside the corresponding window, and computed an agreement score as the average of pixels (Figure 2). For example, when there were 60% of pixels of evergreen forest and 40% of pixels of grasslands in a 5 × 5 window for MODIS V51, the range of tree cover percentage became 36% - 64%. In this case, if the tree cover percentage of our map or MOD44B was within the range, we interpreted that it agreed with the land cover map.
3.2.2. Assessment of Percent Tree Cover Datasets at Sites Where the Difference between Two Maps Was Large
There were areas where the difference of tree cover percentage between our map and MOD44B was large.
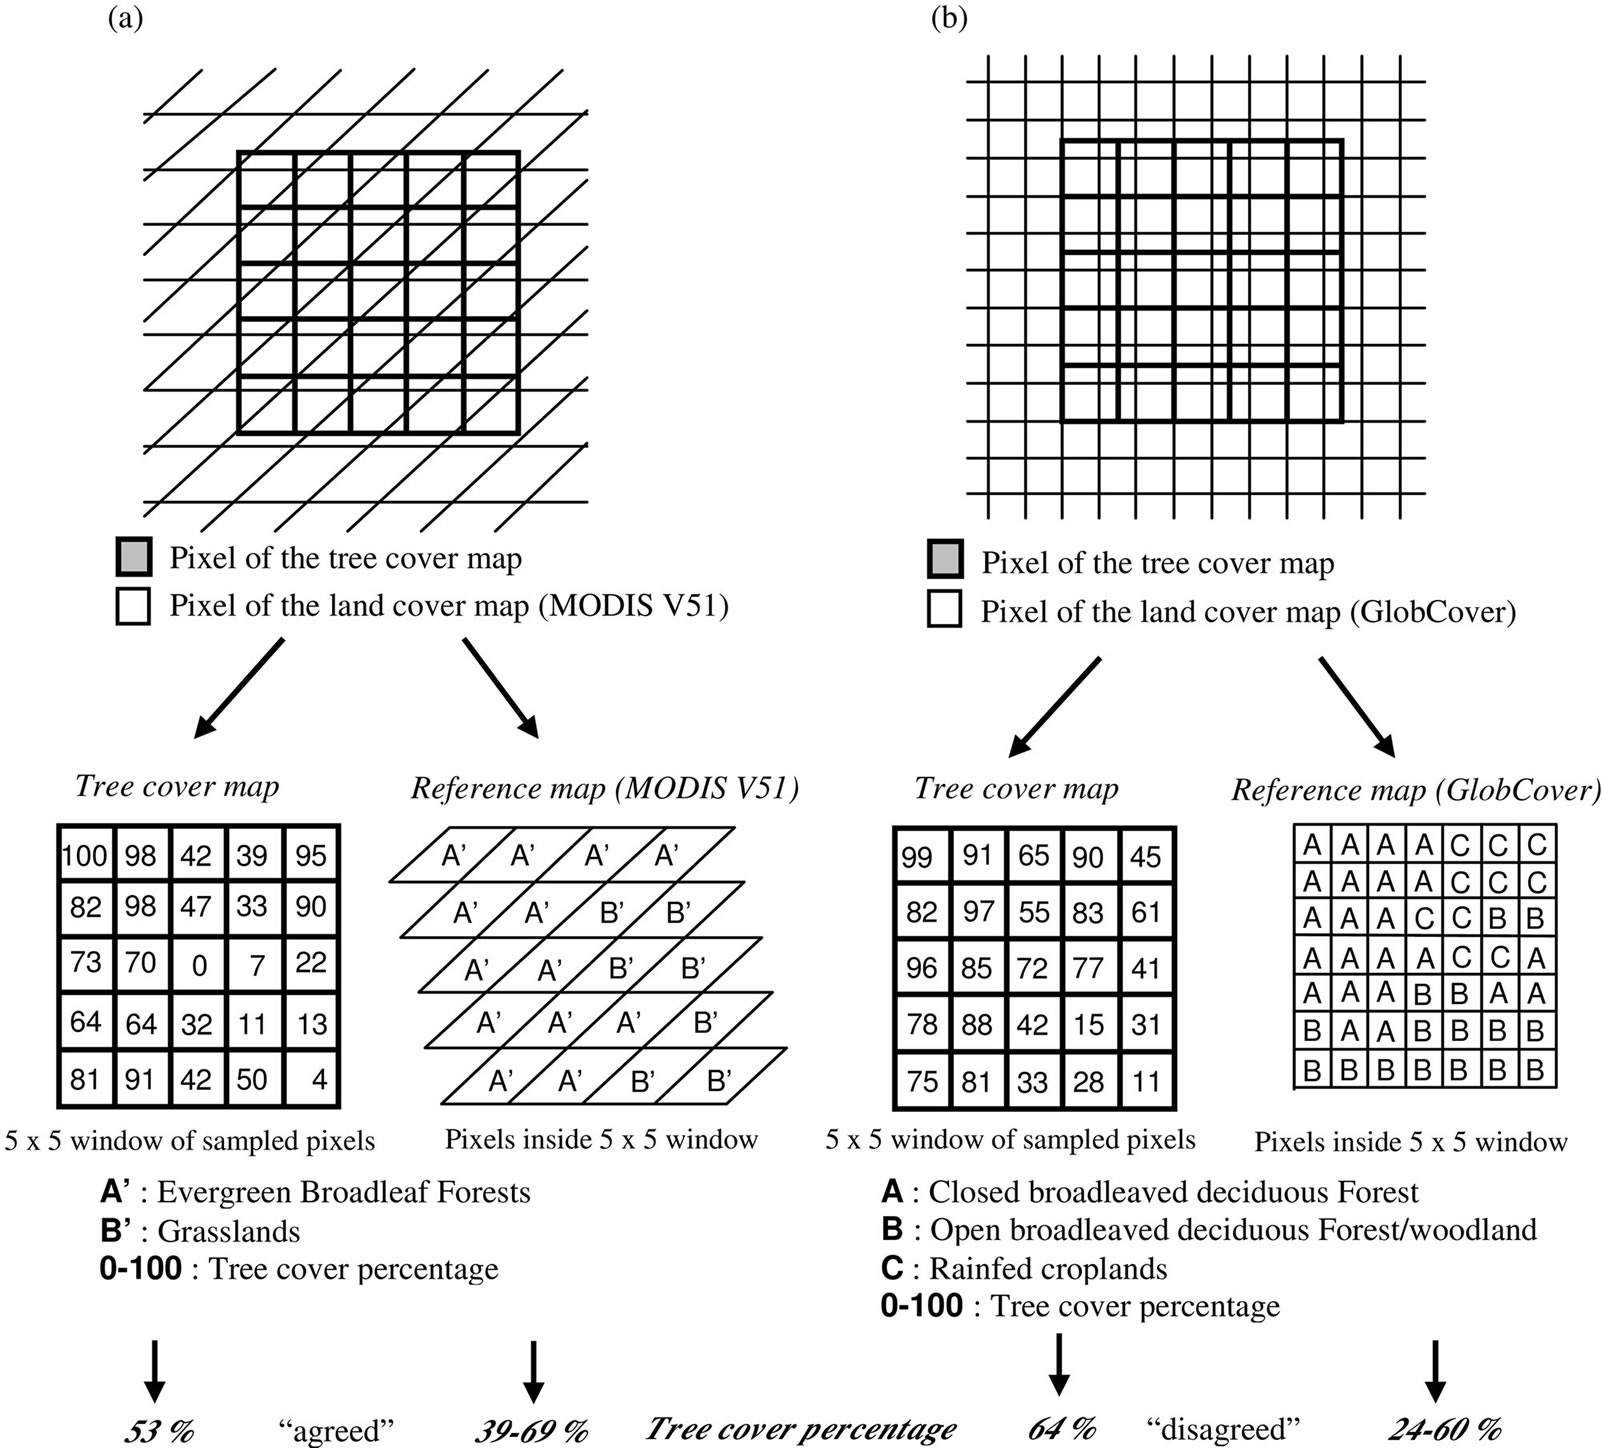
Figure 2. Examples of the comparison for a 5 × 5 window of sampled pixels between tree cover map (our result or MOD44B) and land cover map, MODIS V51 (a) or GlobCover (b). The tree cover percentage of land cover maps was calculated using all pixels whose center was inside each window.
Actually, 3.0% of pixels showed a difference of more than 30% between our map and MOD44B [23]. To assess these areas, we examined the sites where the difference of tree cover percentage between two maps was greater than 30%. This comparison was made for pixel blocks to minimize misregistration errors instead of pixel-level comparison. First, we resampled the pixels of our map into the size of a 5 × 5 window of pixels by averaging pixel values inside each window. The 5 × 5 window of pixels on our map corresponded to 75 second resolution. Second, pixels of MOD44B was resampled into the same position and size of our resampled map by averaging pixel values inside each window. Third, we overlaid our map on MOD44B, and calculated the difference between two maps. Finally, 30 pixels were randomly sampled from pixels where the difference of tree cover percentage between two maps was greater than 30% and 50%, and they were assessed using land cover maps. In sites where high-resolution imagery in Google Earth was available, we also compared the data with the tree cover percentage extracted through visual interpretation of tree cover on Google Earth and Landsat images as reference. CLC2006 was also used for the comparison in sites of Europe. Water areas were excluded from the assessment.
3.2.3. Comparison of Percent Tree Cover Datasets with FRA2010
In this step, our map and MOD44B were projected to an equal area projection and the proportion of pixels was calculated for three tree cover strata by the estimated tree cover percentage (0% - 4%, 5% - 10% and 11% - 100%) at each country. Area coverage percent of forest, other wooded land and other land areas in FRA2010 were calculated and assigned to three tree cover strata on our map and MOD44B (11% - 100%, 5% - 10% and 0% - 4%, respectively). Inland water was included in a 0% - 4% tree cover in this calculation. We selected 12 countries (Afghanistan, Belarus, Finland, France, Greece, India, Indonesia, Japan, Kyrgyz, Laos, Oman and Russia), and the comparison was made for those countries.
4. Results
4.1. Comparison with Land Cover Maps
Randomly sampled sites used for the comparison are shown in Figure 3, and agreement score between percent tree cover map and land cover dataset is shown in Table 3. For blocks of multi pixels, our map disagreed with land cover maps by more than 20% at 39 sites (GlobCover) and 7 sites (MODIS V51), and MOD44B disagreed with land cover maps by more than 20% at 33 sites (GlobCover) and 9 sites (MODIS V51). There was not so much difference in agreement score between our map and MOD44B for blocks of multi pixels. Both percent tree cover maps were more coincident with MODIS V51 than GlobCover at the sites with higher tree cover percentage (61% - 100% tree cover). However, at the sites with lower tree cover percentage (0% - 40% tree cover), they were more coincident with GlobCover. For the comparison of blocks of multi pixels, 42.9% and 95.2% of sites with higher tree cover percentage in our map agreed with GlobCover and MODIS V51, respectively. At the sites with lower tree cover percentage, 89.5% and 48.8% of sites in our map agreed with GlobCover and MODIS V51, respectively. For MOD44B, 42.1% and 98.7% of sites with higher tree cover percentage agreed with GlobCover and MODIS V51, respectively, and 85.5% and 49.4% of sites with lower tree cover percentage agreed with GlobCover and MODIS V51, respectively. The areas with lower agreement between GlobCover and percent tree cover maps were mainly shown in croplands, shrub lands, open forests and the mosaic areas of forest and other vegetation mapped in GlobCover, and the areas were estimated as 60% - 100% tree cover in our map and MOD44B, and MODIS V51 mainly mapped the areas as mixed forests. The areas with lower agreement between MODIS V51 and percent tree cover maps were mainly shown in woody savannas (30% - 60% tree cover) mapped in MODIS V51, where the tree cover percentage was estimated as 0% - 30% in our map and MOD44B, and croplands (0% tree cover) and open shrub lands (0% - 10% tree cover), where the tree cover percentage was estimated as 10% - 40%. Those areas were mainly mapped as mosaic areas of cropland and other vegetation, or open forests in GlobCover.
Our map and MOD44B did not agree with both land cover maps at 14 sites and 18 sites, respectively. On our map, the difference was more than 10% at 1 site, where our map estimated the tree cover percentage as 85%, whereas GlobCover and MODIS V51 classified the site as open forest and woody savanna, respectively. On MOD44B, the difference was more than 10% at 2 sites, where the tree cover percentage was estimated as more than 30%, whereas GlobCover and MODIS V51 classified the sites as herbaceous vegetation and grasslands, respectively. With respect to the relationship between map agreement and the size of sampling units, the number of sites where the difference with land cover datasets was more than 20% decreased for blocks of multi pixels, compared to pixel-scale comparison, although there were the sites where the agreement score with land cover maps was lower for blocks of multiple pixels. These sites were in forests with some pixels of open forest (15% - 40% tree cover), shrub land or other vegetation, and the percent tree cover maps estimated these sites as more than 90% tree cover.
4.2. Assessment at Sites Where the Difference between Two Maps Was Large
The result of the assessment using land cover maps is presented in Figure 4. For 30 randomly sampled sites where the difference of tree cover percentage between our map and MOD44B was greater than 50%, our map was more coincident with two land cover maps than MOD44B. At 57% and 80% of the sampled sites, our map agreed and MOD44B disagreed with GlobCover and MODIS V51, respectively. Both GlobCover and MODIS V51 classified a greater proportion of the sites as forests, whereas MOD44B underestimated tree cover of the sites. A part of the sites were classified as herbaceous vegetation, and mosaics of cropland and other vegetation in both land cover maps, whereas MOD44B overestimated tree cover at the sites. Conversely, MOD44B agreed and our map disagreed with land cover maps at 23% (GlobCover) and 7% (MODIS V51) of sampled sites. GlobCover and MODIS V51 mainly classified the sites as open forests (15% - 40% tree cover), sparse vegetation, shrub lands, and mosaics of cropland and other vegetation, where our map overestimated tree cover. At two sites, our map agreed and MOD44B disagreed with GlobCover, and vice versa with MODIS V51. The sites were mapped as open forests and deciduous needle-leaf forests by GlobCover and MODIS V51, respectively. At other sampled sites (20% in GlobCover and 13% in MODIS V51), both our map and MOD44B agreed or
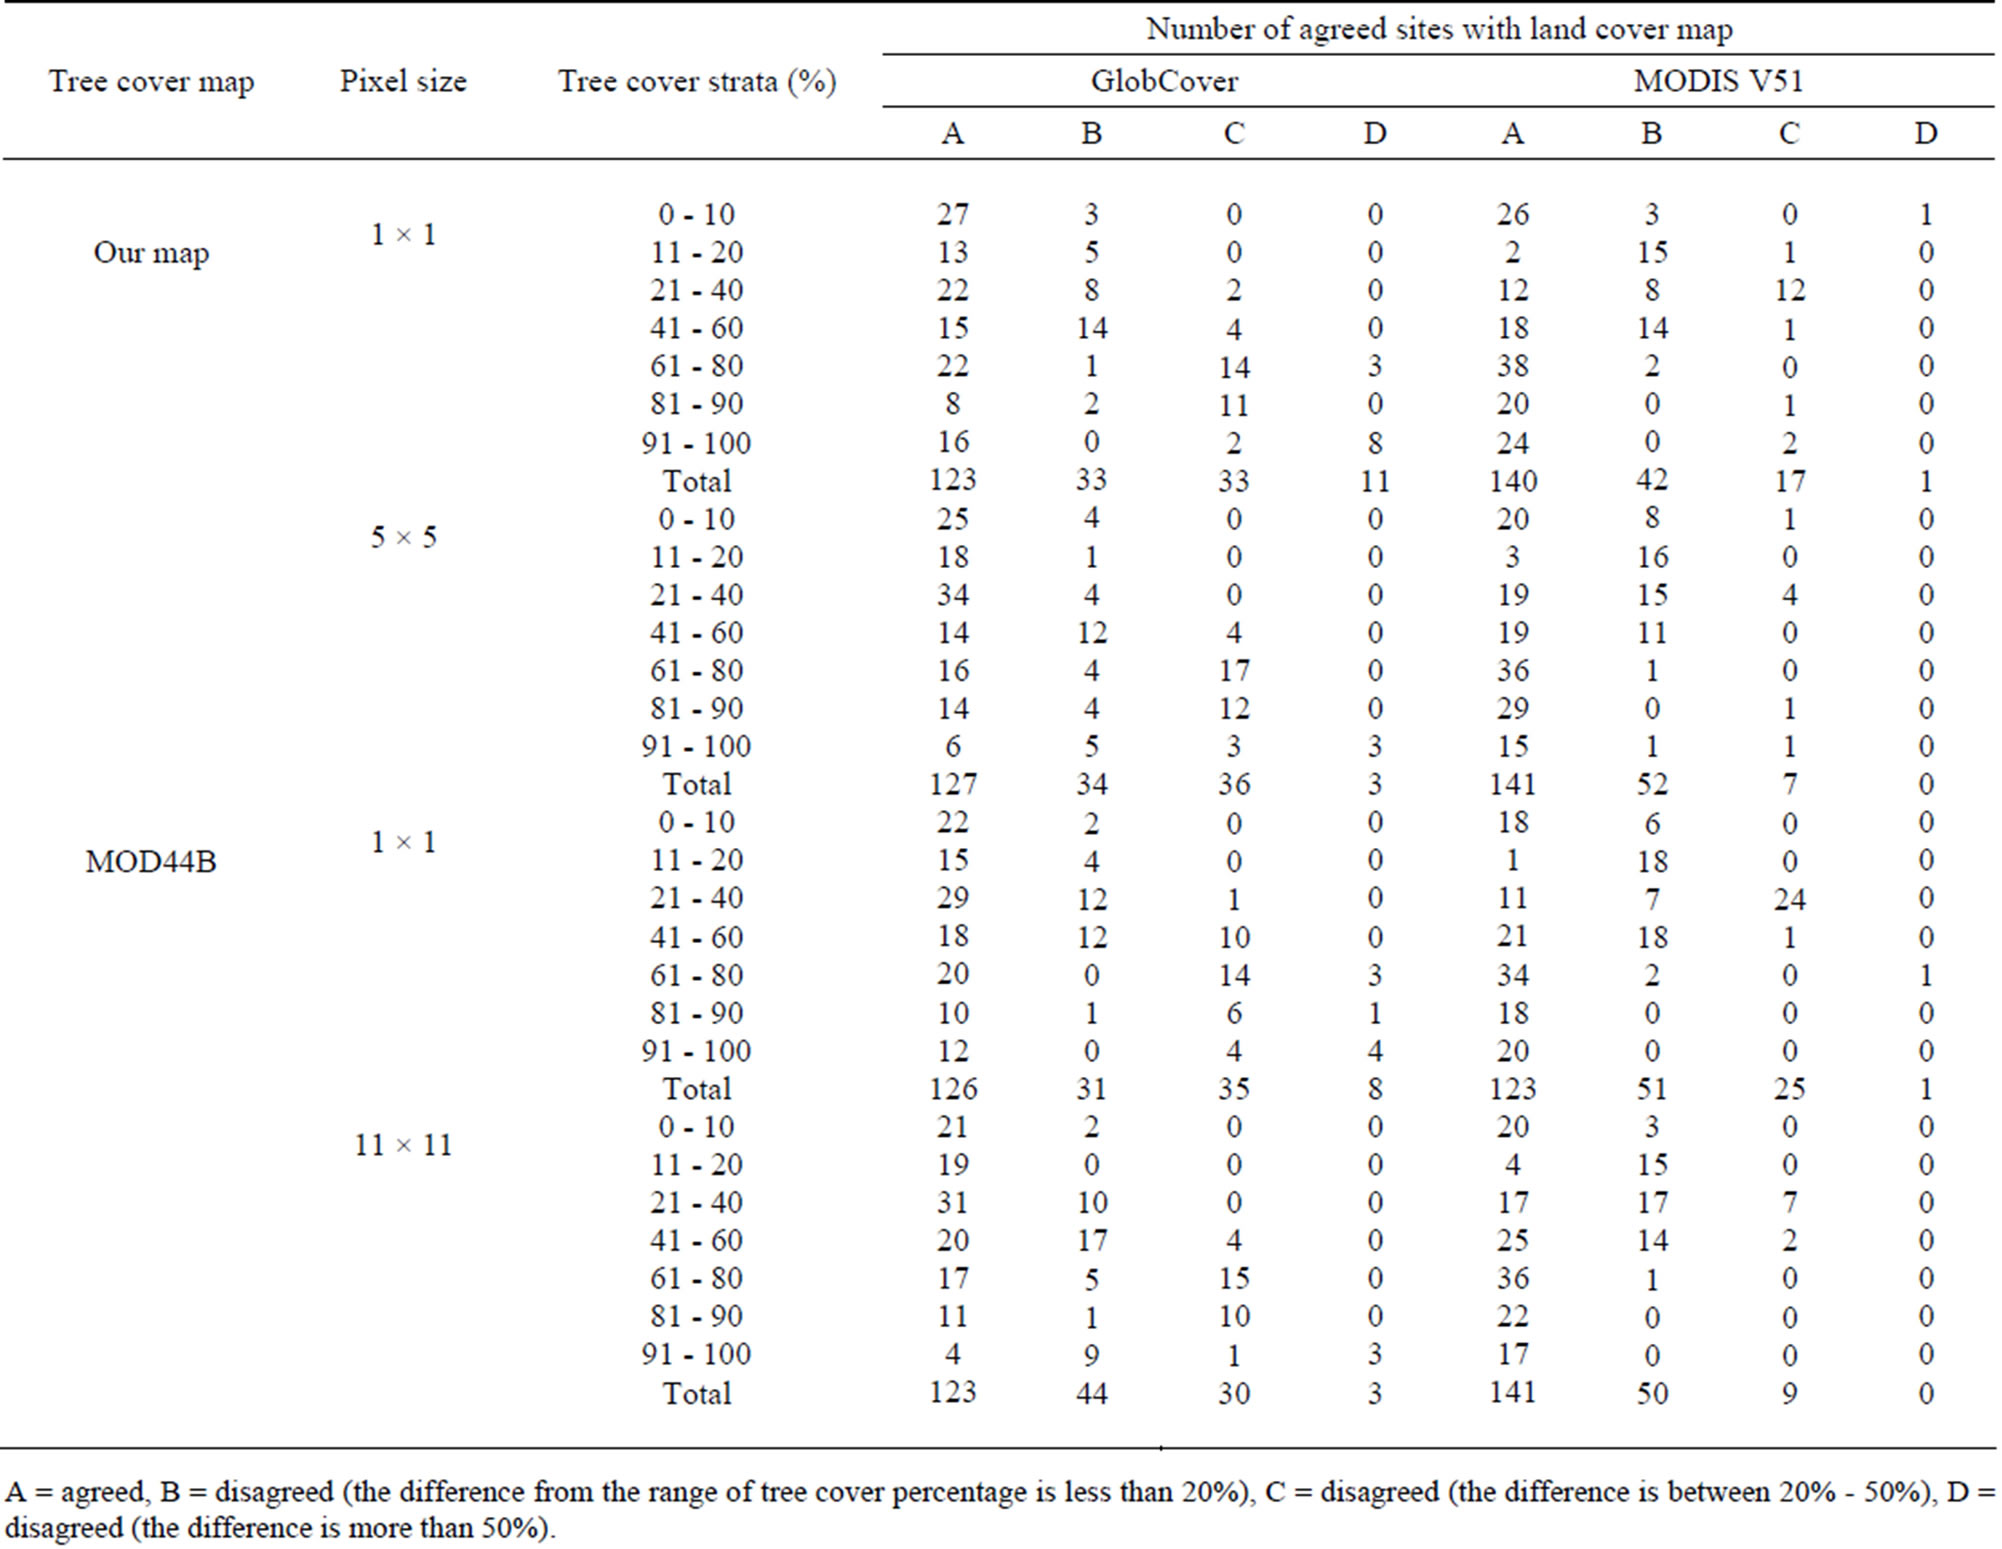
Table 3. Comparison of our map and MOD44B with land cover maps. This assessment was made at sites sampled by stratified random sampling method. The tree cover percentage was divided by 0.8 in MOD44B.
A = agreed, B = disagreed (the difference from the range of tree cover percentage is less than 20%), C = disagreed (the difference is between 20% - 50%), D = disagreed (the difference is more than 50%).
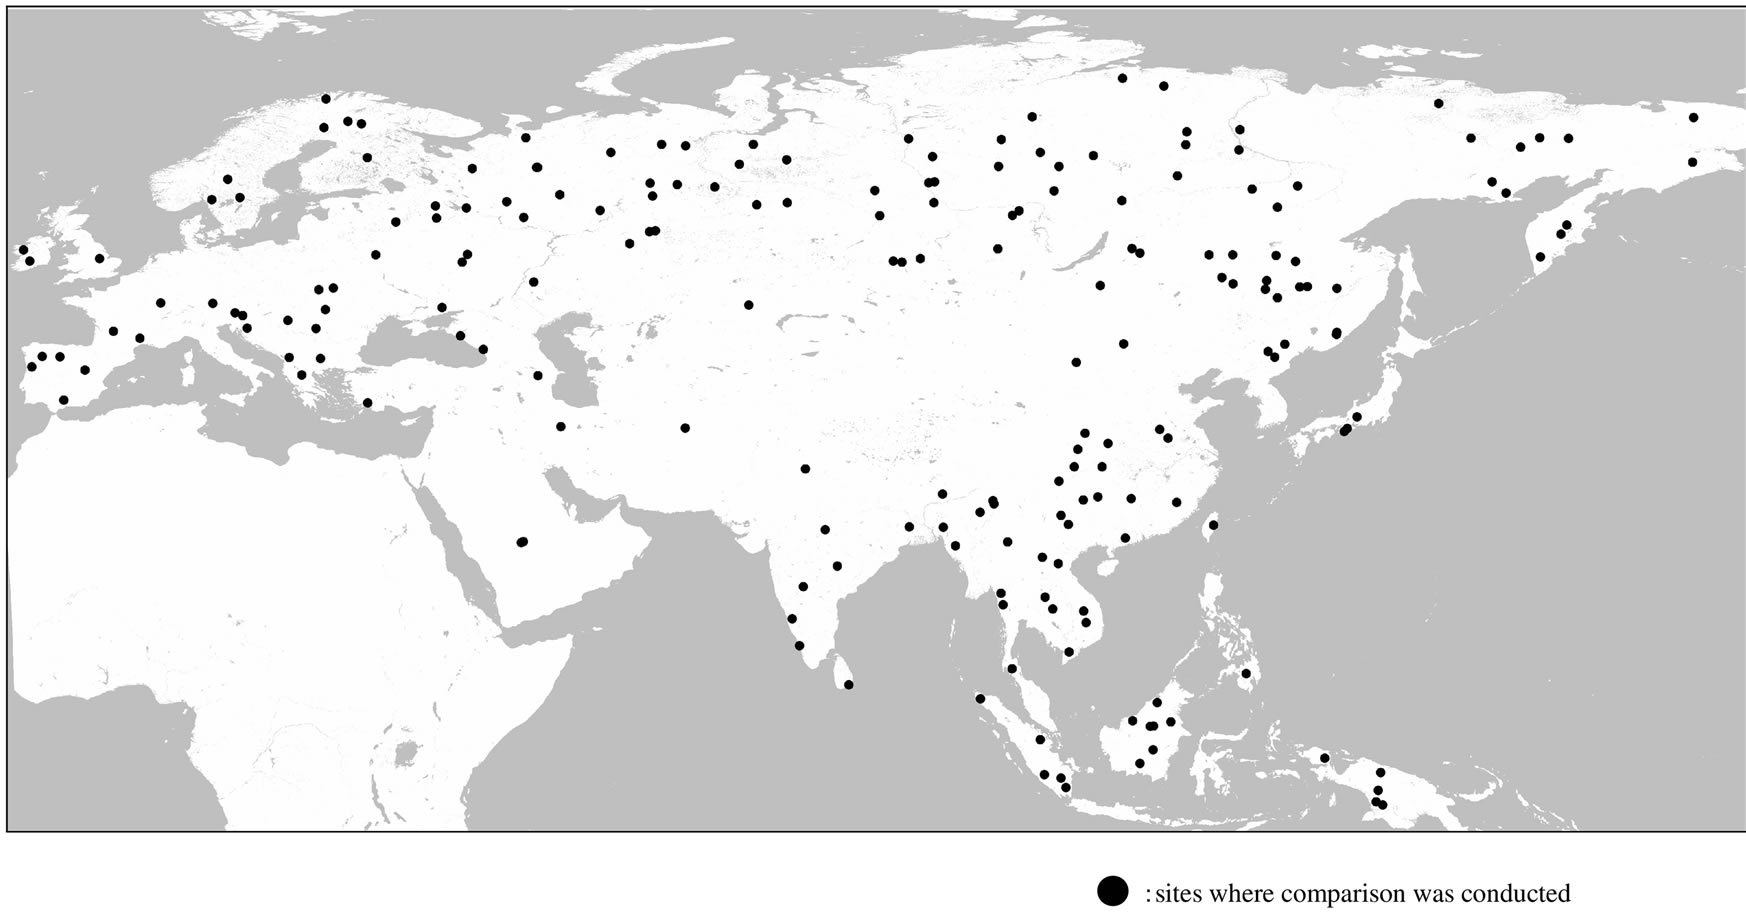
Figure 3. Distribution map of the sites where comparison was made.
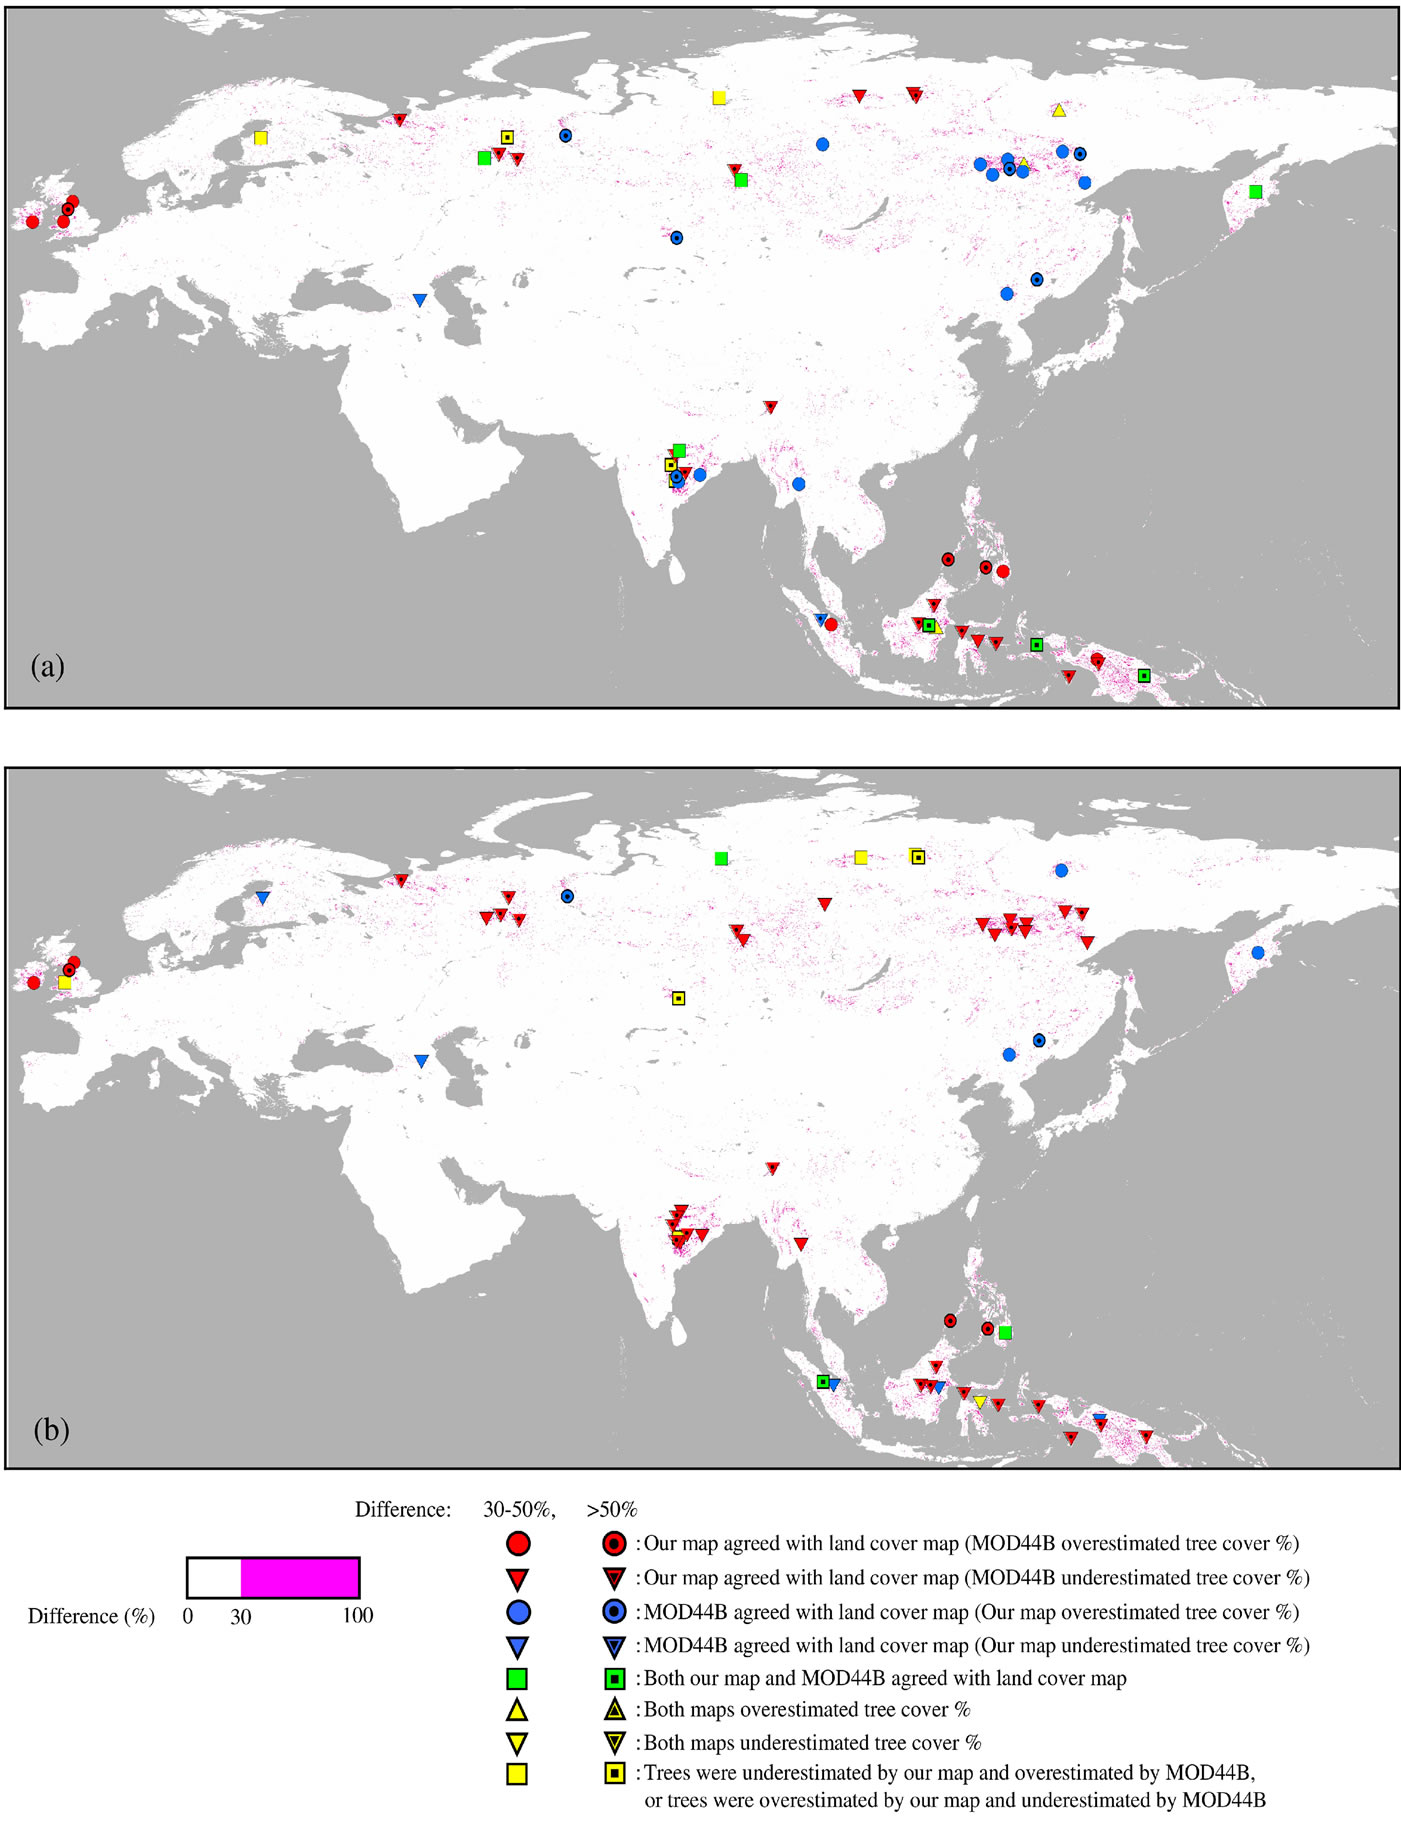
Figure 4. Assessment of percent tree cover maps at sites where the difference between two maps was large, using GlobCover (a) and MODIS V51 (b). 60 sites were randomly sampled.
disagreed with two land cover maps.
For 30 randomly sampled sites where the difference of tree cover percentage between our map and MOD44B was between 30 and 50%, our map agreed and MOD44B disagreed with GlobCover and MODIS V51 at 30% and 53% of the sampled sites, respectively. On the other hand, MOD44B agreed and our map disagreed with land cover maps at 40% (GlobCover) and 27% (MODIS V51) of sampled sites. An interesting characteristic was that our map and MOD44B agreed with different land cover maps at 40% of sites. Our map and MOD44B agreed with both land cover maps at only 20% and 10% of sites, respectively. With respect to the land cover type, 23% of sites were classified as open forests (15% - 40% tree cover) by GlobCover and MOD44B agreed with GlobCover, but MODIS V51 classified the sites as deciduous needle-leaf forests (60% - 100% tree cover) and our map agreed with MODIS V51. 7% of sites were classified as mosaics of forest, cropland and other vegetation by GlobCover and our map agreed with GlobCover, but MODIS V51 classified the sites as forest dominated vegetation and MOD44B agreed with MODIS V51. Mainly, our map overestimated tree cover in open forests classified by GlobCover, and underestimated tree cover in evergreen broadleaf forests classified by MODIS V51. On the other hand, MOD44B overestimated tree cover in herbaceous dominated vegetation and mosaics of cropland and other vegetation classified by GlobCover and in grasslands classified by MODIS V51, and underestimated tree cover in deciduous needle-leaf forests and woody savannas classified by MODIS V51.
We also assessed the sites where MOD44B or our map disagreed with all of the maps using Google Earth and Landsat images, and CLC2006. Our map disagreed with MOD44B, GlobCover and MODIS V51 at 4 sites, and Google Earth and Landsat images were available at 3 sites. Among 3 sites, MOD44B matched more closely the visual interpretation from Google Earth and Landsat images than our map at 2 sites, and both maps did not match them at 1 site. On the other hand, MOD44B disagreed with our map, GlobCover and MODIS V51 at 18 sites, and MOD44B did not match the visual interpretation from Google Earth and Landsat images at all of the sites (8 sites), where Google Earth and Landsat images were available. CLC2006 was available at 3 sites in Europe, where CLC 2006 classified the sites as non-irrigated arable land or mosaics of pastures and non-irrigated arable land. In GlobCover and MODIS V51, the sites were classified as herbaceous vegetation or grasslands, whereas our map and MOD44B estimated the tree cover percentage of the sites as less than 10% and around 50%, respectively.
4.3. Comparison with FRA2010
Area coverage percent of three tree cover strata (0% - 4%, 5% - 10% and 11% - 100%) in 12 countries is shown in Table 4. At the country level, our map and MOD44B were somewhat different from the data reported by FRA2010. The proportion of the pixels with the tree cover between 11% and 100% was significantly higher in our result and MOD44B than in FRA 2010; more than 1.5 times higher at most of the countries. The exception was Afghanistan, where it was higher in FRA2010 (2.1%) than in our map (1.2%) and MOD44B (1.3%). In Afghanistan, more than 95% of pixels were less than 4% tree cover in our map and MOD44B, whereas about 50% of pixels were less than 4% tree cover in FRA2010. There was also the difference between our map and MOD44B. The proportion of pixels with tree cover between 0% and 4% was higher in our map than in MOD44B, especially for Belarus, France and Japan.
5. Discussion
The comparison of the percent tree cover maps with land cover datasets at randomly sampled sites revealed that the agreement score with land cover maps was relatively similar for our map and MOD44B. However, the analysis of land cover types revealed that the possibility existed that croplands in MODIS V51 had some trees, and that our map, MOD44B and MODIS V51 overestimated tree cover at open forests and croplands, and GlobCover mapped some forests as croplands and open forests. More importantly, the possibility exists that trees were not distinguished well from shrubbery in all maps. However, these tendencies may be caused by the difference of definition of “tree”. The minimum height of “tree” was defined as 5 meters in GlobCover, whereas it was defined as 2 meters in MODIS V51. This means shrub lands in GlobCover were classified as forests in MODIS V51 sometimes, and the land covers with shorter trees in our map were classified as shrub lands in GlobCover and shrub lands in MODIS V51 were classified as trees in our map and MOD44B. In addition, orchards and rubber plantations were included in croplands in GlobCover, whereas perennial woody crops were classified as trees or shrubbery in MODIS V51. In our map and MOD44B, all woody vegetations were included in trees if the criterion of tree height met their definition. This means orchards and rubber plantations were not classified as forests in GlobCover, whereas the possibility existed that they were classified as forests in MODIS V51, and that they were classified as trees in our map and MOD44B.
The assessment at sites where the difference between our map and MOD44B was large showed that our map was coincident with either or both of GlobCover and MODIS V51 at 85% of sampled sites. However, the
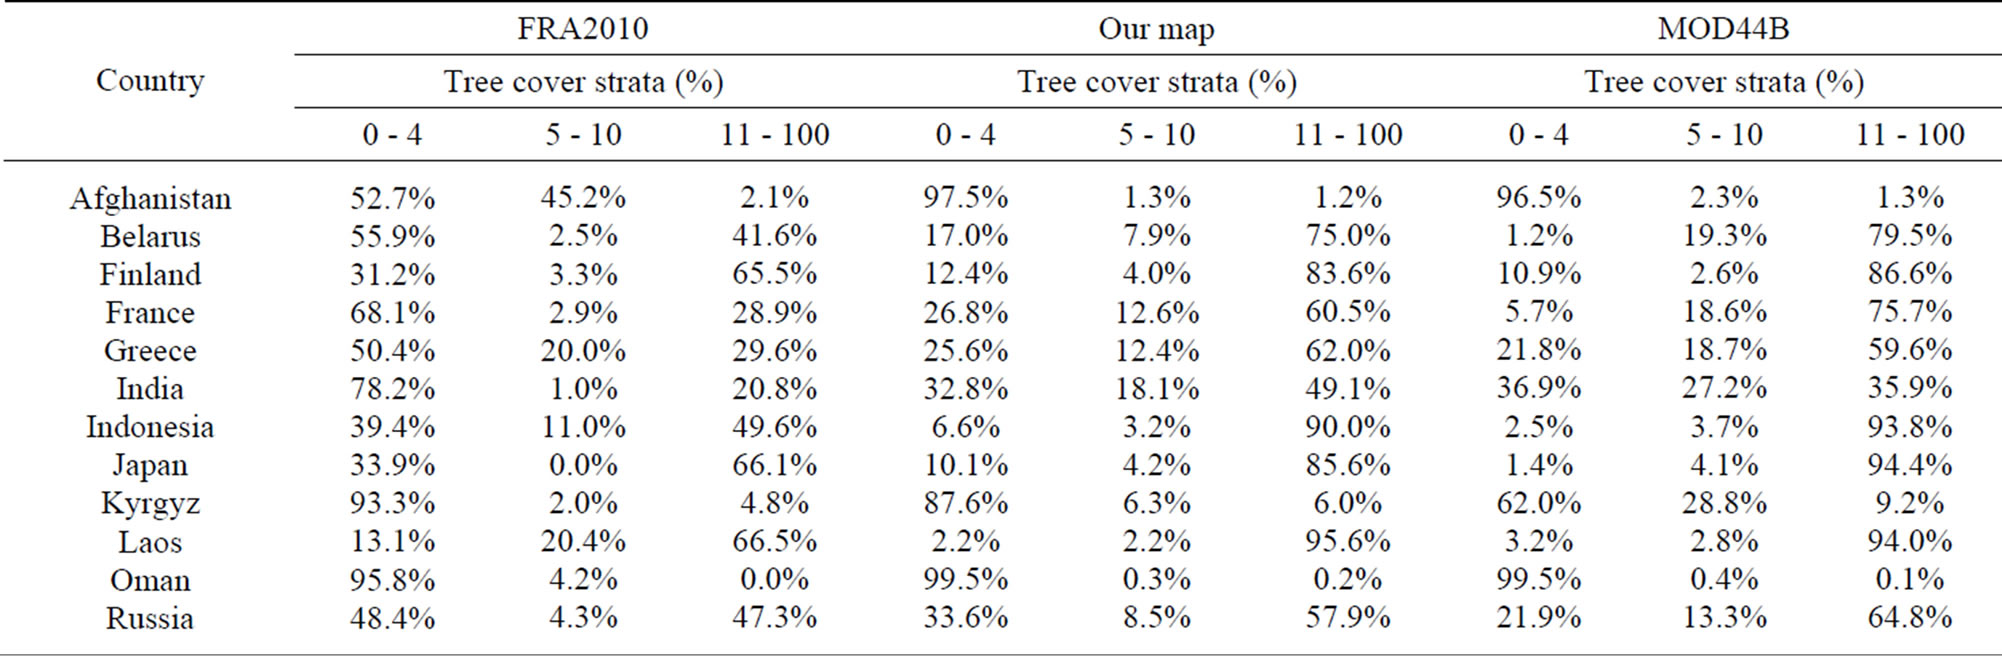
Table 4. Comparison of area coverage percent with the data reported by FRA2010 for tree cover strata. The tree cover percentage was divided by 0.8 in MOD44B.
estimate of tree cover percentage did not agree with other maps at 45% of sampled sites in MOD44B. MOD44B might have underestimated tree cover in forests of Russia, India and Indonesia, and might have overestimated tree cover in herbaceous dominated vegetation of UK and Ireland, and in mosaics of cropland and other vegetation of Philippines. The assessment also revealed that there were sites in Eastern Siberia where MOD44B and GlobCover disagreed with our map and MODIS V51. The sites were mapped as open forests by GlobCover and as deciduous needle-leaf forests by MODIS V51. It is important to assess those sites by collecting ground truth data or accurate reference data. It should be noted that MOD44B used tree canopy cover as the definition of tree cover percentage, whereas our map used tree crown cover.
The country-level assessment by the comparison analysis with FRA2010 revealed that our map and MOD44B were somewhat different from the data reported by FRA 2010. Little difference was also observed between our map and MOD44B. However, the difference also may be caused by the difference of definition of “tree cover”. In FRA2010, trees in land that was predominantly under agricultural or urban land use were not included in forest, whereas these trees were also included in tree cover in tree cover maps. Actually, there are a lot of fruit plantations in the world, and croplands and residential areas have a lot of trees. The tendency for FRA2010 to underestimate tree cover compared to our map and MOD44B may be caused by the difference of definition.
6. Conclusions
Knowing the quality of existing global percent tree cover maps is essential for users of the maps. However, validating percent tree cover maps is limited to some regions or countries because of the difficulty of obtaining reference data or field data, and sampling method affects estimates of map accuracy.
In this study, we assessed MOD44B and our new percent tree cover map by comparing with existing global categorical land cover datasets at randomly sampled sites, and FRA2010 at 12 countries. There was not so much difference in agreement score between our map and MOD44B at randomly sampled sites. However, MOD44B disagreed with our map, GlobCover and MODIS V51 at about half of the sites where the difference of tree cover percentage between our map and MOD44B was greater than 50%. Those sites were concentrated mainly in forests of Russia, India and Indonesia, and in herbaceous dominated vegetation of UK and Ireland. At those sites, the possibility is high so that MOD44B could not estimate tree cover percentage correctly, although MOD44B has the advantage of higher resolution compared to our map. Our map can be substituted for existing percent tree cover products, and the user of MOD44B can also modify it using our map.
7. Acknowledgements
This work was supported by JSPS KAKENHI (22220011). This study was partially supported by Geospatial Information Authority of Japan (GSI). The authors especially thank students Xuehua Chen, Zhong Kai Cheng, Xianmixinuer Kelimu, Ying Li, Xiaolin Wei and Naijia Zhang for spending much valuable time interpreting Google Earth images and producing reference data. The authors also thank Rokhmatuloh for teaching us basic concepts and how to use some software, Nguyen Thanh Hoan and Nehal Soliman for contributing valuable comments and discussions, and Bayan Alsaaideh and Kalibinuer Yishamiding for helping to interpret highresolution images.
REFERENCES
- FAO (Food and Agriculture Organization of the United Nations), “Forest Resources Assessment Programme Working Paper 33: FRA 2000 on Definitions of Forest and Forest Change,” FAO, Rome, 2000.
- FAO (Food and Agriculture Organization of the United Nations), “Global Forest Resources Assessment 2000 Main Report,” FAO, Rome, 2001.
- R. S. DeFries, M. C. Hansen and J. R. G. Townshend, “Global Continuous Fields of Vegetation Characteristics: a Linear Mixture Model Applied to Multi-Year 8 km AVHRR Data,” International Journal of Remote Sensing, Vol. 21, No. 6-7, 2000, pp. 1389-1414. http://dx.doi.org/10.1080/014311600210236
- R. S. DeFries, M. C. Hansen, J. R. G. Townshend, A. C. Janetos and T. R. Loveland, “A New Global 1-km Dataset of Percentage Tree Cover Derived from Remote Sensing,” Global Change Biology, Vol. 6, No. 2, 2000, pp. 247-254. http://dx.doi.org/10.1046/j.1365-2486.2000.00296.x
- M. C. Hansen, R. S. DeFries, J. R. G. Townshend, M. Carroll, C. Dimiceli and R. A. Sohlberg, “Global Percent Tree Cover at a Spatial Resolution of 500 Meters: First Results of the MODIS Vegetation Continuous Fields Algorithm,” Earth Interactions, Vol. 7, No. 10, 2003, pp. 1- 15. http://dx.doi.org/10.1175/1087-3562(2003)007<0001:GPTCAA>2.0.CO;2
- Rokhmatuloh, D. Nitto, H. Al-Bilbisi, K. Arihara and R. Tateishi, “Estimating Percent of Tree Cover Using Regression Tree Method with Very-High-Resolution QuickBird Images as Training Data,” Journal of the Remote Sensing Society of Japan, Vol. 27, No. 1, 2007, pp. 1-12.
- R. Rokhmatuloh, R. Tateishi, H. Al-Bilbisi, K. Arihara, T. Kobayashi, D. Nitto, et al., “Global Percent Tree Cover Mapping Using Regression Tree Method: An Advantage of QuickBird Images as Training Data,” Asian Journal of Geoinformatics, Vol. 10, No. 2, 2010, pp. 21-28.
- Geospatial Information Authority of Japan, Chiba University and Collaborating Organizations, “Global Map— Global Land Cover (GLCNMO), Global Map—Percent Tree Cover [Dataset],” 2008. http://www.iscgm.org/login.html
- S. Berberoglu, O. Satir and P. M. Atkinson, “Mapping Percentage Tree Cover from Envisat MERIS Data Using Linear and Nonlinear Techniques,” International Journal of Remote Sensing, Vol. 30, No. 18, 2009, pp. 4747-4766. http://dx.doi.org/10.1080/01431160802660554
- J. Heiskanen and S. Kivinen, “Assessment of Multispectral, -Temporal and -Angular MODIS Data for Tree Cover Mapping in the Tundra-Taiga Transition Zone,” Remote Sensing of Environment, Vol. 112, No. 5, 2008, pp. 2367- 2380. http://dx.doi.org/10.1016/j.rse.2007.11.002
- M. Schwarz and N. E. Zimmermann, “A New GLMBased Method for Mapping Tree Cover Continuous Fields Using Regional MODIS Reflectance Data,” Remote Sensing of Environment, Vol. 95, No. 4, 2005, pp. 428-443. http://dx.doi.org/10.1016/j.rse.2004.12.010
- M. C. Hansen, R. S. DeFries, J. R. G. Townshend, L. Marufu and R. Sohlberg, “Development of MODIS Tree Cover Validation Data Set for Western Province, Zambia,” Remote Sensing of Environment, Vol. 83, No. 1-2, 2002, pp. 320-335. http://dx.doi.org/10.1016/S0034-4257(02)00080-9
- M. C. Hansen, R. S. DeFries, J. R. G. Townshend, R. Sohlberg, C. Dimiceli and M. Carroll, “Towards an Operational MODIS Continuous Field of Percent Tree Cover Algorithm: Examples Using AVHRR and MODIS Data,” Remote Sensing of Environment, Vol. 83, No. 1-2, 2002, pp. 303-319. http://dx.doi.org/10.1016/S0034-4257(02)00079-2
- M. A. White, J. D. Shaw and R. D. Ramsey, “Accuracy Assessment of the Vegetation Continuous Field Tree Cover Product Using 3954 Ground Plots in the SouthWestern USA,” International Journal of Remote Sensing, Vol. 26, No. 12, 2005, pp. 2699-2704. http://dx.doi.org/10.1080/01431160500080626
- F. S. Cardozo, Y. E. Shimabukuro, G. Pereira and F. B. Silva, “Using Remote Sensing Products for Environmental Analysis in South America,” Remote Sensing, Vol. 3, No. 10, 2011, pp. 2110-2127. http://dx.doi.org/10.3390/rs3102110
- M. A. Lefsky, “A Global Forest Canopy Height Map from the Moderate Resolution Imaging Spectroradiometer and the Geoscience Laser Altimeter System,” Geophysical Research Letters, Vol. 37, No. 15, 2010, Article ID: L15401. http://dx.doi.org/10.1029/2010GL043622
- J. Heiskanen, “Evaluation of Global Land Cover Data Sets over the Tundra-Taiga Transition Zone in Northernmost Finland,” International Journal of Remote Sensing, Vol. 29, No. 13, 2008, pp. 3727-3751. http://dx.doi.org/10.1080/01431160701871104
- P. M. Montesano, R. Nelson, G. Sun, H. Margolis, A. Kerber and K. J. Ranson, “MODIS Tree Cover Validation for the Circumpolar Taiga-Tundra Transition Zone,” Remote Sensing of Environment, Vol. 113, No. 10, 2009, pp. 2130-2141. http://dx.doi.org/10.1016/j.rse.2009.05.021
- O. Arino, P. Bicheron, F. Achard, J. Latham, R. Witt and J. L. Weber, “GLOBCOVER: The Most Detailed Portrait of Earth,” European Space Agency Bulletin, Vol. 136, 2008, pp. 24-31.
- M. A. Friedl, D. Sulla-Menashe, B. Tan, A. Schneider, N. Ramankutty, A. Sibley, et al., “MODIS Collection 5 Global Land Cover: Algorithm Refinements and Characterization of New Datasets,” Remote Sensing of Environment, Vol. 114, No. 1, 2010, pp. 168-182. http://dx.doi.org/10.1016/j.rse.2009.08.016
- M. Herold, P. Mayaux, C. E. Woodcock, A. Baccini and C. Shmullius, “Some Challenges in Global Land Cover Mapping: An Assessment of Agreement and Accuracy in Existing 1 km Datasets,” Remote Sensing of Environment, Vol. 112, No. 5, 2008, pp. 2538-2556. http://dx.doi.org/10.1016/j.rse.2007.11.013
- D. Pflugmacher, O. N. Krankina, W. B. Cohen, M. A. Friedl, D. Sulla-Menashe, R. E. Kennedy, et al., “Comparison and Assessment of Coarse Resolution Land Cover Maps for Northern Eurasia,” Remote Sensing of Environment, Vol. 115, No. 12, 2011, pp. 3539-3553. http://dx.doi.org/10.1016/j.rse.2011.08.016
- T. Kobayashi, J. Tsend-Ayush and R. Tateishi, “A New Tree Cover Percentage Map in Eurasia at 500m Resolution Using MODIS Data,” Remote Sensing. (unpublished)
- M. C. Hansen, R. S. DeFries, J. R. G. Townshend, M. Carroll, C. Dimiceli and R. A. Sohlberg, “Vegetation Continuous Fields MOD44B, 2008 Percent Tree Cover, Collection 5 [Dataset],” 2011. http://www.glcf.umd.edu/data/vcf/
- FAO (Food and Agriculture Organization of the United Nations), “Global Forest Resources Assessment 2010,” 2010. http://www.fao.org/forestry/fra/fra2010/en/
- International Steering Committee for Global Mapping, “ISCGM Website,” 2013. http://www.iscgm.org/cgi-bin/fswiki/wiki.cgi
- N. T. Hoan, R. Tateishi and H. Al-Bilbisi, “Global MODIS 2008 Data User’s Manual,” Chiba University, Chiba, 2011.
- C. B. Schaaf, F. Gao, A. H. Strahler, W. Lucht, X. Li, T. Tsang, et al., “First Operational BRDF, Albedo Nadir Reflectance Products from MODIS,” Remote Sensing of Environment, Vol. 83, No. 1-2, 2002, pp. 135-148. http://dx.doi.org/10.1016/S0034-4257(02)00091-3
- C. Schaaf, “MODIS BRDF/Albedo Product (MCD43) User’s Guide,” 2004. http://www-modis.bu.edu/brdf/userguide/intro.html
- C. Schaaf, J. Liu, F. Gao, Z. Jiao, Y. Shuai and A. Strahler, “Collection 005 Change Summary for MODIS BRDF/Albedo (MCD43) Algorithms,” n.d. http://landweb.nascom.nasa.gov/QA_WWW/forPage/C005_Change_BRDF.pdf
- FAO (Food and Agriculture Organization of the United Nations), “Global Forest Resources Assessment Update 2005: Terms and definitions,” FAO, Rome, 2004.
- European Space Agency (ESA) and Université catholique de Louvain (UCL), “GLOBCOVER 2009 Product Description and Validation Report,” 2011. http://due.esrin.esa.int/globcover/
- A. Di Gregorio and L. J. M. Jansen, “Land Cover Classification System: Classification Concepts and User Manual,” FAO, Rome, 2000.
- European Space Agency (ESA) and the ESA GlobCover Project, led by MEDIAS-France, “GlobCover Land Cover V2.3 Product,” 2010. http://due.esrin.esa.int/globcover/
- NASA Land Processes Distributed Active Archive Center (LP DAAC), USGS/Earth Resources Observation and Science (EROS) Center, “MODIS Collection 5.1 Land Cover Type Product for 2008 [Dataset],” 2012. http://reverb.echo.nasa.gov/
- T. R. Loveland and A. S. Belward, “The IGBP-DIS Global 1 km Land Cover Data Set, DISCover: First Results,” International Journal of Remote Sensing, Vol. 18, No. 15, 1997, pp. 3291-3295. http://dx.doi.org/10.1080/014311697217099
- M. A. Friedl, D. K. McIver, J. C. F. Hodges, X. Y. Zhang, D. Muchoney, A. H. Strahler, et al., “Global Land Cover Mapping from MODIS: Algorithms and Early Results,” Remote Sensing of Environment, Vol. 83, No. 1-2, 2002, pp. 287-302. http://dx.doi.org/10.1080/014311697217099
- M. L. Clark, T. M. Aide, H. R. Grau and G. Riner, “A Scalable Approach to Mapping Annual Land Cover at 250 m Using MODIS Time Series Data: A Case Study in the Dry Chaco Ecoregion of South America,” Remote Sensing of Environment, Vol. 114, No.11, 2010, pp. 2816-2832. http://dx.doi.org/10.1016/j.rse.2010.07.001
- M. C. Peel, B. L. Finlayson and T. A. McMahon, “Updated World Map of the Koppen-Geiger Climate Classification,” Hydrology and Earth System Sciences, Vol. 11, No. 5, 2007, pp. 1633-1644. http://dx.doi.org/10.5194/hess-11-1633-2007