American Journal of Plant Sciences
Vol.5 No.5(2014), Article ID:43615,11 pages DOI:10.4236/ajps.2014.55072
Development of a Rapid and Efficient Liquid Chromatography Method for Determination of Gibberellin A4 in Plant Tissue, with Solid Phase Extraction for Purification and Quantification
Julia Medrano Macías1, Rahim Foroughbakhch Pournavab2, Manuel Humberto Reyes-Valdés3, Adalberto Benavides-Mendoza1*
1Departamento de Horticultura, Universidad Autónoma Agraria Antonio Narro, Saltillo, México
2Facultad de Ciencias Biológicas, Universidad Autónoma de Nuevo León, San Nicolás de los Garza, México
3Departamento de Fitomejoramiento, Universidad Autónoma Agraria Antonio Narro, Saltillo, México
Email: *abenmen@uaaan.mx
Copyright © 2014 by authors and Scientific Research Publishing Inc.
This work is licensed under the Creative Commons Attribution International License (CC BY).
http://creativecommons.org/licenses/by/4.0/


Received 28 December 2013; revised 29 January 2014; accepted 11 February 2014
ABSTRACT
A new, rapid and efficient reverse phase Liquid Chromatography (RP-LC) method was developed for determination of Gibberellin A4 (GA4) in samples of flower stalk of Dasylirion cedrosanum and vegetative tissue of Epithelantha micromeris. Purification of GA4 was carried out by solid phase extraction (SPE), in Epithelantha micromeris. In the chromatography method was obtaining a retention time of 2.1 min, using Hypersil GOLD C-18 column (100 × 4.6 mm dim and size particle 5 µ), mobile phase 50/50 acetonitrile/water and a flow 1.0 ml/min. Detection was carried out by a UV detector set at 205 nm, and a quantization limit of 0.4 mg/L. The obtained correlation coefficient was 0.995.
Keywords:Dasyrilon cedrosanum; Epithelantha micromeris; Phytohormone Separation; Plant Growth Regulators; Reverse Phase Liquid Chromatography; Solid Phase Extraction

1. Introduction
Gibberellins are an important group of isoprenoid phytohormones that occur in small amounts in higher plants. They are involved in the development and regulation of different growth processes throughout the life-cycle of plants; each gibberellin (GA) affects a different part of the plants. To date, 136 GAs have been identified in plants, fungi and bacteria [1] [2] but only a few of them possess biological activity. The most important bioactive gibberellins are GA1, GA3, GA4 and GA7 [3] . Many of the other GAs are biosynthetic intermediates or catabolites of bioactive GAs [4] which belong to the group of ‘‘C19 gibberellins” [5] .
Numerous reports have shown gibberellins (GAs) play a role in the growth, development and sexual differentiation processes of different plant species [6] . The quantitative analysis of gibberellins in plant tissues is difficult because these phytohormones are present in low concentrations and the tissues are very rich in interfering substances, especially secondary metabolites [7] [8] In studies made in Satika spruce (Picea stichenis), it was concluded that the separation of GA4 in particular was not achieved; therefore, quantification was not done properly, probably due to a combination of low GA4 and a high amount of interfering substances such as resin acids [9] .
Other works have reported that production of GA4 is available commercially only in mixture form, as is difficult and uneconomic to separate gibberellins from each other [10] . The mixture GA4+GA7 has shown good results [1] [11] -[13] . However, in the last few years there has been increased commercial interest in the production and separation of GA4 and GA7 due to their horticultural uses. In 2010, Lale and Garde developed a HPLC technique with the purpose of achieving separation and quantification of GA4; however, it was still necessary to confirm by Liquid ChromatographyMass Spectrometry (LC-MS) technique.
Due to the above, determination of GAs in plant tissues is a real challenge that requires careful optimization of sample preparation conditions prior to Liquid Chromatography (LC) analysis. Solid phase extraction (SPE) with reverse phase C-18 cartridge is the most commonly used technique for sample pre-concentration and clean up [14] . Many chromatography techniques have been developed for the analysis of gibberellins with instruments, such as high performance liquid chromatography (HPLC) [1] [15] -[18] , LC-MS [19] [20] and gas chromatography-mass spectroscopy (GC-MS) [7] [9] [21] [22] However, as not all laboratories have these instruments; it is still necessary to develop more simple and less expensive methods that enable the easy detection of phytohormones.
Gibberellins have been quantitatively analyzed in several species [7] [9] [19] [20] [23] -[26] however, a reliable quantification in Dasylirion cedrosanum tissue has not been reported. This work will serve for the further analysis of GA4 levels in Dasylirion cedrosanum at different sexual stages and vegetative tissues of Epithelantha micromeris. The solid phase extraction (SPE) technique used in Epithelantha micromeris for separation and purification can be used in samples of Dasylirion cedrosanum, if necessary.
Thus, the objective of this work was to develop a rapid and efficient method for the determination of gibberellin A4 by liquid chromatography, processing the vegetal sample by solid phase extraction for purification and concentration of GA4.
2. Materials and Methods
2.1. Instruments
The chromatograph used was a Spectra System Thermo Scientific equipped with solvent degasser (SCM 1000), a quaternary pump (P4000) coupled to a manual injector with a 20 µl fixed loop, VWD Ultra violet detector (UV 1000) and reverse phase Hypersil GOLD C-18 column (100 × 4.6 mm dim and size particle 5 µ).
SPE—the solid phase extraction system with vacuum manifolds was purchased from Phenomenex, includes functionalized polymeric Strata C-18 E in syringe tubes with a sorbent mass of 50 mg and a 3 ml solvent capacity.
2.1.1. Reagents and Standard
Standard grade Gibberellin A4 (purity ≥ 90%) was purchased from Sigma-Aldrich; the solvents methanol, acetonitrile and water were of HPLC-grade (TEDIA), and were also filtered through a 0.45 µ membrane filter (Millipore)
Two mobile phases were used: phase A was water, phase B was acetonitrile mixed in isocratic proportion 50-50.
2.2. Procedures
2.2.1. Chromatographic Conditions
The identification of GA4 was achieved using a C-18 reverse phase column and an isocratic mobile phase for A/B proportion of 50-50 at a flow rate of 1.0 mL/min; the wavelength was set at 205 nm. Each mobile phase was filtered through a 0.45 µm membrane filter in a Wheaton system and sonicated for 5 min.
2.2.2. Calibration Curve
A stock standard solution was prepared by dissolving accurately 5 mg of standard Gibberellin A4 in 25 mL of methanol 80%, obtaining a concentration of 200 mg/L.
The stock solution was diluted in order to obtain working standard solutions in a concentration range of 0.4 - 1.2 mg/L. Each working solution was filtered with a 0.45 µm syringe filter and sonicated for 5 min afterwards, 20 µL of each solution it were injected manually in the loop. The calibration curve plotted the peak area (y axis) versus the standard concentration of GA4 (x axis), obtaining a linear regression equation. The unknown concentrations of the samples were obtained from this linear regression equation.
2.2.3. Sample Preparation
In this work, two different plant tissues were evaluated; the first was taken from a sexually undifferentiated inflorescence of Dasylirion cedrosanum after it had been stored at −20˚C for at least two months. The Dasylirion cedrosanum samples were treated in two different ways: some samples were processed fresh, and others were subjected to drying in an oven at a controlled temperature of 45˚C for 24, 48 and 72 hours.
About 1 gr. of each sample was frozen with liquid nitrogen and macerated with a pestle until a fine powder was obtained. 50 mg of powder were accurately weighed with a calibration analytical balance and placed in eppendorf tubes; 1.0 mL methanol 80% was then added for the first extraction; the mixture was put in a vortex mixer for 30 seconds and was then placed in a sonicator for 5 min. Immediately afterwards the samples were centrifuged at 13,000 rpm for 10 min. The supernatant was removed with a pipette and leaked into another eppendorf tube; the first extraction was then performed. Subsequently, second and third extractions were performed on the same pellet, but adding only 0.5 ml. ultimately, we had three supernatants, one for each extraction. These extracts were filtered with a 0.45 µm syringe filter, sonicated for 3 min by degassing, and were then ready for injection in RP-LC.
The Epithelantha micromeris samples were lyophilized and the extractions process was carried out as mentioned above, but these samples were subjected to a purification process by solid phase separation (SPE); seven fractions were processed as follows: one C-18 cartridge was placed in a vacuum manifold and was activated with 1ml methanol 100%; in the second fraction 250 µL of sample + 1 mL acetonitrile was added; in third fraction one more milliliter was added; in the fourth and fifth fraction 1 mL methanol-acetonitrile 50:50 was added to each fraction, and in the sixth and seventh fraction 1 mL methanol was added to each fraction.
Each fraction was filtered with a 0.45 µm syringe filter, sonicated for 5 min and injected in RP-LC. According to the results obtained, it was necessary to dilute some samples at about the concentration range of the calibration curve
3. Results and Discussion
3.1. Calibration Curve
In the Ga4 calibration curve plotted was obtained a desirable linearity 0.995. The detection limit of GA4 reached was 0.4 mg/L (Figure 1). This is appropriate to achieve a good GA4 quantification in plant tissue.
3.2. Fresh Samples of Dasylirion cedrosanum
The results of three re-extractions of GA4 from fresh samples of Dasylirion cedrosanum are shown in Figure 2. The GA4 peak is below the limit of quantification of the calibration curve; therefore, it could not be determined,
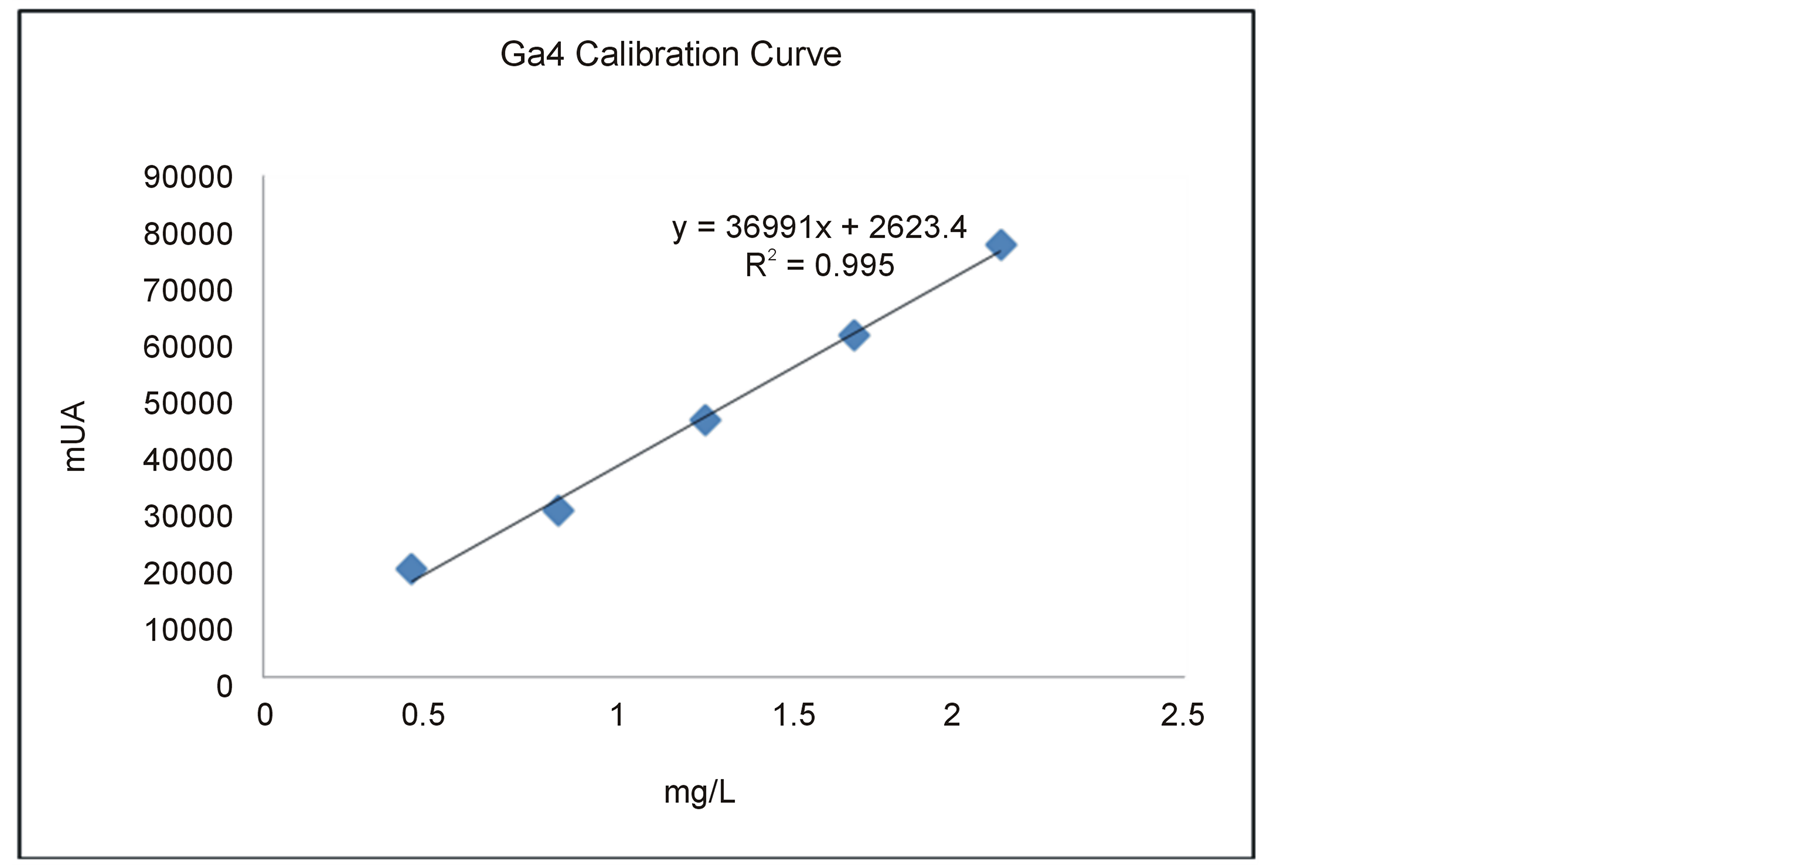
Figure 1. Calibration curve of GA4 obtained by liquid chromatography.
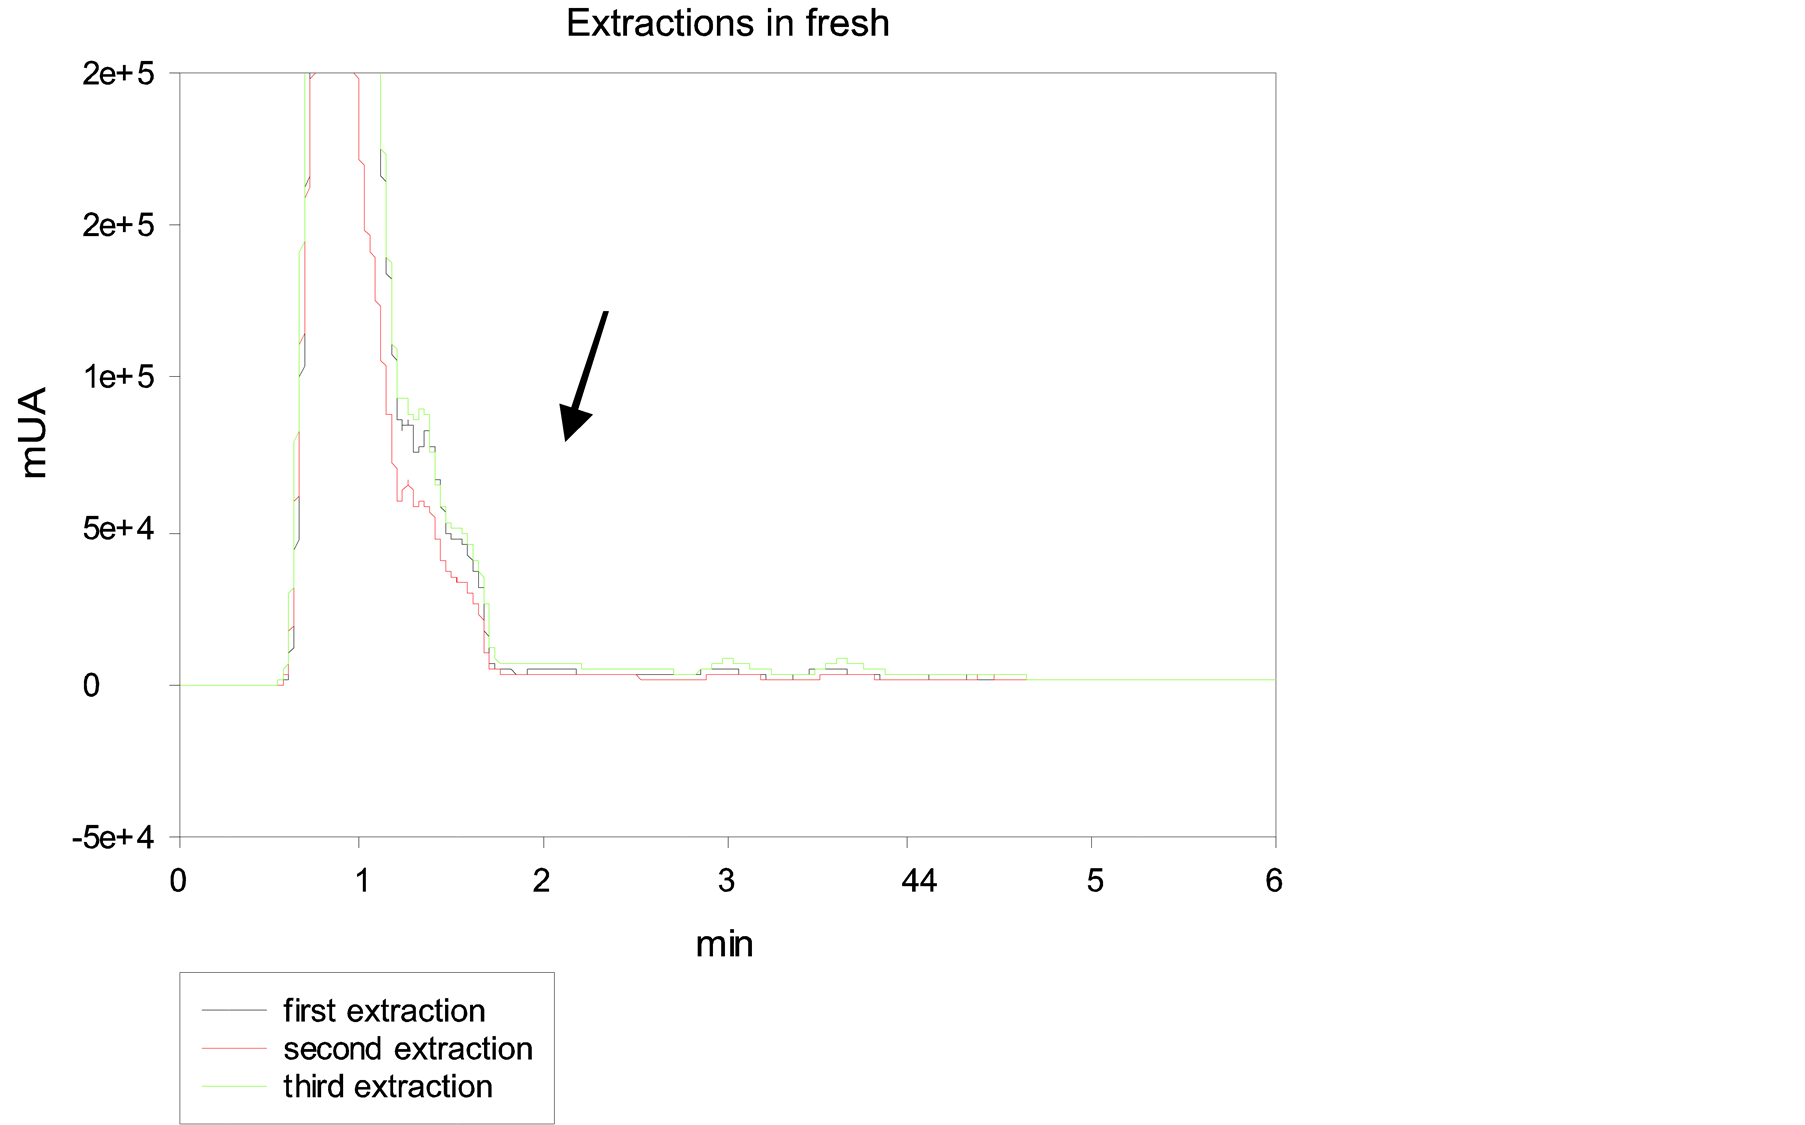
Figure 2. Chromatogram of three GA4 extractions in fresh tissue of Dasyliron cedrosanum. Black line indicates first extraction, red line represented second extraction and green line third extraction. The black arrow indicates the time retention of GA4.
may be due to the low concentration of gibberellin A4 and the interfering substances present in the fresh tissue [1] [2] [9] . In order to achieve the concentration of gibberellin and a good peak separation, the sample was subjected to drying in oven.
The drying process was carried out in an oven for 24, 48 and 72 hours at a controlled temperature of 45˚C; the results are shown in Table 1. After 24 hours of drying, there was a weight loss of 73.4%, mostly from the humidity in the flowering scape of the Dasyliron sample; there was a no great difference after 48 hours of drying; however, after 72 hours there was a weight loss of 83.55%. The temperature of the drying process was kept constant, in order to avoid the molecular decomposition of gibberellins, which consists in a lactone ring [5]
3.3. Dry Samples of Dasylirion cedrosanum
3.3.1. Extraction of GA4 after 24 Hours of Drying
Regarding the results obtained from samples of Dasylirion cedrosanum after 24 hours of drying in the first, second and third extraction (Figure 3), the higher concentration of GA4 was obtained in the second extraction; however, as is shown in that figure, in the third extraction a lower concentration (but still a quantifiable amount) of GA4 was obtained than in the second one, which indicates, in contrast with other works [27] , that one re-extraction of the pellet is not enough to obtain the total content of gibberellin.
3.3.2. Extraction of GA4 after 48 Hours of Drying
After 48 hours of drying, total the content of gibberellin A4 was obtained in the second re-extraction (Figure 4).
3.3.3. Extraction of GA4 after 72 Hours of Drying
After 72 hours of drying, total the content of gibberellin A4 was obtained in the third re-extraction (Figure 5).
It was observed that the largest quantity of GA4 was extracted from the dried tissue after 48 hours of drying, maybe due to the fact that the plant tissue still retained liquid after 24 hours of drying, and that the solubilized phytohormone was divided into two fractions.
A molecular decomposition probably occurred in the extractions of GA4 after 72 hours of drying and, conesquently, it was not separated by the RP-LC (see Figures 6 and 7).

Table 1. Weight lost after drying process in three times.
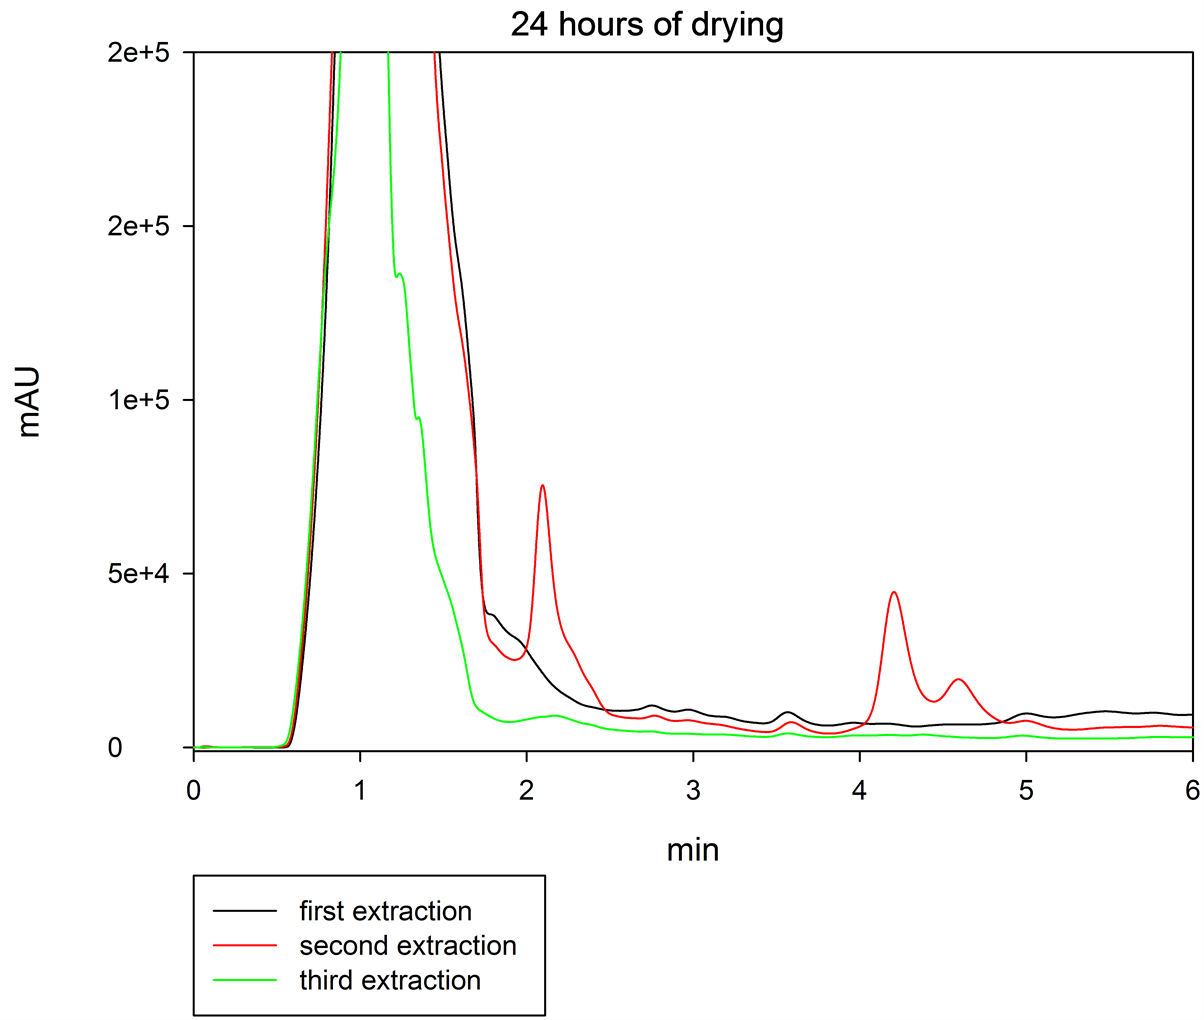
Figure 3. Chromatogram of three extractions of GA4 at 24 hours of drying, in tissue of Dasylirion cedrosanum. Black line indicates first extraction, red line represented second extraction and green line third extraction. The black arrow indicates the peak of GA4.
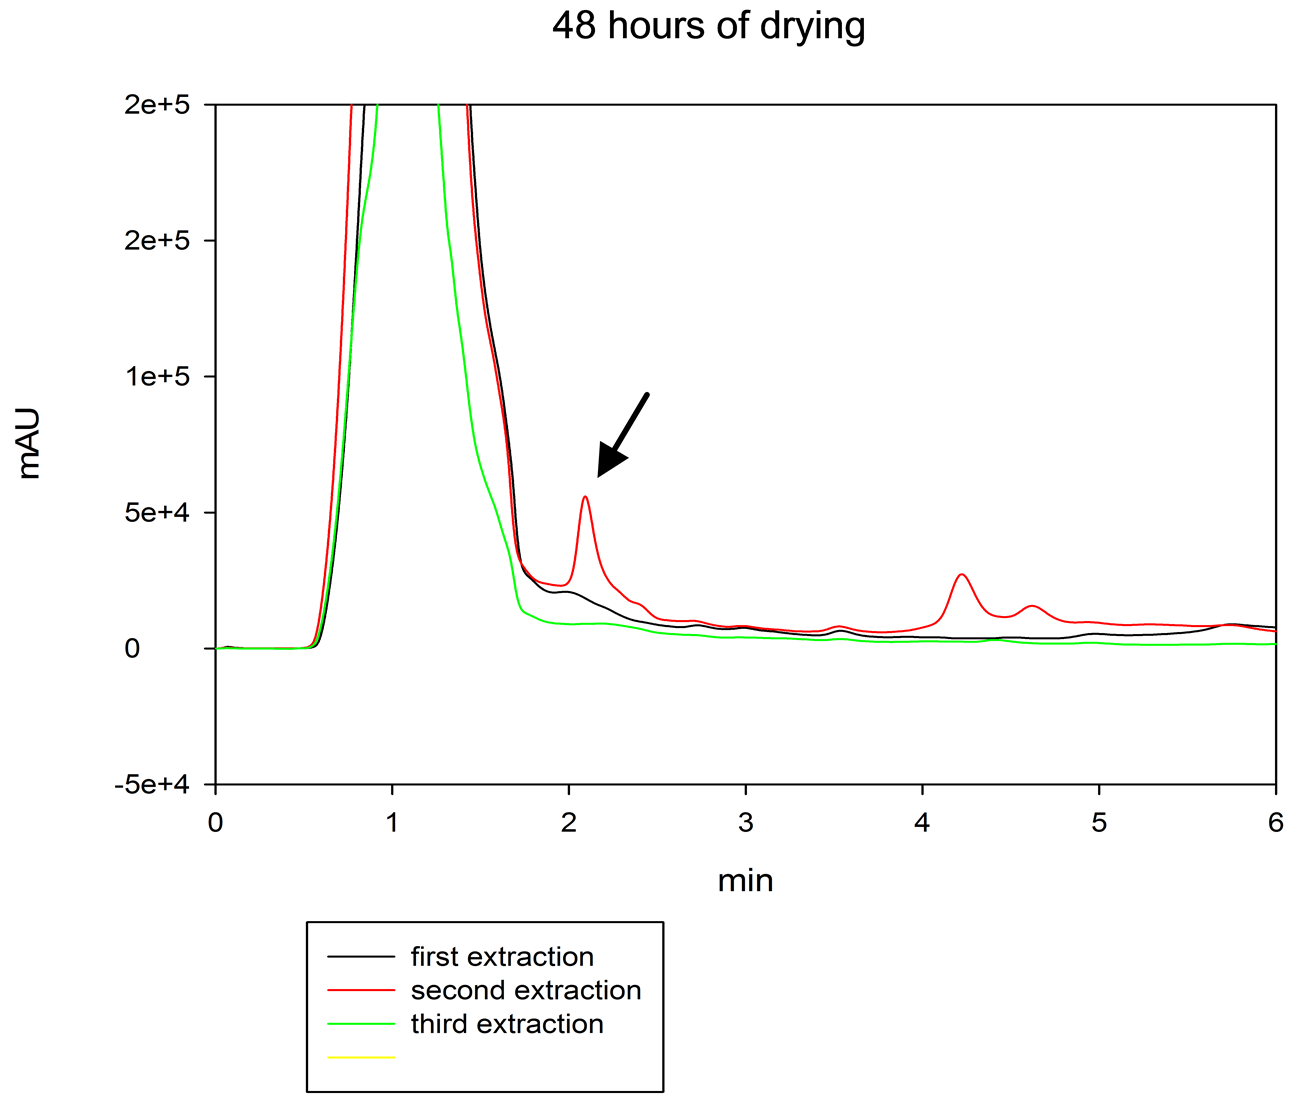
Figure 4. Chromatogram of three extractions of GA4 at 48 hours of drying, in tissue of Dasylirion cesdrosanum. Black line indicates first extraction, red line represented second extraction and green line third extraction. The black arrow indicates the peak of GA4.

Figure 5. Chromatogram of three extractions of GA4 at 72 hours of drying, in tissue of Dasylirion cesdrosanum. Black line indicates first extraction, red line represented second extraction and green line third extraction. The black arrow indicates the peak of GA4.
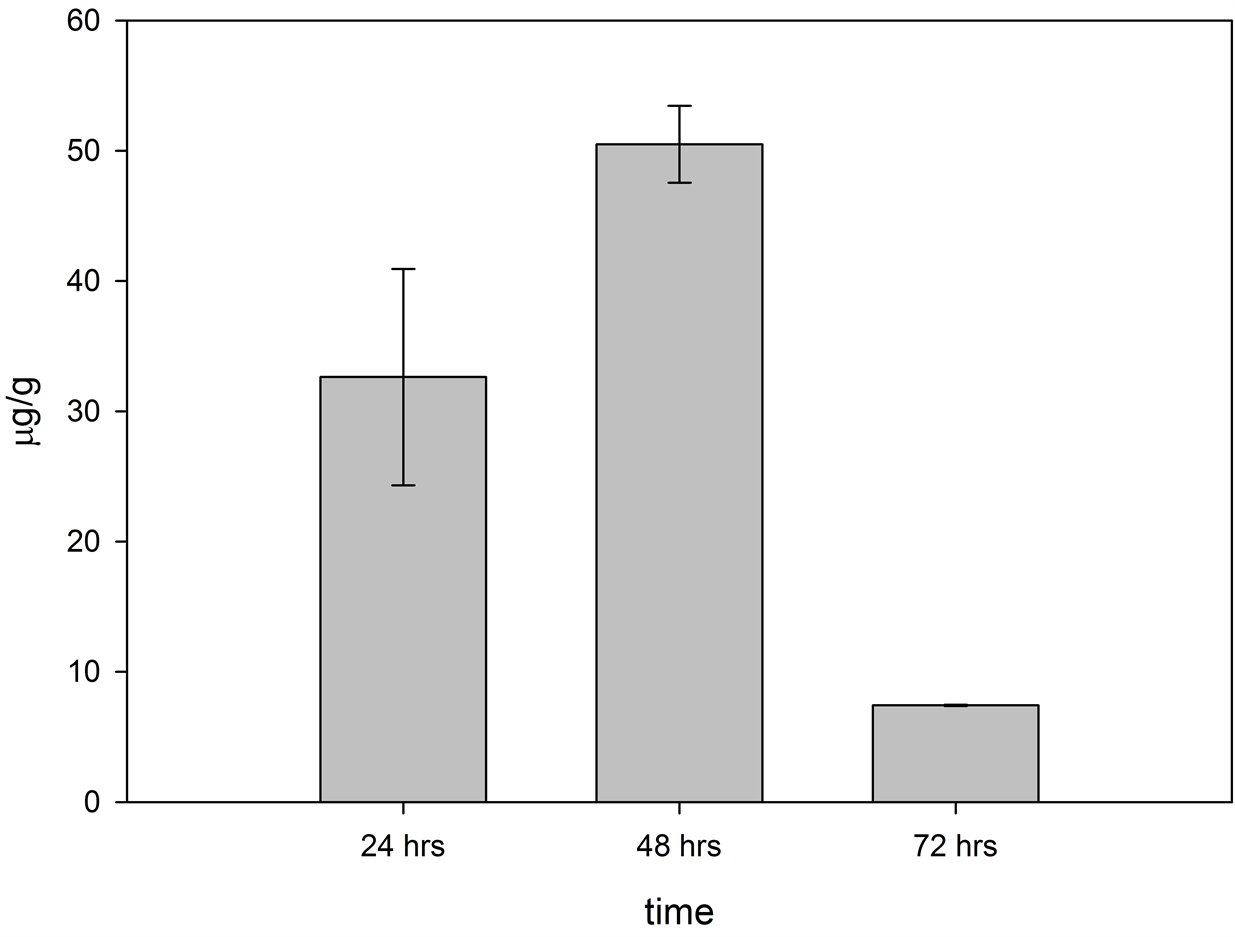
Figure 6. Compilation of the results of the total content of gibberellin A4 extracted after each of the three drying times in tissue of Dasylirion cedrosanum.

Figure 7. Comparison of GA4 content of each extraction after the three drying times: 24 hs, 48 hs and 78 hs, and the amount of GA4 obtained in each extraction in tissue of Dasyliron cedrosanum.
3.4. Dry Samples of Epithelantha micromeris
In another experiment with Epithelantha micromeris tissue, although the sample was dried by lyophilization the GA4 peak was not separated, as shown in Figure 8. May be because the retention time was so short, the separation between GA4 and other similar molecules was not achieved. For this reason, it was necessary to use a separation and concentration technique such as solid phase extraction. This technique offers enhanced recovery, greater speciation, and reduces solvent and sample consumption compared to other techniques [28]
The separation of GA4 was obtained in fractions 6 (Figure 9) and 7 (Figure 10), using methanol 100% as a carrier. The results likely are due to the chemical characteristics of GA4, as it is a less polar gibberellin [9] [29]

Figure 8. Chromatogram of first extraction in lyophilized tissue of Epithelantha micromeris, the black arrow indicates the retention time of GA4. In this sample the GA4 is below of quantization limit. Extraction from lyophilized samples.

Figure 9. Chromatogram of fraction 6 obtained by SPE in lyophilized tissue of Epithelantha micromeris, the black arrow indicates peak of GA4. Purification of samples by SPE.
for this reason, GA4 is strongly retained on the C-18 non-polar stationary phase of SPE, primarily due to non-polar polar interactions or Van Der Waals forces.
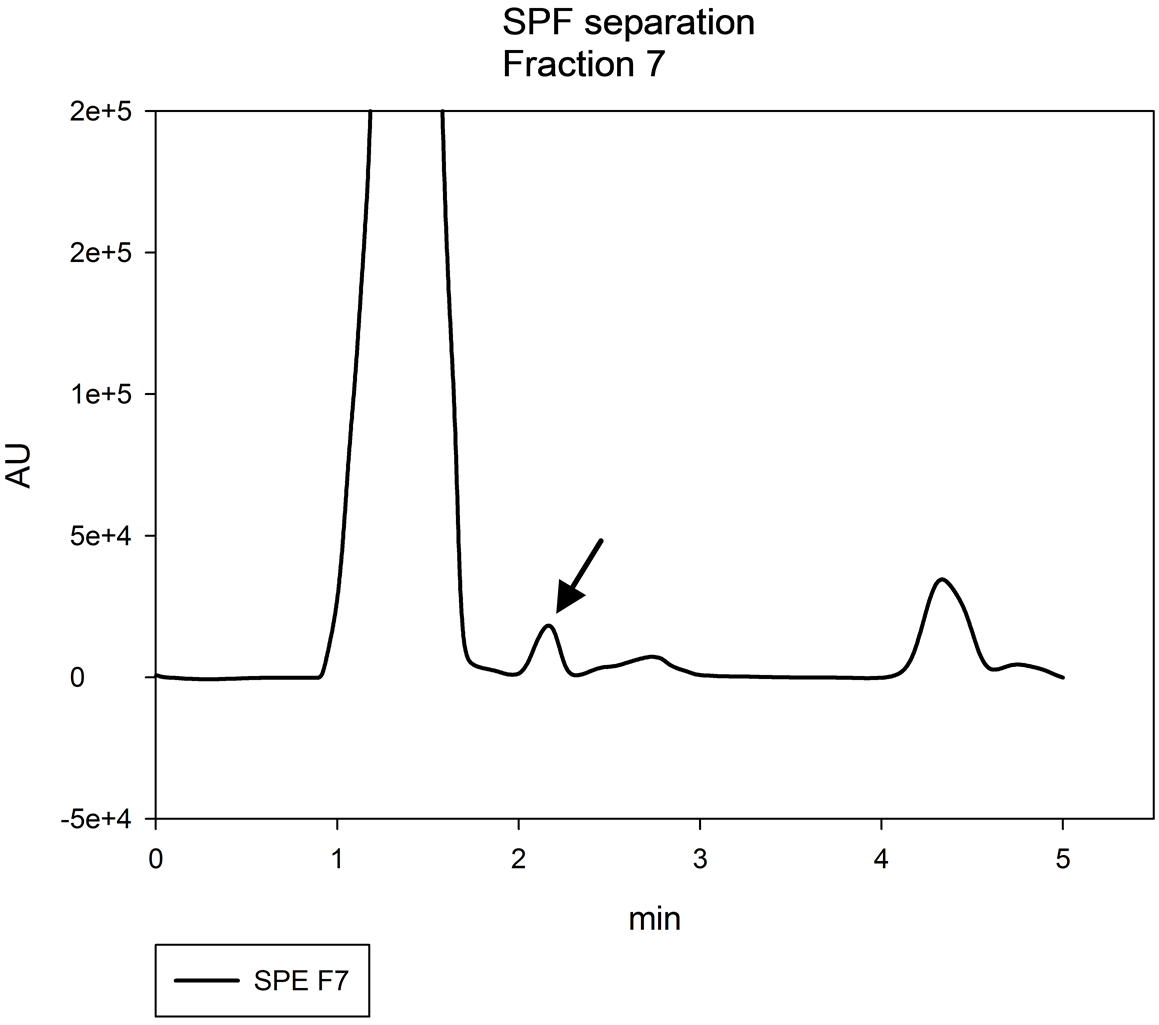
Figure 10. Chromatogram of fraction 7 obtained by SPE, in lyophilized tissue of Epithelantha micromeris, the black arrow indicates peak of GA4.
4. Conclusion
A rapid and efficient liquid chromatography method was developed for the quantification of giberellin A4 in Dasyliron cedrosanum and Epithelantha micromeris. A solid phase extraction technique for purification and concentration of GA4 in tissue of Epithelantha micromeris was employed. This purification procedure for GA4 can be applied to other vegetal tissues when separation by RP-LC is not possible or the concentration of GA4 is very low.
References
- Lale, G. and Gadre, R. (2010) Enhanced Production of Gibberellin A4 (GA4) by a Mutant of Gibberella fujikuroi in Wheat Gluten Medium. Journal of Industrial Microbiology & Biotechnology, 37, 297-306. http://dx.doi.org/10.1007/s10295-009-0673-1
- Macmillan, J. (2002) Occurrence of Gibberellins in Vascular Plants, Fungi, and Bacteria. Journal of Plant Growth Regulation, 20, 387-442. http://dx.doi.org/10.1007/s003440010038
- Hedden, P. and Phillip, A.L. (2000) Gibberellin Metabolism: New Insights Revealed by the Genes. Trends in Plant Science, 5, 523-530. http://dx.doi.org/10.1016/S1360-1385(00)01790-8
- Olszewski, N., Sun, T. P. and Gubler, F. (2002) Gibberellin Signaling: Biosynthesis, Catabolism, and Response Pathways. The Plant Cell, 14, S61-S80.
- Mander, L. (1992) The Chemistry of Gibberellins: An Overview. Chemical Reviews, 92, 573-612. http://dx.doi.org/10.1021/cr00012a005
- Dunberg, A. and Odén, P.C. (1983) Gibberellins and Conifers. In: Crozier, A., Ed., The Biochemistry and Physiology of Gibberellins, 2nd Edition, Praeger, New York, 221-295.
- Fernández, H., Fraga, M.F., Bernard, P. and Revilla, M.A. (2003) Quantification of GA1, GA3, GA4, GA7, GA9, and GA20 in Vegetative and Male Cone Buds from Juvenile and Mature Trees of Pinus radiate. Plant Growth Regulation, 40, 185-188. http://dx.doi.org/10.1023/A:1025070707899
- Dobrev, P.I. and Kaminek, M. (2002) Fast and Efficient Separation of Cytokinins from Auxin and Abscisic Acid and Their Purification Using Mixed-Mode Solid-Phase Extraction. Journal of Chromatography A, 950, 21-29.
- Mortiz, T., Philipson, J. and Odén, C. (1990) Quantization of Gibberellins A1 , A3, A4, A9 and an A9-Conjugate in Goodand Poor-Flowering Clones of Sitka spruce (Picea sitchensis) during the Period of Flower-Bud Differentiation. Planta, 181, 538-542.
- Gallazzo, J.L. and Lee, M.D. (2001) Production of High Titers of Gibberellins, GA4 and GA7 by Strain. LTB-1027. US Patent 6287800.
- Bruckne, B. and Blechschmid, D. (1990) The Gibberellin Fermentation. Critical Reviews in Biotechnology, 11, 163-192.
- Kim, H.-J. and Millar, B.W. (2009) GA4+7 plus BA Enhances Postproduction Quality in Pot Tulips. Postharvest Biology and Technology, 51, 272-277. http://dx.doi.org/10.1016/j.postharvbio.2008.07.002
- Batlang, U.L. (2009) Benzyladenine plus Gibberellins GA4+7 Increase Fruit Size and Yield in Greenhouse-Grown Hot Pepper (Capsicum annuum L.). Journal of Biological Sciences, 8, 659-662. http://dx.doi.org/10.3923/jbs.2008.659.662
- Dawes, P., Dawes, E., Difeo, O.D. and Wayyne, P. (2007) On-Line and Off-Line Application of Micro-SPE (MEPS) SGE. Analytical Science. http://www.sge.com/uploads/Kq/J3/KqJ3-rqH9_4kF680zX7uKQ/TP-0158-S_MEPS-A2.pdf
- Bhalla, K., Bala, S. and Agarwal, S.R. (2010) Quantitative Determination of Gibberellins by High Performance Liquid Chromatography from Various Gibberellins Producing Fusarium strains. Environmental Monitoring and Assessment, 167, 515-520. http://dx.doi.org/10.1007/s10661-009-1068-5
- du Preez, J.C., Qian, X.-M. and Kilian, S.G. (1993) Stability and Bioactivity of Gibberellic Acid in Different Solvents. Biotechnology Techniques, 7, 391-396. http://dx.doi.org/10.1007/BF00152547
- Nefed’eva, E.E and Mazey, N.G. (2009) Gibberellin A3 Detection in Plants with High-Performance Liquid Chromatography. Applied Biochemistry and Microbiology, 45, 454-458. http://dx.doi.org/10.1134/S000368380904019X
- Kelen, M. (2004) Separation of Abscisic Acid, Indole-3-Acetic Acid, Gibberellic Acid in 99 R (Vitis berlandieri x Vitis rupestris) and Rose Oil (Rosa damascena Mill.) by Reversed Phase Liquid Chromatography. Turkish Journal of Chemistry, 28, 603 -610.
- Ayele, B.T., Magnus, V., Mihaljevic, S.A., Prebeg, T., CoZ-Rakovac, R., Ozga, J.A., Reinecke, M.D., Mander, L.N., Kamiya, Y., Yamaguchi, S. and Salopek-Sondi, B. (2009) Endogenous Gibberellin Profile during Christmas Rose (Helleborus niger L.) Flower and Fruit Development. Journal of Plant Growth Regulation, 29, 194-209. http://dx.doi.org/10.1007/s00344-009-9124-5
- Stephan, M., Bangerth, F. and Schneider, G. (1999) Quantification of Endogenous Gibberellins in Exudates from Fruits of Malus domestica. Plant Growth Regulation, 28, 55-58. http://dx.doi.org/10.1023/A:1006211309707
- King, R.W., Pharis, R.P and Mander, L.N. (1987) Gibberellins in Relation to Growth and Flowering in Pharbitis nil Chois. Plant Physiology, 84, 1126-1131. http://dx.doi.org/10.1104/pp.84.4.1126
- Tudzynski, B. (2005) Gibberellin Biosynthesis in Fungi: Genes, Enzymes, Evolution and Impact on Biotechnology. Applied Microbiology and Biotechnology, 66, 597-611.
- Menéndez, V., Revilla, M.A., Bernard, P., Gotor, V. and Fernández, H. (2006) Gibberellins and Antheridiogen on Sex in Blechnum spicant L.. Plant Cell Reports, 25, 1104-1110. http://dx.doi.org/10.1007/s00299-006-0149-y
- Chen, J.G., Zhou, X. and Zhang, Y.Z. (1998) Gibberellin-Responding and Non-Responding Dwarf Mutants in Foxtail Millet. Plant Growth Regulation, 26, 19-24. http://dx.doi.org/10.1007/s00299-006-0149-y
- Kim, S.K., Lee, S.C.H., Shin, D.H., Jang, S.W., Nam, W.J., Park, T.S. and Lee, L.G. (2003) Quantification of Endogenous Gibberellins in Leaves and Tubers of Chinese yam, Dioscorea opposita Thunb cv. Tsukune during Tuber Enlargement. Plant Growth Regulation, 39, 125-130. http://dx.doi.org/10.1023/A:1022569506883
- Oden, P.C., Schwenen, L. and Graebe, J.E. (1987) Identification of Gibberellins in Norway Spruce (Picea abies [L.J Karst.) by Combined Gas Chromatography-Mass Spectrometry. Plant Physiology, 84, 516-519. http://dx.doi.org/10.1104/pp.84.2.516
- Meijón, M., Cañal, M.J., Fernández, H., Rodríguez, A., Fernández, B., Rodríguez, R. and Feito, I. (2011) Hormonal Profile in Vegetative and Floral Buds of Azalea: Levels of Polyamines, Gibberellins, and Cytokinins. Journal of Plant Growth Regulation, 30, 74-82. http://dx.doi.org/10.1007/s00344-010-9169-5
- Sigma Aldrich Co. (1999) Guide to Solid Phase Extraction, Bulletin, 919.
- Kim, S.K., Sohn, E.Y., Kang, S.M. and Lee, I.J. (2009) Quantification of Endogenous Gibberellins in Two Flax (Linum usitatissimum L.) Cultivars during Seed Development. Journal of Crop Science and Biotechnology, 12, 43-46.
Abbreviations
GA: Gibberellin RP-LC: Reverse Phase Liquid Chromatography SPE: Solid Phase extraction HPLC: High Performance Liquid Chromatography LC-MS: Liquid Chromatography Mass Spectroscopy LC: Liquid Chromatography GC-MS: Gas Chromatography Mass Spectroscopy UV: Ultraviolet nm: Nanometer
NOTES

*Corresponding author.