American Journal of Plant Sciences
Vol.4 No.4(2013), Article ID:29829,14 pages DOI:10.4236/ajps.2013.44101
Assessing Reactions of Genetically Improved and Local Cassava Varieties to Cassava Mosaic Disease (CMD) Infection in a Savannah Region of the DR-Congo
![]()
1Unit of Phytopathology, Faculty of Agronomy, University of Kinshasa, Kinshasa, Democratic Republic of Congo; 2Plant Clinic of Kinshasa, Kinshasa, Democratic Republic of Congo; 3Department of Biology, Laurentian University, Sudbury, Canada; 4Plant Virus Collection, DSMZ Deutsche Sammlung von Mikroorganismen und Zellkuturen GmbH, Braunschweig, Germany; 5Earth and Life Institute, Applied Microbiology-Phytopathology, Université Catholique de Louvain, Louvain-la-Neuve, Belgium; 6Regional Nuclear Energy Center, Kinshasa, Kinshasa, Democratic Republic of Congo.
Email: *knkongolo@laurentian.ca
Copyright © 2013 Marcel Muengula-Manyi et al. This is an open access article distributed under the Creative Commons Attribution License, which permits unrestricted use, distribution, and reproduction in any medium, provided the original work is properly cited.
Received February 23rd, 2013; revised March 26th, 2013; accepted April 2nd, 2013
Keywords: Cassava Mosaic Disease; Local Cassava Varieties; Genetically Improved Cassava Varieties; AUSiPC; AUDPC; Disease Index; DR-Congo
ABSTRACT
The responses of eight genetically improved and eight local cassava varieties to cassava mosaic disease (CMD) were evaluated under field conditions at two sites, in Eastern Kasaï, region of the DR-Congo). The varieties were planted using randomized complete block design with three replications. The rate of cuttings sprouted varied significantly from variety to variety and from location to location. Local varieties were severely infected than improved varieties throughout the trial period. In general, the level of CMD incidence for genetically improved varieties was below 15% while it reached 100% for the local cassava varieties six months after planting (MAP). This trend was also observed for the CMD severity and gravity. The mean scores for CMD severity were 2 and 3.6 for genetically improved and local varieties, respectively at 6 MAP. CMD gravity for improved varieties was below 21% for genetically improved varieties and exceeded 85% for local varieties at the end of trials. Area Under the Severity index Progress Curve (AUSiPC) and Area Under Disease Progress Curve (AUDPC) estimates confirmed that improved varieties were moderately infested comparatively to local varieties. Molecular analysis is being conducted to determine the genetic variability and complexity of the cassava mosaic virus strains involved.
1. Introduction
Cassava mosaic disease (CMD) is the principal constraint of cassava (Manihot esculenta Crantz) crop production in sub-Saharan African countries [1-4]. It is caused by several cassava mosaic geminiviruses and is the most important disease of cassava in Africa and the Indian subcontinent [5,6]. In DR-Congo (DRC) where cassava is a source of food and income for about 70% of population, CMD represents an important threat to food security for many Congolese families who rely on this staple food [7].
In sub-Saharan African countries, CMD can cause significant yield losses of up to 95%, especially in fields where susceptible cultivars are grown [8]. A key factor in the genesis and spread of the pandemic has been the recombination between two distinct cassava mosaic geminiviruses to produce a novel and more virulent hybrid [9]. To manage this pandemic, several genetically improved varieties resistant to the CMD have been developed and released in diverse agricultural regions. Egesi et al. [10] reported that in most resistant varieties, the disease is usually confined only to a few leaves or branches. However, several of these varieties have not been easily adopted because several farmers’ preferred characteristics related to environmental conditions, organoleptic traits and marketability have been ignored by several cassava improved programmes [7]. In addition, newly introduced improved varieties have been abandoned by farmers in areas where there were grown at a large scale, because of the loss of resistance to CMD due in part to new strains and agronomic practices that are favourable to the virus spread [7,9,11].
The main objective of the present study is to characterize field responses of new genetically improved and local cassava varieties from a savannah region of DRCongo.
2. Material and Methods
2.1. Field Trials
Field experiments were conducted at two sites in Gandajika region (Eastern Kasai) in DR-Congo (Figure 1). Site 1 was located at INERA research station (23˚57'E, 06˚48'S and 754 m altitude) and site 2 in Mpiana (23˚56'E, 06˚36'S and 685 m altitude). Site 1 was chosen because it is considered to be a low CMD-spread site where the use of resistant varieties and phytosanitation practice are applied. The choice of the site 2 (Mpiana) was motivated by the fact that it has been used for over 10 years by farmers to grow cassava with limited phytosanitation practices.
Gandajika region falls within the Aw4 climate type according to Köppen classification characterized with 4 months of dry season (from mid-may to august) coupled with 8 months of rainy season, sometimes interrupted by a short dry season in January/February. Daily tempera-

Figure 1. DR-Congo map. The arrow indicates the region (Gandajika) where the field trials were conducted.
ture averages 25˚C and annual rainfall is close to 1500 mm.
2.2. Cassava Varieties Used in the Study
The plant materials used in the present study consisted of 16 different local and genetically improved cassava varieties. Eight local varieties including Kamana-mabanza, Kavuandula, Luenyi, Madame, Muana-mpiana, Mutombo-tshomba and Tshilombo were evaluated. The eight improved varieties that were also evaluated include Butamu, Disanka, Gandajika, F 100, Mvuazi, Sadisa, TME 419 and Zizila. These new improved varieties were provided by the National Cassava Programme (PRONAM) while local varieties were from farmers’ fields. Hardwood stem cuttings used as planting material were selected from symptom-less plants.
2.3. Experimental Design
The study was conducted in 2009 during the growing season B (from February to July). In each site, two separate trials were conducted. The cassava materials were planted in a randomized complete block design (RBCD) with three replications. Each variety represented a treatment. Hardwood stem cuttings of each variety were planted in a plot of 30 plants at spacing of 1 m × 1 m, resulting in a population of 10,000 plants∙ha−1. Each plot measured 5 m × 4 m. Plots were weeded whenever necessary and no pesticide or fertilizer was applied throughout the period of the study.
2.4. Data Recorded and Statistical Analysis
The selected parameters used to compare varieties include rate of stem cuttings sprouted, cassava mosaic disease (CMD) incidence, severity and gravity, and tuberous root yield. The rate of cuttings sprouted was recorded 2 weeks after planting and was assessed for each variety based on the percentage of cuttings sprouted compared to the total number of stem cuttings planted in the plot. CMD incidence, severity and gravity were recorded at 1, 3 and 6 months after planting (MAP). The CMD incidence represented the percentage of diseased plants compared to the total number of plants present in the plot. The CMD symptom severity was assessed for each plant in the plot using a scale of 1 to 5 described by Hahn et al., [12] and Terry and Hahn [13], where: 1 = no symptoms; 2 = mild chlorosis, mild distortions at bases of most leaves, while the remaining parts of the leaves and leaflets appear green and healthy; 3 = pronounced mosaic pattern on most leaves, narrowing and distortion of the lower one-third of the leaflets; 4 = severe mosaic distortion of two thirds of most leaves and general reduction of leaf size and stunting of shoots; and 5 = very severe mosaic symptoms on all leaves, distortion, twisting, misshapen and severe leaf reductions of most leaves accompanied by severe stunting of plants.
The Area Under Disease Progress Curve (AUDPC) was calculated using CMD incidence as described by Shaner and Finney [14] as follows:
 where xi is CMD incidence at the time i, n is the number of data taken and t is the number of days between the registration of xi and
 . The mean severity score was used to calculate the adapted Area Under Severity Index Progress Curve (AUSiPC). This was calculated based on the following formula:

where SS1 is the CMD severity score at time t1 and SS2 is the CMD severity score at time t2. The CMD gravity was assessed per plant by the percentage of cassava leaves with typical symptoms of the disease.
CMD incidence and gravity data were tested for homogeneity of variance before analyses. They were transformed using the formula  as described by Legendre and Legendre [15], where y represent the proportion of infected plants (level of incidence) or the proportion of leaves with CMD symptoms (level of gravity). Data were subjected to the analysis of variance (ANOVA) using the Statistix 8 (free version) and R softwares. Mean effects were separated by least significant differences (LSD) at 5% of probability level. The response of each variety to CMD was also evaluated by determining the disease index (DI) which was calculated using the formula described by Fargette and Vié (1994) where: DI = CMD incidence (%) × CMD severity/100.
3. Results
Morpho-agronomic data of all the varieties used in the present study are described in Table 1. The results for
Table 1. Some agro-morphological characteristics of genetically improved and local cassava varieties used in the study.
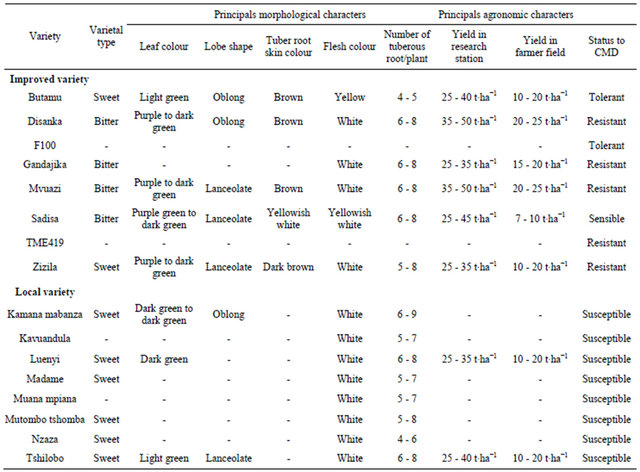
-: Data not available.
the rate of cuttings sprouted are illustrated in Figure 2. Data for CMD incidence and gravity are summarized in Tables 2 and 3, respectively. Results of rate cuttings and CMD severity are presented in Figures 2 and 3, respectively. Area Under Disease Progress Curve (AUDPC) and the total amount of disease severity expressed as the factor Area Under Severity index Progress Curve (AUSiPC) are illustrated in Figures 4 and 5, respectively. Details on disease index curves overtimes for all cassava varieties are presented in Figures 6 and 7.
3.1. Rate of Stem Cuttings Sprouted
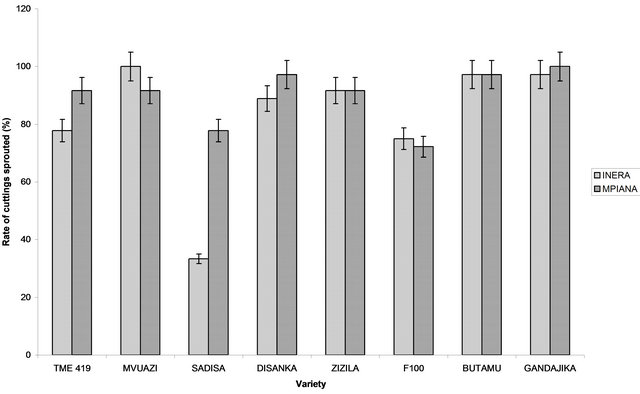
In each site, analysis of variance revealed significant differences (P < 0.05) among varieties. In general, the rate of cuttings sprouted varied among variety and among sites. The highest rate of cuttings sprouted for genetically improved varieties was recorded in Mvuazi and Gandajika (100%), for sites 1 (INERA) and 2 (Mpiana), respectively (Figure 2). The lowest rate was recorded in Sadisa (33.3%) at site 1 and in F100 (72.2%) at site 2 (Figure 2). For local cassava varieties, the highest rate of cuttings sprouted was observed in Luenyi (94.4%) at sites 1 and 2, while the lowest rate was recorded in Kavuandula and Mutombo-tshomba (66.6%) at site 1 and Tshilobo (50%) at site 2 (Figure 2).
3.2. Cassava Mosaic Disease Incidence
It was noted that all cassava varieties used in the present study expressed cassava mosaic disease symptoms overtime. In general, the local varieties showed higher CMD incidence values compared to genetically improved varieties. One month after planting (1 MAP), CMD symptoms were observed only on local varieties. The highest incidence of CMD at 3 MAP was observed on Sadisa plants (6.7%) and F100 plants (9.5%) at sites 1 and 2 respectively, while the lowest incidence was observed on Gandajika plants (3%) at site 1 and Disanka and Gandajika plants (2.8%), at site 2 (Table 1). At 6 MAP, the highest incidence was recorded on Disanka (9.7%) and Gandajika (13.8%) plants at sites 1 and 2, respectively
Table 2. Cassava mosaic disease incidence in field trials using genetically improved and local cassava varieties in Gandajika (DR-Congo).
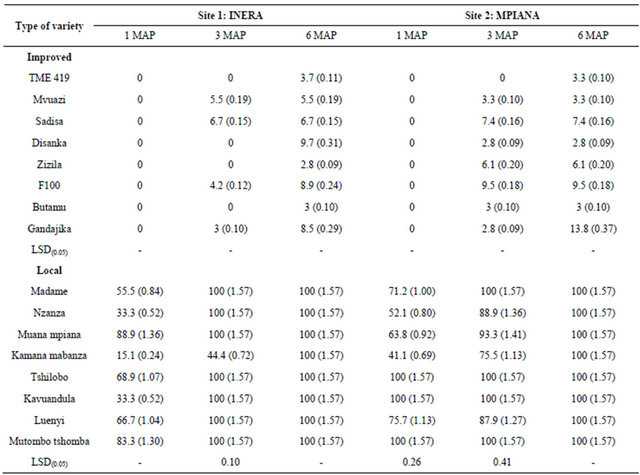
Table 3. Cassava mosaic disease gravity in field trials using genetically improved and local cassava varieties in Gandajika (DR-Congo).

Data (in parentheses) were transformed using formula  (Legendre and Legendre, 1998); LSD: Least significant difference; MAP: months after planting.
while the lowest incidence was observed on Zizila plants (2.8%) at site 1 and Disanka plants (2.8%) at site 2 (Table 2).
For local varieties, analysis of variance revealed that CMD incidence was not significantly different (P > 0.05) among varieties at 1 and 6 MAP at site 1 (INERA). Statistical analysis of data from site 2 (Mpiana) revealed significant differences (P < 0.05) in CMD incidence among varieties at 1 and 3 MAP. The highest incidence was recorded on Muana-mpiana plants (88.9%) at site 1, and on plants from Kavuandula, Mutombo-tshomba and Tshilobo (100%) at site 2, while the lowest incidence was recorded on Kamana-mabanza plants (15.1%) and (41.1%), at sites 1 and 2, respectively at 1 MAP (Table 1). At 3 MAP, the highest level of incidence was observed on plants from Kavuandula, Luenyi, Madame, Muana-mpiana, Mutombo-tshomba, Nzaza and Tshilobo (100%) while the lowest level of incidence was recorded on Kamana-mabanza (44.4%) plants at site 1. For site 2the maximum level of incidence was also observed on Madame plants (100%) while the lowest level of incidence was observed on Kamana-mabanza (75.5%). At 6 MAP, all the cassava varieties (100%) were infested at two sites (Table 2).
3.3. Cassava Mosaic Disease Severity
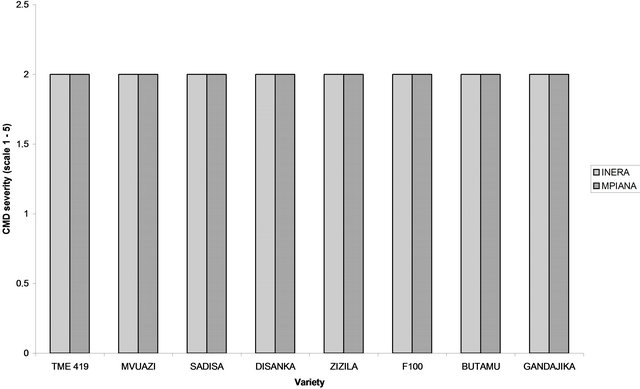
In general, in each site, high CMD severity values (mean severity ≥ 3) were recorded for local varieties compared to improved varieties. In fact, during the trials period, the CMD severity for each improved variety did not exceed the mean score of 2 (Figure 3). Improved cassava varieties expressed typical symptoms of CMD three MAP. At this stage, at site 1 (INERA), only four varieties (Gandajika, F 100, Mvuazi and Sadisa) expressed CMD symptoms. However, at site 2 (Mpiana), all the varieties except TME 419 developed CMD symptoms. At 6 MAP, all the genetically improved varieties tested were infested
 (a)
(a)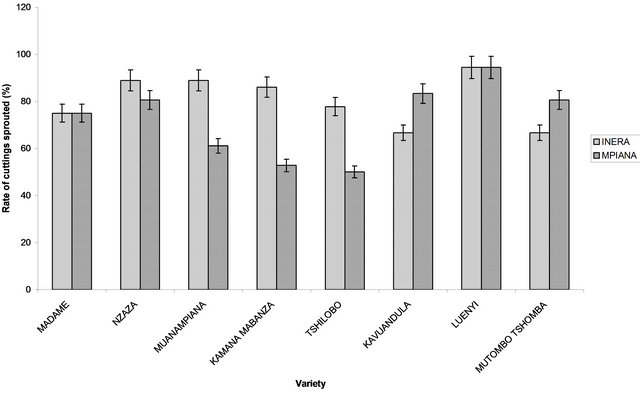 (b)
(b)
Figure 2. Rate of cuttings sprouted (14 days after planting). (a) Genetically improved varieties and (b) Local varieties.
 (a)
(a) (b)
(b)
Figure 3. Cassava mosaic disease severity (scale 1-5) recorded at 6 months after planting (MAP) at two sites in Gandajika (DR-Congo). (a) Genetically improved varieties; (b) Local varieties.
 (a)
(a) (b)
(b)
Figure 4. Cassava mosaic disease incidence expressed as the Area Under Disease Progress Curve (AUDPC) recorded at 2 sites in Gandajika (DR-Congo). (a) Improved varieties and (b) Local varieties.
 (a)
(a) (b)
(b)
Figure 5. Cassava disease severity expressed as the Area Under Disease index Progress Curve (AUSiPC) recorded at 2 sites in Gandajika (DR-Congo). (a) Genetically improved varieties; (b) Local varieties.
 (a)
(a) (b)
(b)
Figure 6. Disease index curves recorded on different genetically mproved varieties at (a) Site 1 (INERA) and at (b) Site 2 (MPIANA) in Gandajika (DR-Congo). MAP represents months after planting.
 (a)
(a)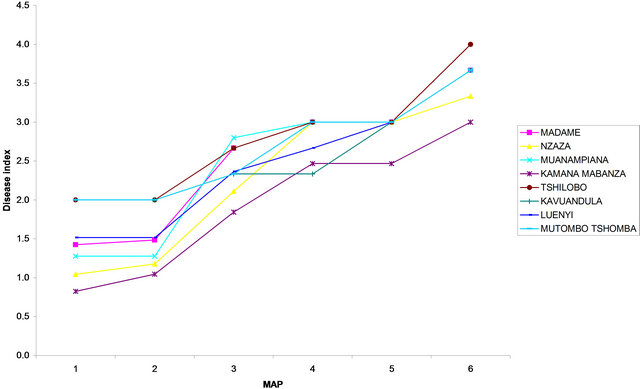 (b)
(b)
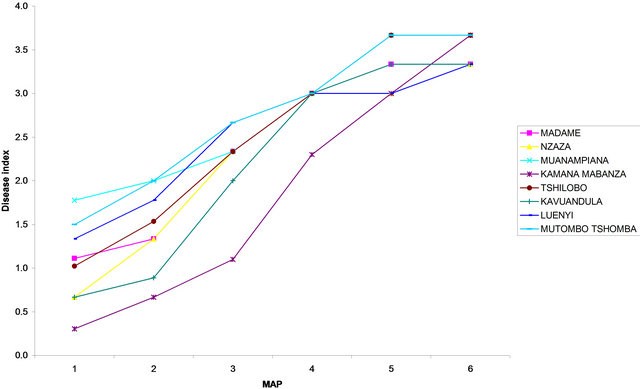
Figure 7. Disease index curves recorded on different local cassava varieties at (a) Site 1 (INERA) and at (b) Site 2 (MPIANA) in Gandajika (DR-Congo). MAP represents months after planting.
with the severity score of 2 for each variety at both sites (Figure 3).
CMD symptoms were observed in local variety plants as early as 1 MAP at both sites. At 3 MAP, the highest score was observed on Luenyi and Mutombo-tshomba plants (2.7) at site 1 and on Muana-mpiana (3) at site 2. The lowest severity score was noted in Kavuandula (2) and Kamana-mabanza, Kavuandula, Mutombo-tshomba and Nzaza (3), at sites 1 and 2, respectively. At 6 MAP, the highest CMD severity was observed in Kamana-mabanza, Muana-mpiana, Mutombo-tshomba and Tshilobo (mean score 3.7) while the lowest level of CMD severity was recorded on Kavuandula, Luenyi, Madame and Nzaza plants (mean score 3.3) in site 1. However, at site 2, the highest level of CMD severity was recorded on Tshilobo plants (mean score 4) while the lowest severity was recorded on Kamana-mabanza plants (mean score 3).
3.4. Cassava Mosaic Disease Gravity
CMD gravity for improved varieties was less than 21% regardless of the site. Typical CMD symptoms were observed in plots with genetically improved varieties from 3 MAP. In each site, analysis of variance did not reveal significant differences (P > 0.05) among improved varieties during the experimentation period (6 months). At 3 MAP, the highest level of gravity was observed in F 100 (8.3%) and Zizila (11.1%) while the lowest level of gravity was recorded in Sadisa (2.9%) and Disanka (4%), at site 1 and site 2, respectively (Table 3). At 6 MAP, the highest CMD gravity was recorded in Gandajika (5.1%) and Zizila (20.8%), while the lowest level of gravity was observed in Zizila (1.6%) and TME 419 (4.6%), at sites 1 and 2, respectively (Table 3).
It was noted that the level of CMD gravity for local varieties was higher compared to improved varieties values at both sites. Analysis of variance revealed significant differences (P < 0.05) among varieties for both site 1 (INERA) and site 2 (Mpiana). At 1 MAP, the highest level of gravity was observed on Tshilobo plants (33%) and Madame plants (39.9%), while the lowest CMD gravity was recorded on Kamana-mabanza plants (3.6%) and Luenyi plants (19.5%), at site 1 and site 2, respectively (Table 3). At 3 MAP, the highest level of CMD gravity was recorded on Tshilobo variety (56% at site 1) and (100% at site 2), while the lowest level of gravity was recorded on Nzaza (34.7% at site 1) and Luenyi (48.8% at site 2) varieties. At 6 MAP, the maximum level of gravity (100%) was recorded on Mutombotshomba and Luenyi varieties at site 1 and on Tshilobo, Madame and Mutombo-tshomba varieties at site 2, while the lowest level of gravity was observed on Madame (90.2%) and Kamana-mabanza (85.4%) varieties, at sites 1 and 2, respectively (Table 3).
3.5. Area Under Disease Progress Curve (AUDPC)
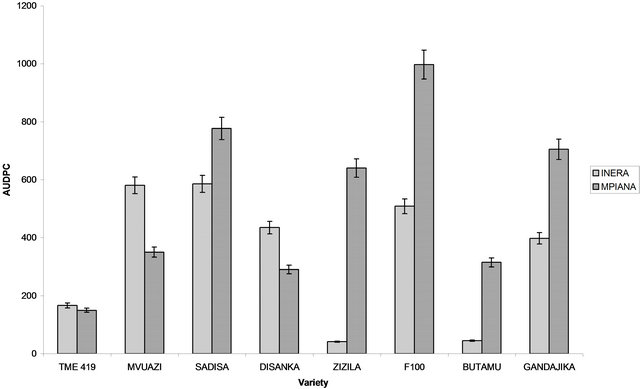
In each trial, the total amount of disease that occurred was calculated and expressed as the Area Under Disease Progress Curve (AUDPC). AUDPC values of the different varieties were compared and the results are presented in Figure 3. Analysis of variance for AUDPC values revealed significant differences (P < 0.05) among local varieties only. In site 1 (INERA), the highest value of AUDPC was observed on plants from Sadisa (improved) and Muana-mpiana (local) varieties while the lowest value was recorded on plants from Butamu (improved) and Kamana-mabanza (local). For site 2 (Mpiana), the highest AUDPC value for genetically improved varieties was recorded in F 100 while the lowest value was observed in TME 419. For local varieties, the highest value of AUDPC was observed on Kavuandula, Mutombotshomba and Tshilobo, while the lowest value was in Kamana-mabanza (Figure 4).
3.6. Area Under the Severity Index Progress Curve (AUSiPC)
In each site, the Area Under Severity index Progress Curve (AUSiPC) calculated for data covering the 6 month trial period did not show significant differences (P > 0.05) among improved and local varieties. At the end of the experimentation period, the highest AUSiPC value for improved varieties was recorded on plants from Gandajika, F 100, Mvuazi and Sadisa (255) varieties while the lowest value of AUSiPC was observed in Butamu and Zizila (165) for site 1. However, at site 2 (Mpiana), the AUSiPC values were 255 for all varieties, except for TME 419 variety which expressed the lowest AUSiPC value of 195 (Figure 5). The AUSiPC value estimated for local varieties revealed that, the highest value was recorded on plants from Mutombo-tshomba (425) while the lowest value was observed on plants from Kavuandula and Nzaza (390) at site 1. For site 2, the highest value of AUSiPC was recorded in Tshilobo (410) while the lowest value was observed in Kavuandula (375) (Figure 5).
3.7. Disease Index (DI)
The DI calculated six months after planting (6 MAP) did not vary significantly (P > 0.05) among varieties, for both genetically improved and local varieties in each site. The highest DI for improved varieties was recorded in Disanka, F 100 and Gandajika (0.2) while the lowest value of DI was recorded in Butamu, TME 419 and Zizila (0.06) at site 1. At site 2, the highest DI was observed in Gandajika variety (0.26) while the lowest level of DI was observed in Butamu, Disanka, Mvuazi and TME 419 (0.06) varieties (Figure 6). For local varieties the highest DI value was recorded on plants from Kamana-mabanza, Muana-mpiana, Mutombo-tshomba and Tshilobo (3.66) at site 1 and on Tshilobo plants (4.00) at site 2, while the lowest DI was recorded on plants from Kavuandula, Luenyi, Madame and Nzaza (3.33) and on Kamana-mabanza plants (3.00) at site 2, respectively (Figure 7).
4. Discussion
In the present study show that the rate of cuttings spouted varies from one variety to another. This variability may be related to interactions that exist between genotypic characters of each variety and soil conditions of each site where cassava was planted.
Genetically improved and local cassava varieties evaluated in the present study responded differently to cassava mosaic disease (CMD) infection. In general, at both sites, typical CMD symptoms were observed on all cassava varieties. However, the levels of different CMD symptoms and indices varied considerably among improved and local varieties. For example, the mean of CMD incidence remained below 15% for improved varieties, while it reached 100% for all the local varieties at 6 MAP. The level of CMD incidence varied from one site to another and among varieties. This is consistent with previous findings reported by Otim-Nape [16], Nweke [17], Zinga et al., [18], and Adriko et al., [19]. The results of the present study show that the disease severity was moderate for genetically improved varieties and severe for local varieties. In general, the disease severity recorded on local cassava varieties depended on the type of variety planted. Our observations corroborate with data reported by Fauquet and Fargette [20] who revealed that the severity of CMD symptoms varies with the cultivar and increases with the plant age until about 60 days after planting. These authors noted afterwards that the level of CMD severity depended on several factors such as the cultivar, climatic conditions, and growing season. According to Abdullahi et al. [21], the differences observed in CMD incidence and severity among cassava clones are due to genotypic factors. In the present study, the CMD gravity remained below 21% for improved varieties while reaching 100% for some local varieties at 6 MAP. This finding suggests that the leaves present in the cassava plant expressed CMD symptoms with different levels of severity. In Gandajika region, studies conducted earlier revealed that the gravity of CDM symptoms varied among leaves of a same cassava plant. This observation suggests that the virus is not distributed uniformly in different plant tissues.
The AUSiPC estimates in the present study indicated that the disease developed with a high degree of severity in local varieties compared to improved varieties. The same trend was observed for the factor AUDPC that was high for local varieties than improved varieties. In fact, data reported by Banito et al. [22] on expression of resistance and tolerance of cassava genotypes to bacterial blight revealed similar trend. These authors noted in general that the local genotypes were severely infected and expressed higher values of AUSiPC than improved genotypes. A study conducted on effect of mineral fertilization on CMD expression by Muengula-Manyi et al. [23] reported that values of AUDPC for local cassava varieties were higher than for improved varieties plants. In general, the disease index (DI) recorded on improved varieties did not exceeded value of 1 while it reached up to 4 for Tshilobo (a local variety) plants at the site 2. According to Adriko et al. [19], DI depended on the initial health status of plots and on the variety used. In the present case, the high value of DI observed on local varieties plants suggest that cuttings used from these varieties were initially infested although they did not expressed CMD symptoms. In this study, the low level of disease parameters recorded in improved varieties appears to be related to a presence of CMD tolerance genes as suggested by Muengula-Manyi et al. [23].
In conclusion, differences in reaction of cassava varieties to CMD infection were observed in the targeted savannah region in DR-Congo. The CMD parameters and indices analysed revealed that the disease was very pronounced in local varieties compared to genetically improved varieties. This indicates that improved cassava varieties assessed in the present study carry genes for resistance to CMD viral strains in the targeted areas. Molecular characterization of strains collected in the study areas is being conducted to determine the level of their genetic variability and complexity.
5. Acknowledgements
Authors express their gratitude to the Canadian International Development Agency (CIDA) for financial support and to the CUI-CUD through the Project KIN 01 (Molecular Biology) for the Doctoral fellowship to MMM. Thanks to Mbuyamba and technicians of the “Programme National Manioc (PRONAM)” of the Research Center of the “Institut National pour l’Etude et la Recherche Agronomiques (INERA/Gandajika)” for their technical assistance during the experimentation period.
REFERENCES
- J. P. Legg, “Emergence, Spread and Strategies for Controlling the Pandemic of Cassava Mosaic Virus Disease in East and Central Africa,” Crop Protection, Vol. 18, No. 10, 1999, pp. 627-637. doi:10.1016/S0261-2194(99)00062-9
- O. A. Ariyo, A. G. O. Dixon and G. I. Atiri, “Effect of Detopping on Disease Incidence and Symptom Severity of African Cassava Mosaic Virus Disease (ACMD) on Some Newly Developed Cassava Cultivars from Landraces Introgression,” Acta Phytopathologica et Entomologica Hungarica, Vol. 38, No. 1-2, 2003, pp. 115-124. doi:10.1556/APhyt.38.2003.1-2.14
- J. P. Legg and B. Owor, “Cassava Mosaic Disease in Africa: Where Are the Epidemics?” Africa Crop Science Conference Proceedings, Vol. 6, 2003, pp. 322-328.
- G. N. Ssemakula, W. S. Sserubombwe, A. Bua, J. Jagwe, R. S. B. Ferris and J. B. A. Whyte, “Constraints and Potential for Cassava Commercialisation in Uganda,” Proceedings of Regional Workshop on Improving the Cassava Sub-Sector, Nairobi, April 2002, pp. 57-60.
- J. P. Legg and C. M. Fauquet, “Cassava Mosaic Geminiviruses in Africa,” Plant Molecular Biology, Vol. 56, 2004, pp. 585-599. doi:10.1007/s11103-004-1651-7
- H. M. A. Bi and P. Zhang, “Evaluation of Cassava Varieties for Cassava Mosaic Disease Resistance Jointly by Agro-Inoculation Screening and Molecular Markers,” African Journal of Plant Science, Vol. 4, No. 9, 2010, pp. 330-338.
- M. Muengula-Manyi, K. K. Nkongolo, C. Bragard, P. Tshilenge-Djim, S. Winter and A. Kalonji-Mbuyi, “Incidence, Severity and Gravity of Cassava Mosaic Disease in Savannah Agro-Ecological Region of DR-Congo: Analysis of Agro-Environmental Factors,” American Journal of Plant Sciences, Vol. 3, 2012, pp. 512-519.
- F. O. Ogbe, A. G. O. Dixon, J. d’A. Hughes, O. J. Alabi and R. Okechukwu, “Status of Cassava Begomoviruses and Their Natural Hosts in Nigeria,” Plant Disease, Vol. 90, No. 5, 2006, pp. 548-553. doi:10.1094/PD-90-0548
- J. P. Legg and J. M. Thresh, “Cassava Mosaic Virus Disease in East Africa: A Dynamic Disease in a Changing Environment,” Virus Research, Vol. 71, No. 1-2, 2000, pp. 135-149. doi:10.1016/S0168-1702(00)00194-5
- C. N. Egesi, F. O. Ogbe, M. Akoroda, P. Ilona and A. Dixon, “Resistance Profile of Improved Cassava Germplasm to Cassava Mosaic Disease in Nigeria,” Euphytica, Vol. 155, 2007, pp. 215-224. doi:10.1007/s10681-006-9323-0
- J. P. Legg, B. Owor, P. Sseruwagi and J. Ndunguru, “Cassava Mosaic Virus Disease in East and Central Africa: Epidemiology and Management of a Regional Pandemic,” Advances in Virus Research, Vol. 67, 2006, pp. 355-418. doi:10.1016/S0065-3527(06)67010-3
- S. K. Hahn, E. R. Terry and K. Leuschner, “Breeding Cassava for Resistance to Cassava Mosaic Disease,” Euphytica, Vol. 29, 1980, pp. 673-683. doi:10.1007/BF00023215
- E. R. Terry and S. K. Hahn, “The Effect of Cassava Mosaic Disease on Growth and Yield of a Local and an Improved Variety of Cassava,” Tropical Pest Management, Vol. 26, 1980, pp. 34-37. doi:10.1080/09670878009414280
- G. Shaner and R. E. Finney, “The Effect of Nitrogen Fertilization on the Expression of Slow-Mildewing Resistance in Knox Wheat,” Phytopathology, Vol. 67, 1977, pp. 1051-1056. doi:10.1094/Phyto-67-1051
- P. Legendre and L. Legendre, “Numerical Ecology,” 2nd Edition, Elsevier Science BV, Amsterdam, 1998.
- G. W. Otim-Nape, “The Epidemiology of the African Cassava Mosaic Geminivirus Disease in Uganda,” Ph.D. Thesis, University of Reading, Reading, 1993, 255 p.
- F. I. Nweke, “Farm Level Practices Relevant to Cassava Plant Protection,” African Crop Science Journal, Vol. 2, No. 4, 1994, pp. 563-581.
- I. Zinga, C. R. Nguimalet, D. P. Lakouetene, G. Konate, E. Kosh Komba and S. Semballa, “The Impacts of African Cassava Mosaic in Central African Republic,” GeoEco-Trop, Vol. 32, 2008, pp. 47-60.
- J. Adriko, W. S. Sserubombwe, E. Adipala, A. Bua and R. Edema, “Response of Local Cassava Varieties in Uganda to Cassava Mosaic Virus Disease,” American Journal of Experimental Agriculture, Vol. 2, No. 1, 2012, pp. 111- 132.
- C. Fauquet and D. Fargette, “African Cassava Mosaic Virus: Etiology, Epidemiology, and Control,” Plant Disease, Vol. 74, No. 6, 1990, pp. 404-411. doi:10.1094/PD-74-0404
- I. Abdullahi, G. I. Atiri, A. G. O. Dixon, S. Winter and G. Thottappily, “Effects of Cassava Genotype, Climate and the Bemisia tabaci Vector Population on the Development of African Cassava Mosaic Geminivirus (ACMV),” Acta Agronomica Hungarica, Vol. 51, No. 1, 2003, pp. 37-46. doi:10.1556/AAgr.51.2003.1.5
- A. Banito, K. E. Kpemoua and K. Wydra, “Expression of Resistance and Tolerance of Cassava Genotypes to Bacterial Blight Determined by Genotype × Environment Interactions,” Journal of Plant Disease and Protection, Vol. 115, No. 4, 2008, pp. 152-161.
- M. Muengula-Manyi, K. K. Nkongolo, C. Bragard, P. Tshilenge-Djim, S. Winter and A. Kalonji-Mbuyi, “Effect of NPK Fertilization on Cassava Mosaic Disease (CMD) Expression in a Sub-Saharan Africa Region,” American Journal of Experimental Agriculture, Vol. 2, No. 3, 2012, pp. 336-350.
NOTES
*Corresponding author.