American Journal of Plant Sciences
Vol.3 No.10(2012), Article ID:24097,4 pages DOI:10.4236/ajps.2012.310168
Identifying Combinatorial Growth Inhibitory Effects of Various Plant Extracts on Leukemia Cells through Systematic Experimental Design*
![]()
Division of Bioengineering, School of Chemical and Biomedical Engineering, Nanyang Technological University, Singapore, Singapore.
Email: #mayasarilim@ntu.edu.sg
Received August 6th, 2012; revised September 5th, 2012; accepted September 16th, 2012
Keywords: Growth Inhibition; Apoptosis; Factorial Design; Polyphenols; Flavonoids; Synergistic Effects
ABSTRACT
Plant extracts are widely studied for their anti-cancer and cancer preventive effects. In this study, we compared the leukemia growth inhibition effects of seven different plant extracts, theaflavin, epigallocatechin gallate (EGCG), epicathechin (EC), apigenin, quercetin, chrysin and tannic acid, in vitro using the K562 erythroleukemia cell line and application of the design of experiments (DoE) methodology. Our systematic approach enabled us to isolate the main factor contribution, two-factor interactions and produced interaction relationships and/or models to describe growth inhibitory effects of different plant extracts when they are used in combination. The results identified tannic acid as the most significant inhibitor in this group and had synergistic effects with EGCG at specific concentrations. The fitted model of their combined effects showed that the most potent combination is at low concentrations of tannic acid (10 - 20 µM) and high concentrations of EGCG (80 - 100 µM). We further showed that tannic acid induced both growth inhibition and apoptosis in K562 cells in ranges between 10 - 100 µM. The polyphenol caused cell cycle arrest at G2- phase under the higher concentrations. In summary, use of DoE techniques effectively identified the most prominent inducer in this group of plant bioactive compounds and produced combinatorial bioactivity of various polyphenols and flavonoids over the entire range of concentrations under study. This study exemplifies the usefulness of DoE and serves as a guide in its utility for in vitro assessment of bioactivity in plant constituents.
1. Introduction
Natural plant extracts with anti-cancer properties are generally classified as strong anti-oxidants widely known as polyphenols. Defined chemical constituents extracted from tea such as theaflavin, epigallocatechin gallate (EGCG) and epicathechin (EC) have been studied on various leukemia cell lines and showed good potential as chemopreventive or anti-cancer agentsexhibiting growth inhibitory effects in vitro [1-3] . Flavones found in plants and vegetables such as apigenin and quercetinare known to induce apoptosis in leukemia cells [4]. Other plants extracts that were previously studied as anti-cancer agents include chrysin which is also a naturally occurring flavone commonly found in blue passion flower, and tannic acid which is widely found in food plants. Chrysin is able to induce apoptosis and possess anti-proliferative effects on various leukemias [5,6] demonstrating direct intervention of key signaling pathways controlling these cellular functions. Good anti-oxidants such as apigenin have also been studied for its effects in reducing geno-toxic damage of drug treatments for leukemia [7]. Although a substantial and increasing number of studies are being made on various tea and plant extracts, most of which have only quantified dose-response effects performed independently. The goal of this study is to demonstrate a highly effective and efficient method to perform quantitative comparisons between individual contributions of different plant extractson leukemia cells and identify synergistic effects between two components. This was achieved by using a systematic experimental design approach.
We utilized the design of experiments (DoE) method to investigate growth inhibition effects of polyphenols and flavonoids from seven different plant extracts on the erythroleukemia cell line K562. The DoE [8,9] is a systematic statistical method in creating a set of combinatorial experiments required to perform a comparative study. Use of DoE approaches is not unknown to food or chemical toxicology studies; an early study has demonstrated and evaluated the use of factorial designs to assess combinatorial toxicity effects in chemical mixtures [10]. More recently, another group showed advantages in the use of non-regular fractional factorial designs for the analysis of combinatorial effects in toxicology [11]. Other DoE studies would include more traditional process optimization, which can be applied for example to extraction processes in medicinal plants [12]. In these studies, the key advantage highlighted in DoE methods is its ability to utilize a minimum number of experiments in order to maximize information obtained from the output data. These are important considerations in factoring cost analysis in experimental designs. When studying effects from multiple components (more than five factors), it is often useful to utilize fractional factorial designs as they serve to significantly reduce the number of experiments required and still obtain the same amount of information that one would normally undertake in a dose-response study [13,14]. In a well-designed DoE experiment, one can often find bountiful information that would otherwise not be captured in dose-response experiments. Here we demonstrate how one could perform a series of DoE experiments to obtain valuable information that accurately and quantitatively describe effects from multiple bioactive components in plants. We began our study with the minimal number of experiments required, starting with a Resolution III factorial design, then building up by foldover to a Resolution IV factorial design which increased the number of experimental points in the DoE matrix while reducing the number of confounding factors. We compared the outcomes from each design study and discussed the knowledge obtained including advantages and disadvantages gained from each experimental design. This study serves to guide experimenters on the choice of fractional factorial designs and how it could be maximized to achieve the goal of any experiment.
To illustrate the utility of factorial designs in a multicomponent combinatorial study, seven known anti-leukemia natural plant extracts were investigated for their growth inhibitory effects on K562 cells over 48 hours. We compared and discussed three DoE output analysis from three different fractional factorial designs. This study highlights the power of a systematic approach in experimental design using methods such as DoE, which can significantly enhance the study of multi-component effects for the purpose of screening and combinatorial treatments. The information that we obtained from such a systematic approach can improve our understanding and better quantify the effects of multi-component bioactive compounds from plants and their roles in anti-cancer activity.
2. Materials and Methods
2.1. Chemicals
All seven plant extracts, theaflavin, EGCG, EC, apigenin, quercetin, chrysin, and tannic acid were purchased from Sigma-Aldrich (Sigma-Aldrich, St. Louis, MO) and are of research grade. Stock solutions of 1 mM were prepared for each extract in ultra-pure water and sterilefiltered before adding into the cell culture. Final concentrations of each plant extract used in the DoE study were either 10 µM or 100 µM.
2.2. Cell Culture
The erythroleukemia cell line K562 purchased from the American Type Culture Collection (ATCC, Manassas, VA) is a characteristic cell line describing blast crisis in chronic myeloid leukemia (CML). Erythroleukemia K562 cells were cultured in Iscove’s Modified Dulbecco’s Medium (IMDM; In vitro gen, Carlsbad, CA) supplemented with 10% fetal bovine serum (FBS; PAA Laboratories) at 37˚C in a fully humidified 5% CO2 chamber. Cells were seeded into a 96-well plate at a density of 1 × 10⁵ cells/mL performed in triplicates. Plant extract reagents were added into each well according to DoE study and allowed to incubate in cell culture for 48 hours.
2.3. Cell Proliferation Assay
Growth inhibition was assayed using the Cell Titer 96 Aqueous One Solution Cell Proliferation Assay (Promega, Madison, WI). After 48 hours in culture, 10 μL of cell titer was added to each well of the 96-well plate containing leukemia cell culture. The 96-well plate was then incubated at 37˚C in a fully humidified 5% CO2 atmosphere for 2 hours. Absorbance at 450 nm (A450) was then measured on a microplate reader.
2.4. Morphological Observations
Erythroleukemia cells were observed under light microscope every 24 hours during the cell culture. Observations in morphological changes were made for conditions under tannic acid at 10 µM and 100 µM after the first DoE experiment (Resolution III design) was performed which identified tannic acid as a key inhibitory factor. These changes were monitored for up to 48 hours. A DAPI nucleic acid stain at a final concentration of 300 nM incubated for 5 minutes was performed at 48 hours to observe DNA integrity of leukemic cells under various tannic acid concentrations and in the absence of any inhibitory compounds.
2.5. Cell Cycle Analysis
Cell samples were collected at different time intervals (012, 24, and 48 hours) after exposure to tannic acid and a non-exposure (no tannic acid) acted as the control. Cells were fixed in 70% ethanol prior to staining in 50 μg/mL propridium iodide (PI) solution. Cells were analyzed on the Epics-Altra System (Beckman Coulter, San Jose, CA) flow cytometer. A total of 30,000 events were acquired for each sample and data analysis was performed in Flow Jo (Tree Star, Inc., Ashland, OR).
2.6. DoE Design
The first fractional factorial design is a Resolution III design, which is the lowest level design that permits a minimal number of experiments, in this case 8 experiments, to be executed. Such designs are highly confounded thus the main effects in a Resolution III design are confounded with several two-factor interaction effects [15]. To improve the quality of such designs and “untangle” main effects from two-factor interactions, we performed a fold-over and added more experimental combinations to obtain essentially a Resolution IV design. Main effects in the Resolution IV factorial design are now free of any two-factor interactions and no longer confounded to them but two-factor interactions remain confounded to each other. As a final step to delineate two-factor interactions, we performed a semi-fold and added 8 more experimental runs to the DoE matrix. This step serves to confirm the presence of and identify only significant two-factor interactions.
2.7. Statistical Analysis
The software used for creating DoE matrices and data analysis was the Design-Expert Version 7 by Stat-Ease, Inc. (Stat-Ease, Minneapolis, MN). Significant factors contributing to growth inhibition of K562 cells were first identified using half-normal probability plots and the pareto chart. The latter displays Bonferroni limit and tvalue limit in the analysis. Analysis of variance (ANOVA) was performed to evaluate the significance of each individual factors and provide quantitative comparisons between each factor. Any factor with a p-value of less than 0.05 is considered to be significant. Interaction plots between two factors that were significant were also generated. Contour and response surface plots between two factors that were significant show their combined effects on growth inhibition.
3. Results
3.1. Resolution III Design Highlights Main Effects but Not Two-Factor Interactions
The first fractional factorial design, which is a Resolution III design, gave comparison between main effects from each component. The half-normal probability plot of effects (data not shown) revealed the most dominant effect comes from Factor G: tannic acid, and subsequent two main effects chosen were Factors E and F: quercetin and chrysin. The Pareto Chart also showed that tannic acid lies above the Bonferroni limit (highly probable to be statistically significant) while quercetin and chrysin lies only slightly above the t-value limit. Thetable of effect list (Table 1) compares quantitative contributions from each factor showed that tannic acid accounts for 65.4% of effect contribution while quercetin and chrysin accounted for only 28.8% combined. Finally the alias listidentifies two-factor interactions that are confounded with each main factor. In this DoE design, tannic acid is confounded with AF, BE and CD, quercetin is confounded with AC, BG and DF, and chrysin is confounded with AG, BC and DE.
3.2. Fold-Over/Resolution IV Design Reveals both Main and Interactive Effects
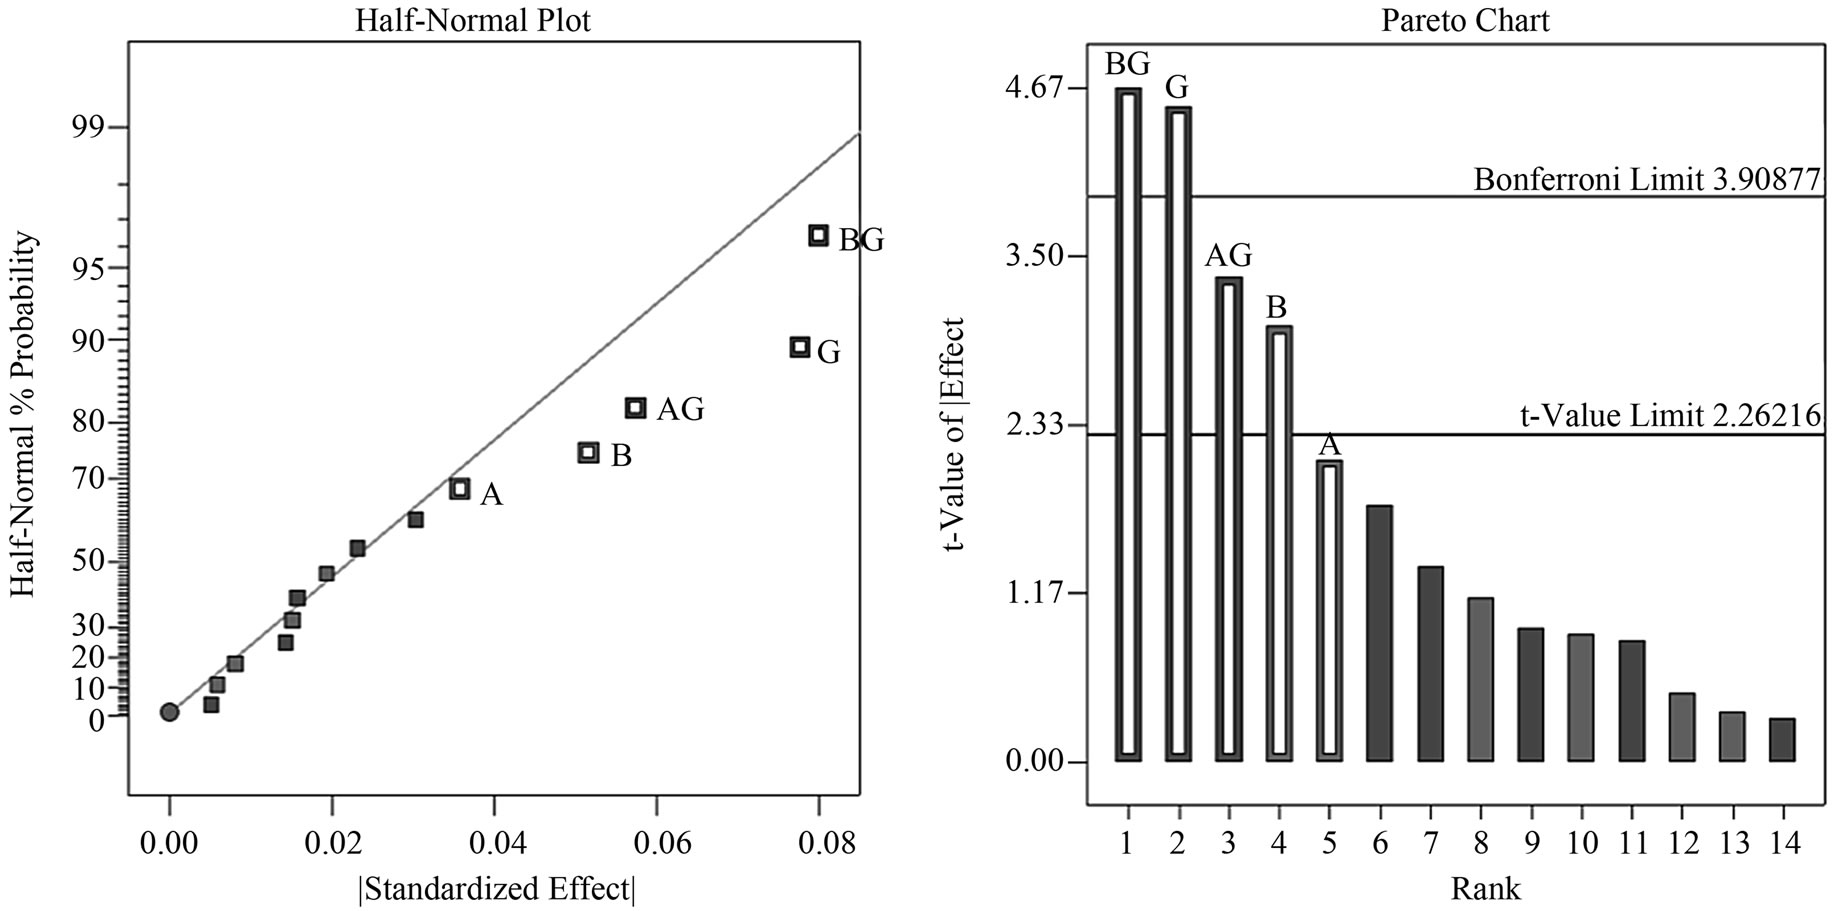
The Resolution IV design compares effects between main factors and two-factor interactions. Two-factor interactions within each group were delineated by comparative contributions of individual factor components. The analysis has led us to select the most likely factors as key contributors and the revised half-normal probability plot displayed reflects true contributions of the chosen factors (Figure 1(a)). This plot revealed that the first most prominent effect comes from BG, followed by G, AG and then B. The pareto chart (Figure 1(b)) shows that both BG and G lie above the Bonferroni limit while factors AG and B lie above the t-value limit. Factor A, being a component of AG, lies slightly below the t-value limit. Resolution IV design allowed us to study two-factor interactive plots of BG (EGCG and tannic acid) and AG (theaflavin and tannic acid); in this interaction plot the transformed response factor (1/√y) is displayed, the inverse square root of cell inhibition indicates strong growth inhibition at high values and low inhibition at low values. Interaction plot of BG (Figure 1(c)) tells us that at low concentrations of tannic acid (10 µM), increasing concentrations
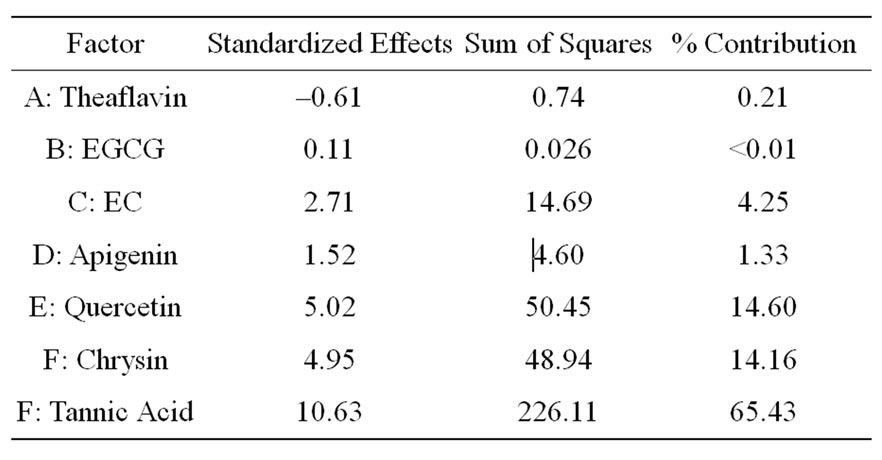
Table 1. Effect list for Resolution III design.
 (a)
(a)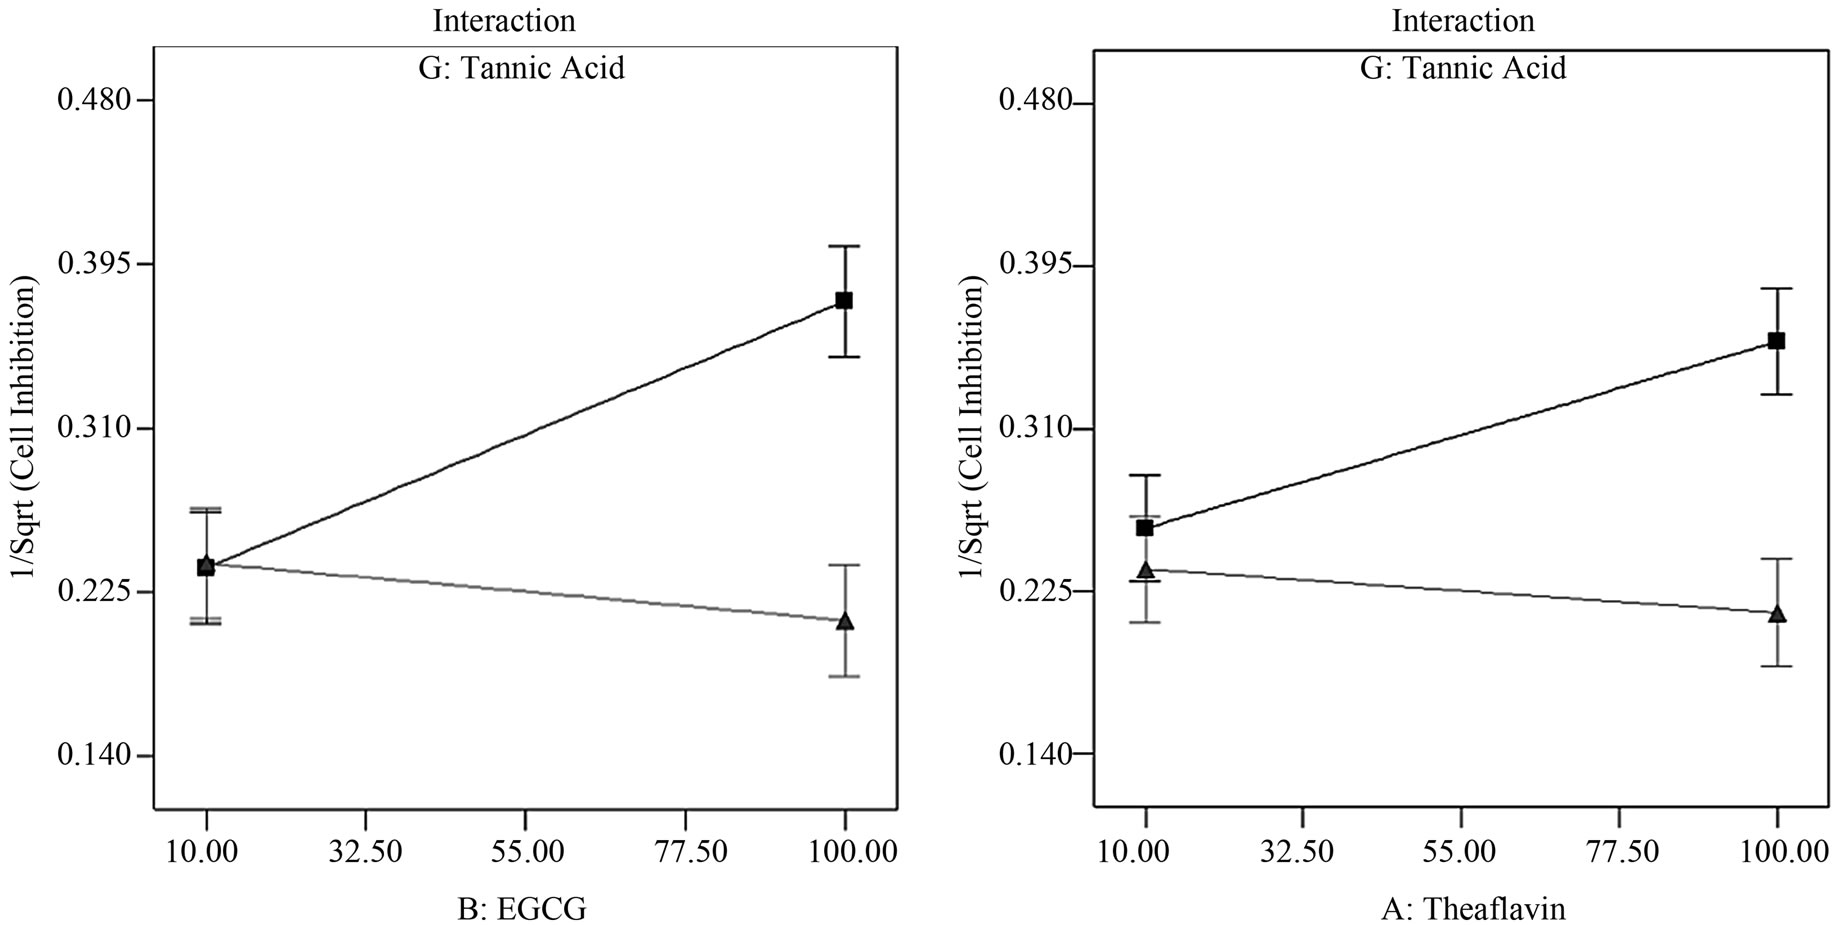 (b)
(b)
Figure 1. Factor analysis of fold-over/Resolution IV design. (a) Adjusted half-normal probability plot with appropriate factors selected: BG, G, AG and B respectively; (b) The pareto chart identified factors BG and G lying above the Bonferroni limit while factors AG and B are above the t-value limit but below the Bonferroni limit; (c) Interaction between tannic acid and EGCG indicates an additive inhibition effect at low concentration of tannic acid; (d) Interaction between tannic acid and theaflavin indicates an additive inhibition effect at low concentration of tannic acid. (n = 10 μM tannic acid; Δ = 100 μM tannic acid).
of ECGC would increase inhibitory effects of these two plant extracts on K562 cell proliferation while at high concentrations of tannic acid (100 µM), no further gain in growth inhibition effects is observed by increasing ECGC concentrations. Factor AG showed a similar trend to that of factor BG (Figure 1(d)) with only a gain in combined inhibition at low concentrations of tannic acid (10 µM) but not at higher concentrations (100 µM).
3.3. Semi-Fold De-Aliases All Two-Factor Interactions
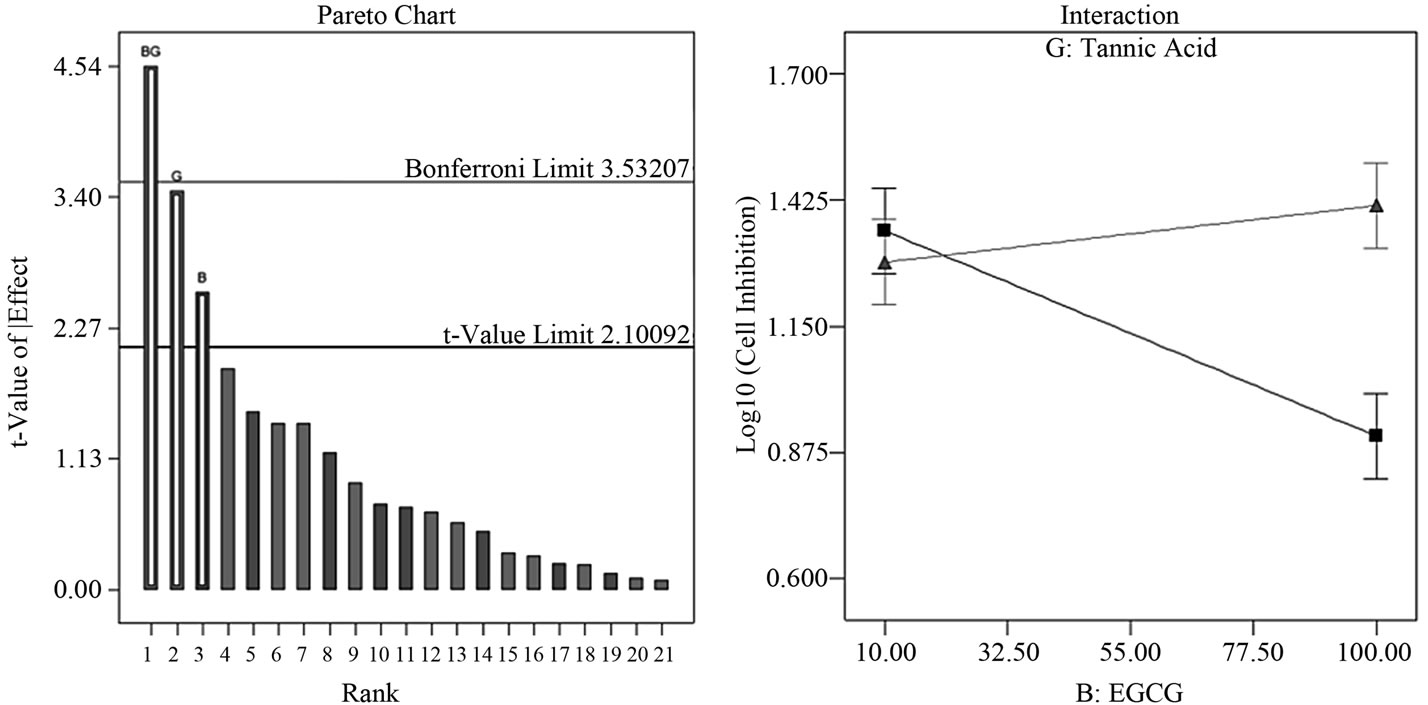
By performing a semi-fold on the Resolution IV design, we effectively de-aliased all two-factor interactions. This step enabled us to immediately identify and distinguish significant factor contributions in this study; these factors are BG (EGCG-tannic acid), G (tannic acid) and B (EGCG). The two-factor interaction BG lies above the Bonferroni limit, factor G is high above the t-value limit and close to the Bonferroni limit while B lies somewhere in between the t-value and Bonferroni limit (Figure 2(a)). In the semifold Resolution IV design, BG is now only confounded with three-factor interactions and not with any other twofactor interactions. Model equations from ANOVA showed a linear relationship with the interactive factor BG contributing to 52.5% of the model and factors B and G contributing to 17.0% and 30.4% respectively. The two-factor interaction plot (Figure 2(b)) indicated an additive/ synergistic effect at low concentrations of tannic acid; the log transformed value of cell growth inhibition indicates strong growth inhibition at low values and low inhibition at high values. The surface response/contour plot displays combined inhibition effects of tannic acid and EGCG with highest inhibition at low concentrations of tannic acid but high concentrations of EGCG (Figure 2(c)).
 (a)
(a)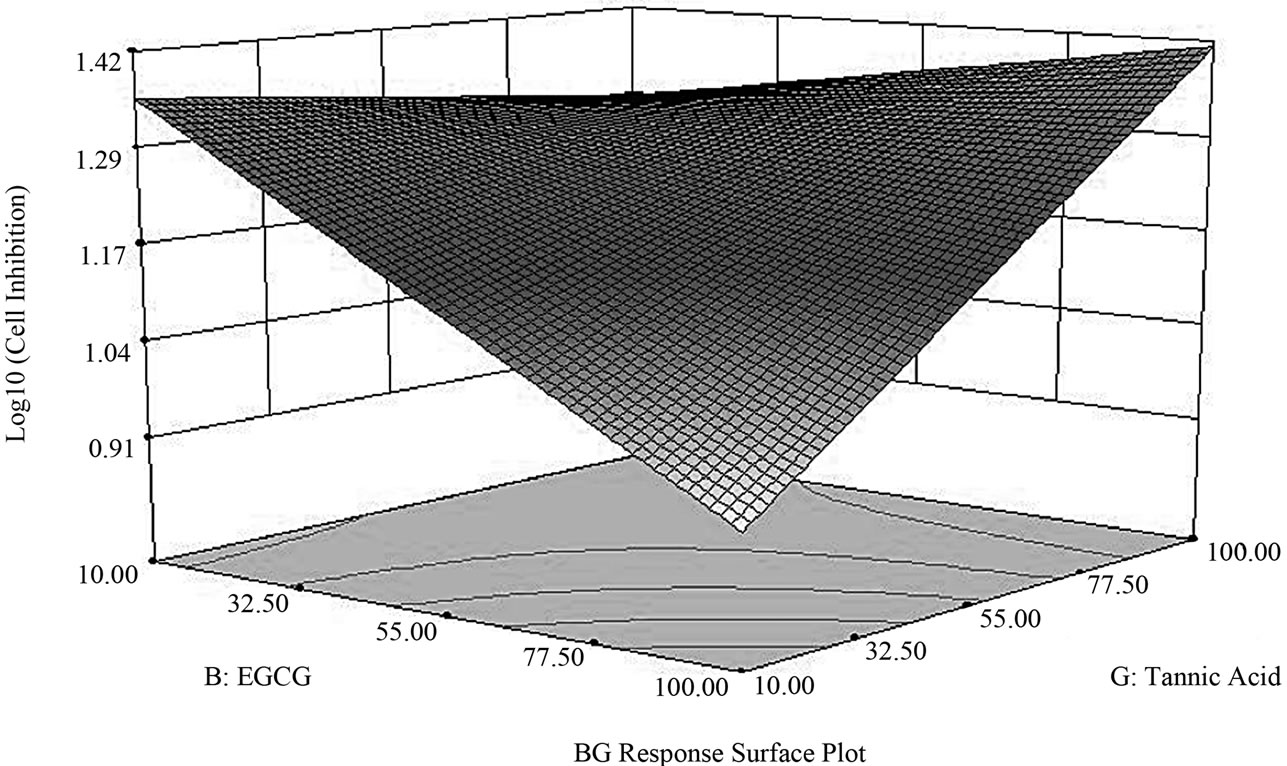 (b)
(b)
Figure 2. Factor analysis of semi-fold Resolution IV design. (a) The pareto chart shows factor BG above the Bonferroni limit and both factors G and B above the t-value limit; (b) Interaction between tannic acid and EGCG shows an additive inhibition effect at low concentrations of tannic acid (n =10 μM tannic acid; Δ = 100 μM tannic acid) (c) Response surface and contour plot displays effective/combined growth inhibition effect from tannic acid and EGCG at various concentration combinations over the entire range 10 - 100 μM.
3.4. Growth Inhibition and Apoptotic Effect of Tannic Acid on K562 Cells
Morphological observations on the growth inhibition effects of tannic acid were studied over a 48-hour period (Figure 3). After 24 hours of cell incubation, apoptotic cell signatures were observed at both high and low concentrations of tannic acid. At 10 µM, cell shrinkage along with condensation of nucleic acids were observed (Figure 3(b)) and at 100 µM, cell shrinkage, nuclear condensation, and blebbing were observed (Figure 3(c)). On the other hand, control culture of cells subject to no tannic acid treatment remained fully intact with rounded morphologies in appropriate size ranges of normal leukemic cells. After 48 hours, apoptotic effects became more pronounced. DAPI stained cells in the control culture remained fully intact with rounded nucleic acid spheres and evenly distributed sizes (Figure 3(d)). While leukemic cells cultured in the presence of tannic acid have more condensed nucleic acid aggregates and multiple components observed in a single cell (Figure 3(e)). Disintegration and dispersion of nucleic acids upon membrane rupture is also observed at the higher concentration (Figure 3(f)).The cell cycle data showed minimal interference of the cell cycle status at 10 µM of tannic acid; the cell cycle profile was similar to that in the presence of no tannic acid. However, at 100 µM of tannic acid, an observable difference was noted in cell cycle status (Figure 4). Cells were mostly arrested in the G2-phase by the end of 48 hours in 100 µM of tannic acid and a proportion of apoptic fragments in the sub-G1 phase was noted.
4. Discussion
Fractional factorial designs are known for their effectiveness in screening studies. Their significant advantage lies in the need for only a minimal number of experiments to achieve experimental goals in any large factor screening study. In this study, we demonstrated how various design resolution can be used to achieve different experimental goals. The Resolution III design, which required the most minimal number of experiments (8 experiments) for screening 7 different factors, was a good starting point for screen out main factors. However since main factors are confounded with several two-factor interactions, which can be significant in such studies, twofactor interactions are often masked behind main factor contributions, and vice versa. This limits the utility of Resolution III designs to only cases where two-factor interactions do not play a significant role. However this is often not the case in many multivariate systems. In this study, our Resolution III design identified the single most
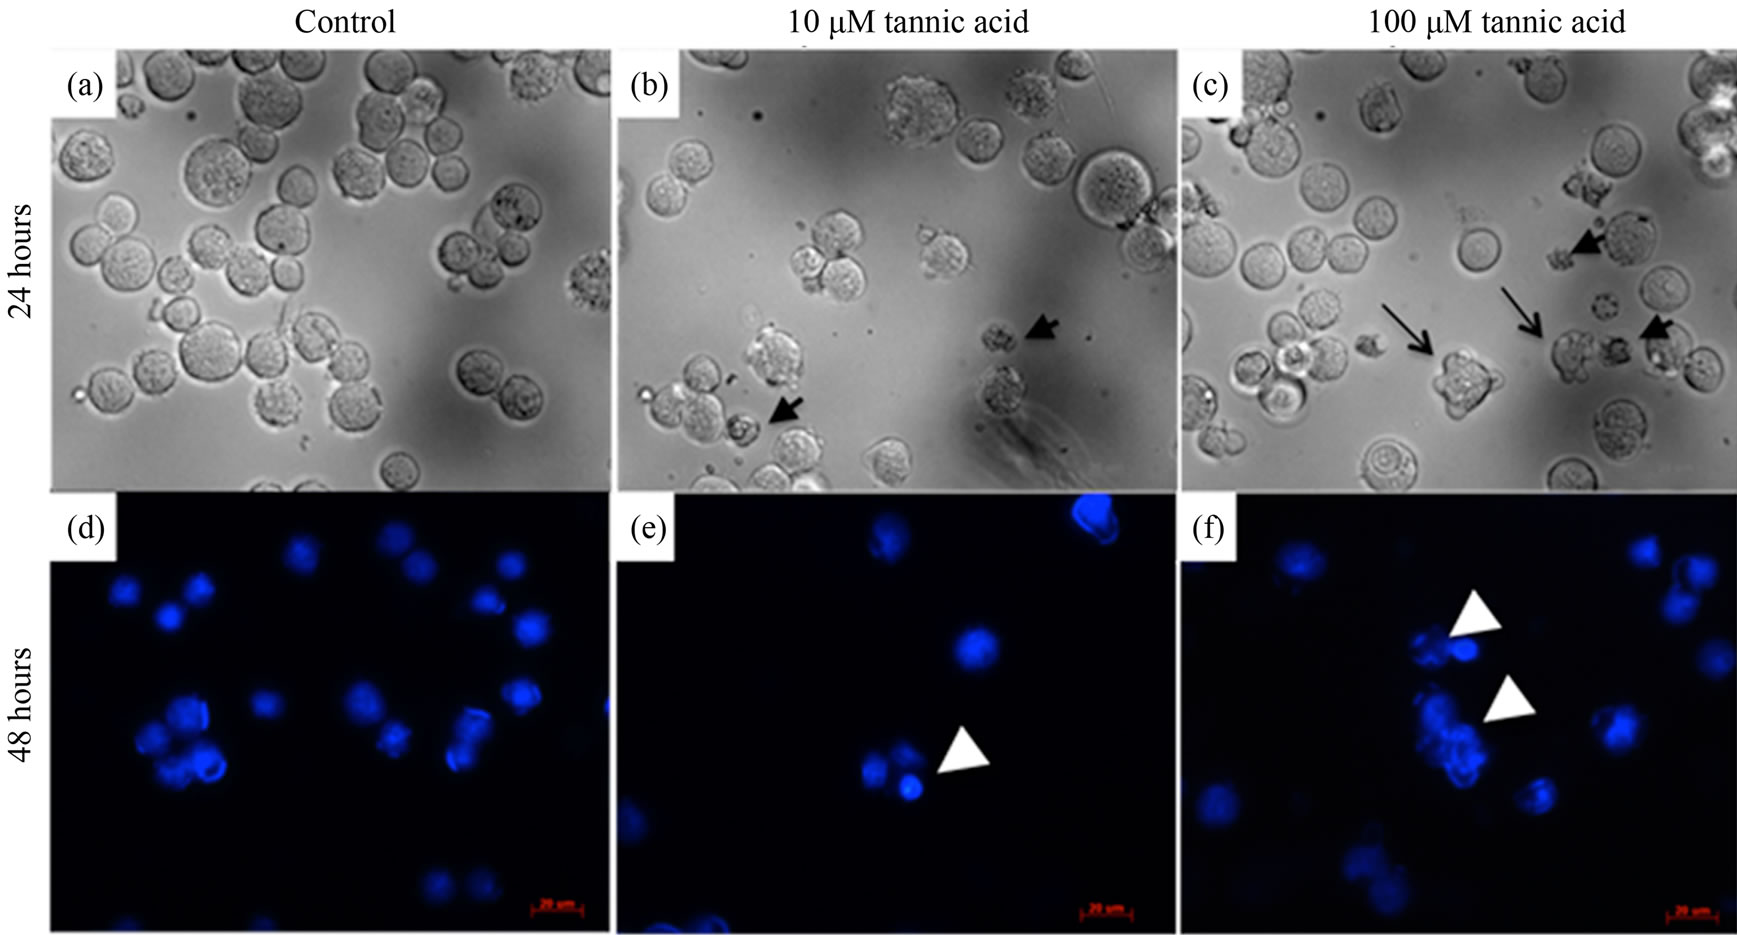
Figure 3. Morphological changes in K562 cells over 48 hours. (a) and (d) Control study: K562 cells were cultured in normal growth conditions with no tannic acid. Cell shape remained intact and spherical with DNA content confined within cell membrane even at 48 hours. (b) and (e) Cells cultured in 10 μM of tannic acid. Cell shrinkage observed at 24 hours (small black arrows). Disintegration of DNA content of a single cell into multiple fragments observed at 48 hours (white arrowhead). (c) and (f) Cells culture in 100 μM of tannic acid. Cell shrinkage (small black arrows) and blebbing of cell membrane (long tail black arrows) were observed. Disintegration of DNA into loose fragments dispersing outside the cell membrane observed (white arrowhead) at 48 hours.
Figure 4. Cell cycle status of K562 cells cultured with and without tannic acid over 48 hours evaluated at respective time intervals.
prominent effect as factor G (tannic acid), followed by factors E and F (quecertin and chrysin respectively). However we cannot conclude confidently at this point that these three factors are true main factor contributions due to their several confounding counterparts. It is often necessary for one to perform more experiments to separate main factor effects from two-factor interactions as it is not uncommon that effects from two-factor interactions can be of greater or equal strength to main effect contributions.
To improve the resolution of this design, we performed a fold-over [16] by adding more experimental points into the design matrix which leads us to a Resolution IV design. In a Resolution IV design, main factors are no longer confounded with two-factor interactions but the only task is to untangle confounding two-factor interactions. This can be achieved by careful observations of current evidence from the data before running more experiments. The Resolution IV design led us to conclude that factors G and B are the two most prominent main factor effects. For two-factor interactions, a logical approach enabled us to delineate confounding two-factor interactions to conclude factors BG and AG as “true” interaction effects. As we can see, Resolution IV designs are highly effective in singling out main factor interactions and without any additional experiments. Often, one can also easily identify contributing two-factor interactions. For this reason, the Resolution IV design is often the most favored DoE fractional factorial design used for screening factor contributions as it does not require as many experiments as a Resolution V design and is able to very effectively isolate main factors and identify highly probable two-factor interactions.
To further improve the confidence of our DoE results, we performed a semi-fold on the Resolution IV design, and this served to de-alias all two-factor interactions [17, 18]. At the same time, we can verify the validity of our two-factor interactions (BG and AG) obtained from the previous study. The improved design also produced predictive process models representing significant factor relationships. The semi-fold Resolution IV design performed in this study strengthened our conclusion of contributing factors, EGCG (B) and tannic acid (G), and their interaction (BG). Response surface model produced from this design study is not only able to highlight regions where one could maximize inhibitory effects from the tannic acid-EGCG combination but can serve as a predictive model for unexplored combinations that were not performed in previous experiments. Predictive process models are useful in guiding operating regions of combinatorial drugs/compounds of interest and provide quantitative insights into effectiveness of these treatment combinations. Other designs that can be used to produce predictive response models and interactive relationships include the central composite design and full factorial designs. One study demonstrated its use in the detection of interactive effects between several mycotoxins commonly found in food or raw materials [19]; this study highlighted the advantage of their tiered central composite design approach to effectively identify two-factor interactions and the utility of full factorial designs for factor validation. Other applications of DoE approaches have been in quantifying synergistic effects of growth factors in stem cell differentiation [20,21].
This DoE study identified a strong synergistic effect between EGCG-tannic acid combination on growth inhibition and apoptosis of K562 erythroleukemia cells. The effects of EGCG, a major component in green tea extract, has been widely reviewed and studied in many cancer cell systems [22]. Growth inhibition effects of EGCG and theaflavin, the two most common extracts in green and black teas respectively, were studied in two leukemic cell lines, K562 and HL60. Yang’s study found that the dose-dependent effects of both compounds were similar; the IC-50 values of EGCG and theaflavin were at 60 and 75 μg/mL respectively (equivalent to 130 - 150 µM). It was previously shown that cytotoxicity to leukemic cells were induced by apoptosis [2]. Effects of tannic acid as an anti-cancer agent have not been fully explored. So far one study has shown its apoptotic effects on HL60 cells were both dose and time-dependent but has no effect on the viability of normal peripheral blood cells [23]. Concentrations of tannic acid used in this study were between 0 - 25 µM with an IC-50 value of around 15 - 20 µM. A simple comparison between IC-50 values of EGCG, theaflavin, and tannic acid based on the published literature suggests that the dose effect of tannic acid is greater than EGCG or theaflavin. This conclusion is consistent with our observations and analysis from our DoE study which suggested tannic acid as a factor with greatest potency followed by EGCG. In addition, by using a DoE approach, we were able to determine and quantify combinatorial effects between these two factors and produce relevant process and interactive models describing their relationship. Our DoE study lead us to conclude that synergistic effects between tannic acid and EGCG exist and were most potent at low concentrations of tannic acid (10 - 20 µM) and high concentrations of EGCG (80 - 100 µM).
In conclusion, this study demonstrates the benefits of using a DoE approach in: 1) Rapidly identifying main effects by utilizing a small number of experiments either a Resolution III design if two-factor interactions are not significant or a Resolution IV design; 2) The DoE study was able to identify and quantify interactive effects between two bioactive constituents using very simple semifoldover techniques based on previous DoE designs performed for screening. This study showcases the versatility of DoE approaches in screening and understanding biochemical effects of plant or food constituents in vitro. Thus, DoE is a highly relevant and useful tool for studying effect combinations and predict any unforeseen or previously unexplored combinations.
REFERENCES
- M. Roy, et al., “Anticlastogenic, Antigenotoxic and Apoptotic Activity of Epigallocatechin Gallate: A Green Tea Polyphenol,” Mutation Research/Fundamental and Molecular Mechanisms of Mutagenesis, Vol. 523-524, 2003, pp. 33-41.
- T. Kundu, et al., “Induction of Apoptosis in Human Leukemia Cells by Black Tea and Its Polyphenol Theaflavin,” Cancer Letters, Vol. 230, No. 1, 2005, pp. 111-121. doi:10.1016/j.canlet.2004.12.035
- T. Otsuka, et al., “Growth Inhibition of Leukemic Cells by (−)-Epigallocatechin Gallate, the Main Constituent of Green Tea,” Life Sciences, Vol. 63, No. 16, 1998, pp. 1397- 1403. doi:10.1016/S0024-3205(98)00406-8
- I. K. Wang, S. Y. Lin-Shiau and J. K. Lin, “Induction of Apoptosis by Apigenin and Related Flavonoids through Cytochrome C Release and Activation of Caspase-9 and Caspase-3 in Leukaemia HL-60 Cells,” European Journal of Cancer, Vol. 35, No. 10, 1999, pp. 1517-1525. doi:10.1016/S0959-8049(99)00168-9
- S. J. Lee, J.-H. Yoon and K. S. Song, “Chrysin Inhibited Stem Cell Factor (SCF)/c-Kit Complex-Induced Cell Proliferation in Human Myeloid Leukemia Cells,” Biochemical Pharmacology, Vol. 74, No. 2, 2007, pp. 215-225. doi:10.1016/j.bcp.2007.04.011
- K. J. Woo, et al., “Chrysin-Induced Apoptosis Is Mediated through Caspase Activation and Akt Inactivation in U937 Leukemia Cells,” Biochemical and Biophysical Research Communications, Vol. 325, No. 4, 2004, pp. 1215- 1222. doi:10.1016/j.bbrc.2004.09.225
- Y. H. Siddique, T. Beg and M. Afzal, “Antigenotoxic Effect of Apigenin against Anti-Cancerous Drugs,” Toxicology in Vitro, Vol. 22, No. 3, 2008, pp. 625-631. doi:10.1016/j.tiv.2007.12.002
- D. Montgomery, “Design and Analysis of Experiments,” 6th Edition, Wiley, Berlin, 2005, p. 672.
- K. Hinkelmann and O. Kempthorne, “Design and Analysis of Experiments,” Advanced Experimental Design, John Wiley & Sons, Inc., Hoboken, 2005. doi:10.1002/0471709948
- J. P. Groten, E. D. Schoen and V. J. Feron, “Use of Factorial Designs in Combination Toxicity Studies,” Food and Chemical Toxicology, Vol. 34, No. 11‚ 1996, pp. 1083-1089.
- F. K. H. Phoa, H. Xu and W. K. Wong, “The Use of Nonregular Fractional Factorial Designs in Combination Toxicity Studies,” Food and Chemical Toxicology, Vol. 47, No. 9, 2009, pp. 2183-2188. doi:10.1016/j.fct.2009.06.003
- N. F. Kolachi, et al., “Multivariate Optimization of Cloud Point Extraction Procedure for Zinc Determination in Aqueous Extracts of Medicinal Plants by Flame Atomic Absorption Spectrometry,” Food and Chemical Toxicology, Vol. 49, No. 10, 2011, pp. 2548-2556. doi:10.1016/j.fct.2011.06.065
- M. Lim and A. Mantalaris, “Development of a Design of Experiment Methodology: Applications to the Design and Analysis of Experiments,” In: J. M. Polak, Ed., Advances in Tissue Engineering, Imperial College Press, London, 2008. doi:10.1142/9781848161832_0011
- R. H. Myers and D. C. Montgomery, “Two-Level Fractional Factorial Designs, in Response Surface Methodology: Process and Product Optimization Using Designed Experiments,” John Wiley & Sons, Inc., Hoboken, 2002.
- K. Hinkelmann and O. Kempthorne, “Confounding in 2n Factorial Designs, in Design and Analysis of Experiments,” John Wiley & Sons, Inc., Hoboken, 2005. doi:10.1002/0471709948.ch12
- M. J. Anderson and P. J. Whitcomb, “DOE Simplified: Practical Tools for Effective Experimentation,” 2nd Edition, Productivity Press, London, 2007, p. 241.
- R. W. Mee and M. Peralta, “Semifolding 2k-p Designs,” Technometrics, Vol. 42, No. 2, 2000, pp. 122-134.
- N. Balakrishnan and P. Yang, “De-Aliasing Effects Using Semifoldover Techniques,” Journal of Statistical Planning and Inference, Vol. 139, No. 9, 2009, pp. 3102-3111. doi:10.1016/j.jspi.2009.02.010
- O. Tajima, et al., “Statistically Designed Experiments in a Tiered Approach to Screen Mixtures of Fusarium Mycotoxins for Possible Interactions,” Food and Chemical Toxicology, Vol. 40, No. 5, 2002, pp. 685-695. doi:10.1016/S0278-6915(01)00124-7
- V. Cortin, et al., “Efficient in Vitro Megakaryocyte Maturation Using Cytokine Cocktails Optimized by Statistical Experimental Design,” Experimental Hematology, Vol. 33, No. 10, 2005, pp. 1182-1191. doi:10.1016/j.exphem.2005.06.020
- M. Lim, et al., “Optimization of in Vitro Erythropoiesis from CD34+ Cord Blood Cells Using Design of Experiments (DOE),” Biochemical Engineering Journal, Vol. 55, No. 3, 2011, pp. 154-161. doi:10.1016/j.bej.2011.03.014
- C. S. Yang, et al., “Cancer Prevention by Tea: Evidence from Laboratory Studies,” Pharmacological Research, Vol. 64, No. 2, 2011, pp. 113-122. doi:10.1016/j.phrs.2011.03.001
- K.-S. Chen, et al., “Tannic Acid-Induced Apoptosis and Enhanced Sensitivity to Arsenic Trioxide in Human Leukemia HL-60 Cells,” Leukemia Research, Vol. 33, No. 2, 2009, pp. 297-307. doi:10.1016/j.leukres.2008.08.006
NOTES
*None of the authors have any conflict of interest related to this study.
#Corresponding author.