Modern Research in Catalysis
Vol.2 No.2A(2013), Article ID:32941,8 pages DOI:10.4236/mrc.2013.22A007
Preparation of High Surface Area Mesoporous Ni2xCe1−xO2 (x = 0, 0.05, 0.13, 0.2) and Its Applications in Methane Steam Reforming
1Department of Chemical Engineering, Feng Chia University, Taichung, Chinese Taipei
2Green Energy Development Center, Feng Chia University, Taichung, Chinese Taipei
Email: *acchang@fcu.edu.tw
Copyright © 2013 Kuo-Hsin Lin et al. This is an open access article distributed under the Creative Commons Attribution License, which permits unrestricted use, distribution, and reproduction in any medium, provided the original work is properly cited.
Received April 2, 2013; revised May 2, 2013; accepted May 26, 2013
Keywords: Reverse Precipitation; Mesoporous Ceria; Steam Reforming; Nickel
ABSTRACT
The present study proposes a novel reverse precipitation procedure, which is different from the conventional precipitation method, for the synthesis of ultra high surface area mesoporous CeO2 at various conditions. Mesoporous Ni2xCe1−xO2 (x = 0.05, 0.13, 0.2) is also synthesized for use in the methane steam reforming reactions. The physicochemical properties of the catalysts and catalytic activity tests for the steam reforming of methane are also investigated. In the present study, the preparation of high surface area mesoporous CeO2 is proposed, which successfully enables control over the surface area. The results showed that the highest surface area of mesoporous ceria reached 695 m2/g. Tests on long-term catalytic activities indicated that Ni0.4Ce0.8O2 exhibited a much greater stability and activity for the steam reforming of methane than the others. Further, the present work also found that the amount of mobile oxygen increased simultaneously as the nickel content in the proposed catalysts due to the synergistic effects of structural nickel species to the oxygen vacant sites at the vicinity of the surface. Using the proposed new method, mesoporous ceria can be utilized more extensively in many ways, including as a three-way catalyst, as an electrolyte of solid oxide fuel cells, in reforming reaction, and in some other practical applications.
1. Introduction
Ceria is an oxygen conduction material due to the presence of oxygen vacant sites on its surface. Due to this unique property, it is used as a promoter in catalysts to reduce NOx emissions, as well as to convert CO to CO2. For hydrogen production processes, ceria acts as an oxygen storage/release medium that is continuously reduced and oxidized. Therefore, its reduction/oxidation capability is a key factor in many applications, such as catalysts, semiconductors, solid oxide fuel cells, optics, and cosmetics [1-10] . In addition, unlike other oxygen conductors such as ZrO2, ThO2 and Bi2O3, the fluorite structure of CeO2 is more stable at room temperature up to its melting point. Recently, many studies have used ceriasupported metal catalysts to conduct different reactions [11-14] . Especially in reforming processes, ceria is a proper material for support due to the ion conductivity. Therefore, the use of ceria as support in reforming reactions can effectively suppress coke formation and accelerate carbon combustion. The interactions between surface oxygen vacancies and reactants are considered as the key factor in coke formation in reforming reactions. Therefore, the preliminary work in the present study focuses on the enhancement of the surface area of mesoporous ceria.
Current paper develops a novel preparation for high surface area mesoporous ceria and mesoporous Ni2x Ce1−xO2 catalysts. The characterization uses thermogravimetric analysis to determine the proper calcination temperature. The morphology is determined via cold field emission scanning electron microscopy and energy dispersive spectrometry. The crystallization is analyzed using X-ray diffraction. Analysis of the surface area is done by N2 adsorption-desorption isotherms. CO2 pulse reaction is employed to evaluate the mobile oxygen species, whose amount is calculated by the formation of CO. Long-term catalytic activity tests for the steam reforming of methane over mesoporous Ni2xCe1−xO2 catalysts are also performed in the present study.
2. Experimental
2.1. Preparation of Mesoporous Ceria
The syhthesis of the mesoporous ceria was originally proposed by Terribile [15]. An uncommon method, called reverse precipitation, was employed in the current study to prepare mesoporous CeO2 materials [16]. To prepare the mesoporous material, a surfactant solution (containing 9.4 g of hexadecyltrimethyl-ammonium bromide and CTMABr (Acros), dispersed in 100 ml H2O) was slowly added into a precursor solution (containing 11.2 g CeCl3∙7H2O(s) (Aldrich) dissolved in 50 ml H2O) to form solution A. Solution A was added dropwise into ammonia solution (pH = 14, Fisher) until the expected pH value (13.1 - 13.8) was reached, then stirring continued for 2 hours at room temperature. This solution was maintained at 363 K for 90 hours under continuous stirring, which inevitably led to the quick evaporation of ammonia. The solution was cooled to room temperature by the end of the process. To obtain the mesoporous CeO2 and to remove the surfactant which is not incorporated with the oxide, the solution was filtered and washed with deionized water and acetone. The resulting spongy solid was dried in an oven at 60˚C for 24 hours and calcined at 550˚C for 5 hours (heating rate of 10˚C/min, air flow rate at 2 ml/sec).
The Ni2xCe1−xO2 (x = 0.05, 0.13, 0.2) catalysts were prepared by the same method; the precursor solution containing CeCl3∙7H2O (11.2 g) and Ni(NO3)2∙6H2O, with a corresponding molar ratio of Ni/Ce = 0.1, 0.3, 0.5 wherein the Ni/Ce molar ratio was corresponding to x= 0.05, 0.13 and 0.2, were first dissolved together in 100 ml of H2O. A surfactant solution (containing 9.4 g of CTMABr dispersed in 100 ml of H2O) was added dropwise into the precursor solution, then this solution was added slowly into ammonia solution; stirring continued for 2 hours at room temperature. The reaction time and temperature were 90 hours and 90˚C, respectively. At the end of the reaction, the solution was filtered and washed with deionized water and acetone. The resulting solid was dried at 60˚C for 24 hours and calcined at 550˚C for 5 hours (heating rate of 10˚C /min, air flow rate at 2 ml/sec).
2.2. Characterization
The prepared catalysts were characterized using thermogravimetric analysis (TA Instrument SDT2960) to determine the proper calcination temperature prior to calcination. Surface area and porosity were determined using high-resolution with using accelerated surface area and porosimetry analyzer (BET, Micromeritics ASAP 2010 analyzer). Surface morphology was determined using a cold field emission scanning electron microscope and energy dispersive spectrometer (FESEM, HITACHI S-4800). Crystallinity was determined via x-ray diffraction (XRD, SHIMADZU XRD-6000 X-ray diffractometer), and the size of the crystallite was calculated using the Scherrer equation. Field Emission Transmission Electron Microscope (FETEM, JEM 2100-F) was also used to study the morphology and the crystallite size.
The temperature-programmed reduction experiments were done on H2/Ar mixture (10% H2, 30 ml/min flow) from room temperature to 1000˚C (with 10˚C/min heating rate). A thermal conductivity detector was used to monitor the effluent gas stream. The amounts of surface mobile oxygen species were estimated by CO2 pulse reactions according to the method described by Hayakawa et al. [17] and carried out in a U-shaped quartz reactor. First, 100 mg of each sample was reduced at 800˚C for 1 hour (10% H2, 30 ml/min flow), leading to total reduction. Second, the samples were treated with CO2 (0.53 ml × 15) pulses, resulting in oxidation of the reduced support with CO2 to form CO. The amounts of mobile oxygen species were calculated from the amounts of CO formed.
2.3. Catalytic Reaction
Catalytic reactions were carried out in a fixed-bed tubular stainless steel reactor (O.D. = 12.7 mm), with 0.5 g of the catalysts placed at the center of the reactor between two quartz wool. The catalyst was diluted with 1.5 g silica sand and activated in situ at 600˚C for 1 hour before reaction. The H2O and CH4 reactants were mixed at a molar ratio of 3, with the flow rate of methane controlled at 50 ml/min. Space velocity was controlled at 6000 ml-CH4/g-hr. The effluent gas was sampled and analyzed periodically (every 7.5 min) by a gas chromatograph with a thermal conductivity detector.
Reaction was first accomplished by the temperature-programmed reaction from 400˚C to 900˚C at atmospheric pressure, and long-term activity tests were carried out at 700˚C for 24 hours under the same conditions. Mass balances were closed with deviation lower than 10%. Equations (1) and (2) present the definition of methane conversion and deactivation, respectively.
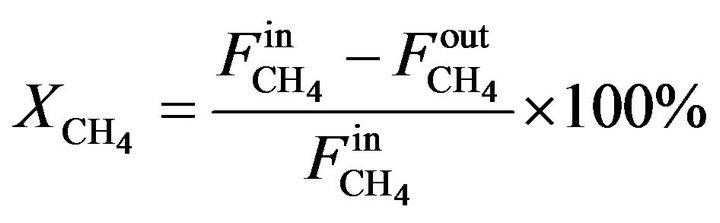 (1)
(1)
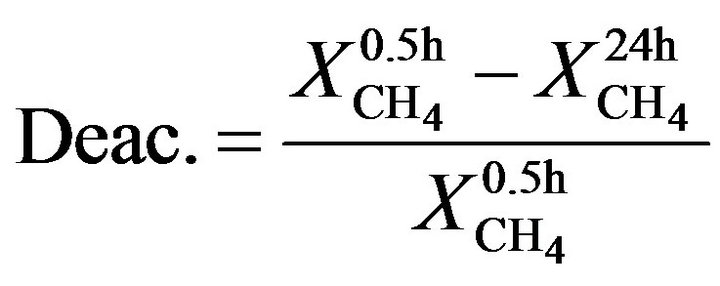 (2)
(2)
3. Results and Discussion
3.1. Characterization of Mesoporous Ceria
Preparation of the mesoporous ceria by the precipitation method was originally proposed by Terribile et al. [15], who reported that the surface area of mesoporous ceria is roughly dependent on the pH values of the synthetic solution. To increase and control the pH value of the solution accurately, the reverse precipitation process was proposed. In this process, the precursor solution was added dropwise into acid (or base), unlike in the conventional procedure. In the present work, by using the reverse precipitation method, the pH value can be easily increased and can be efficiently and precisely controlled. Table 1 shows the resulting surface area, average pore volume, and average pore size of mesoporous ceria after calcination at 550˚C. Obviously, the surface area increased with an increase in the pH values, which was in accordance with the observation of Terribile’s studies. At pH = 13.8, the surface area reached 695 m2/g, which was three times that reported in the literature [15] (231 m2/g) and four times that via the microwave-assisted solvothermal process (165 m2/g) [18]. The porosity of mesoporous ceria (pH = 13.1 - 13.8) was measured by BET nitrogen adsorption-desorption isotherms. Figure 1 shows the typical result of the isotherm for mesoporous ceria. All samples showed very clear hysteresis loops which represented the capillary condensation during the adsorption and desorption processes. In the case of high surface area samples (pH = 13.7 and 13.8), the isotherm contained the low-pressure and high-pressure regions. At the low-pressure region, the isotherms were formed by mesoporous solid and multimolecular adsorption in general; at the high-pressure region, the appearance of hysteresis loops changed along with the shape of the structure of the pores. All isotherms can also be identified as type-IV Langmuir isotherms, which represented plate-like, slit-shaped particles that can explain the hysteresis loops.
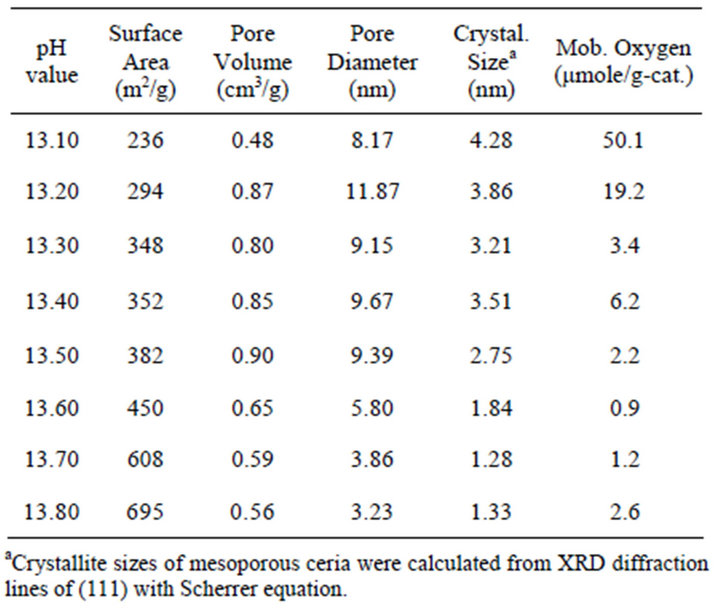
Table 1. BET analysis, crystallite size and mobile oxygen of the prepared mesoporous ceria at different pH values.
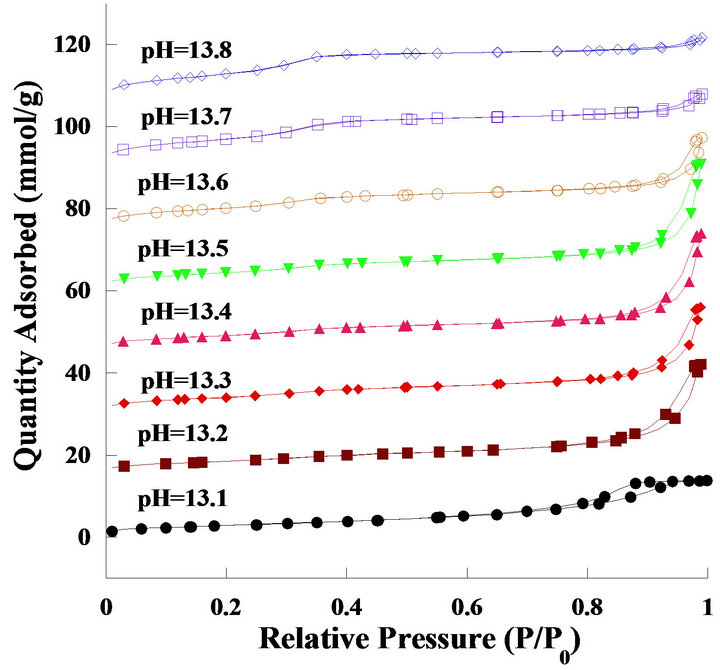
Figure 1. Nitrogen adsorption-desorption isotherms of the catalyst prepared at various pH values. The adsorptiondesorption data for pH = 13.1 to 13.8 samples are offset vertically by 0, 15, 30, 45, 60, 75, 90 and 105 mmol∙g−1, respectively.
The surfactant was found to have great availability in the preparation of the catalysts for the formation of a large internal surface area [19]. To prepare high surface area mesoporous ceria, CTMABr (surfactant) was used as template in the synthesis process. However, the surfactant had to be removed completely after the synthesis to form mesoporous ceria. Therefore, thermogravimetric analysis was employed to remove the surfacant and to determine the relationship between temperature and weight loss during calcination. In Figure 2, the thermogravimetric analysis for the sample (pH = 13.8) showed a weight loss of 25 wt% between room temperature and 1000˚C. Three peaks also appeared. The first peak appeared at 90˚C, which was 4 wt% loss that represented the vaporization of water. The second peak appeared at 220˚C, which was 9 wt% loss that indicated surfactant decomposition. The last peak presented itself at 450˚C, which was 12 wt% loss that denoted OH− condensation on the surface of ceria. After 600˚C, the structure stabilized; no obvious weight loss occurred. For another sample of ceria (pH = 13.2), the total weight loss was less than 14% after calcination between room temperature and 1000˚C (not shown). The weight loss of the low surface area sample which calcined between room temperature and 1000˚C was remarkably lower than that of the high surface area sample due to the less surfactant content in its structure. Moreover, thermal stabilization was shown to depend on OH− concentration. However, the majority of weight loss can be attributed to the removal of the surfactants. Thermal stabilization was also influenced by the use of different precipitates, such as ammonia or sodium hydroxide. The results found that the thermal stabilization of mesoporous ceria using ammonia as precipitate was higher than that using sodium hydroxide (not shown).
Figure 3 shows the X-ray diffraction patterns of mesoporous ceria. The diffraction peaks at 2 theta = 28.66, 33.11, 47.55, and 56.38 corresponded with the (111), (200), (220), and (331) planes and location of CeO2, respectively. The profiles can be indexed to standard CeO2 with a cubic fluorite structure (fcc with a = 0.541 nm, which agrees with the JCPDS data). Comparing the results of (a) through (h) in Figure 3, the main peak located at 2 theta = 28.66 became broad, indicating that the crystallite became smaller, as shown in Table 1. The average crystallite sizes of mesoporous ceria (pH values from 13.1 to 13.8) were calculated to be 4.28, 3.86, 3.21, 3.51, 2.75, 1.84, 1.28, and 1.33 nm, respectively. The main peak of (a), with a narrowing diffraction peak, indicated strong crystallization with sample (a), suggesting its small surface area. The other peaks (200, 220, and 311) gradually disappeared with an increase in the pH values, which was in accordance with the increment in surface area determined by BET analysis. Furthermore, it seems that the stronger (111) peak induced higher amounts of mobile oxygen species. This perhaps can be explained by its structural order as well as surface area.
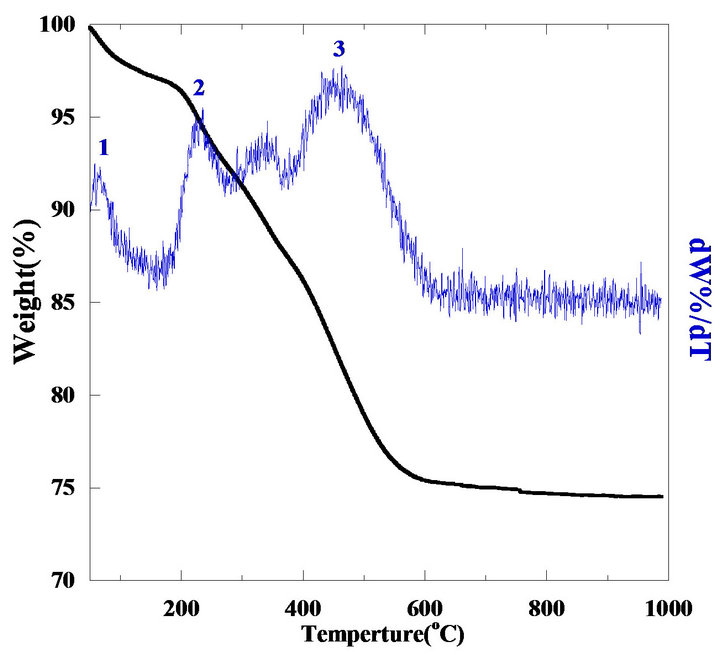
Figure 2. Thermogravimetric analysis of the sample prepared at pH = 13.8.
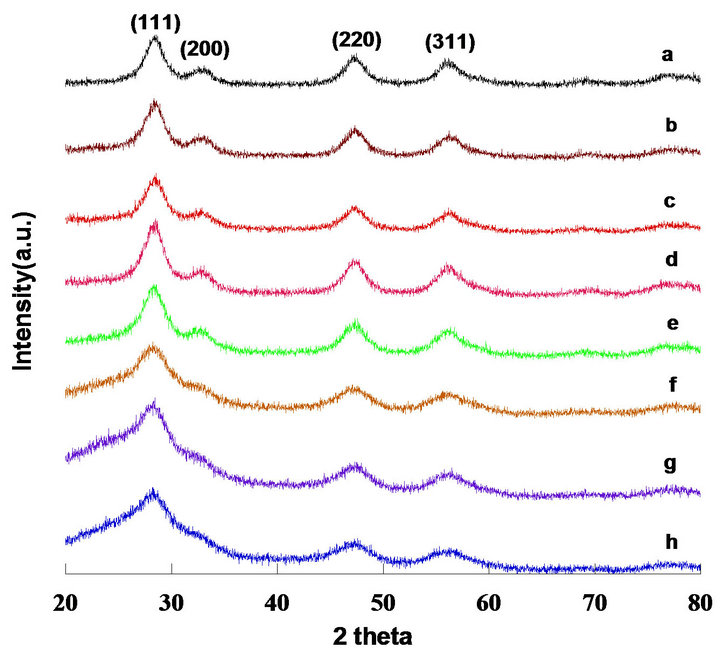
Figure 3. X-ray diffraction patterns of mesoporous ceria prepared with different pH values and calcined at 823K; (a) pH = 13.1; (b) pH = 13.2; (c) pH = 13.3; (d) pH = 13.4; (e) pH = 13.5; (f) pH = 13.6; (g) pH = 13.7; (h) pH = 13.8.
Mobile oxygen was not only the suppressor that inhibited coke formation, but it also acted as the promoter that improved catalytic activity in many reactions. CO2 pulse reaction was carried out to estimate the amounts of mobile oxygen. Test was terminated when no CO peak can be observed from the TCD. The quantity of mobile oxygen was calculated by the formation of CO. Table 1 shows the amounts of mobile oxygen and crystallite size of mesoporous ceria. The amounts of mobile oxygen increased with an increase in crystallite size due to the stronger fluorite structure (seen in XRD results) as well as lower surface area, agreeing with the previous results.
Figure 4 presents the FESEM image of mesoporous ceria prepared via reverse precipitation. Several irregular pores were formed by the agglomerated powders. In Table 1, the average pore size of the sample prepared at pH = 13.4 was 9.67 nm. In Figure 4, the size of the pores was distinctly larger than this value. Consequently, the ceria proposed in the present work might be plate-like particles forming slit-shaped inkbottles, in agreement with the nitrogen adsorption-desorption isotherms.
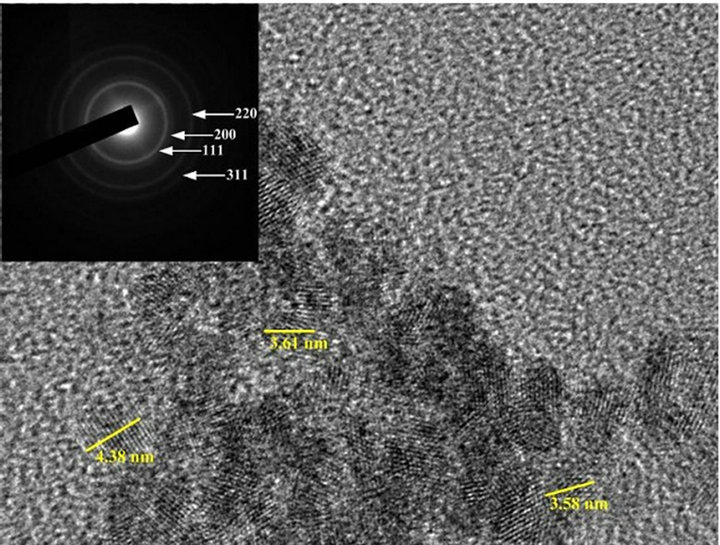
TEM images of mesoporous ceria and Ni0.4Ce0.8O2 catalysts are shown in Figure 5. Figures 5(a)-(c) show the images of the mesoporous ceria prepared at pH = 13.1, 13.6 and 13.8, respectively. The sample prepared at pH = 13.1 exhibited not only the bigger crystallite size but also the stronger crystallization than the others. Again, the crystallite size calculated from the images is also consistence with the results of XRD. The d-spacing calculated from the diffraction pattern of the mesoporous ceria is in good agreement with the JCPDS data (No. 43-1002). As expected, the images show that the higher surface area sample displayed much more amorphous ceria arrangement. Again, this observation was consistent with the results of XRD that can explain the amounts of mobile oxygen. Besides, it show that only particles but no pores can be seen in all images, which was in accordance with the observation of Terribile’s studies [15].
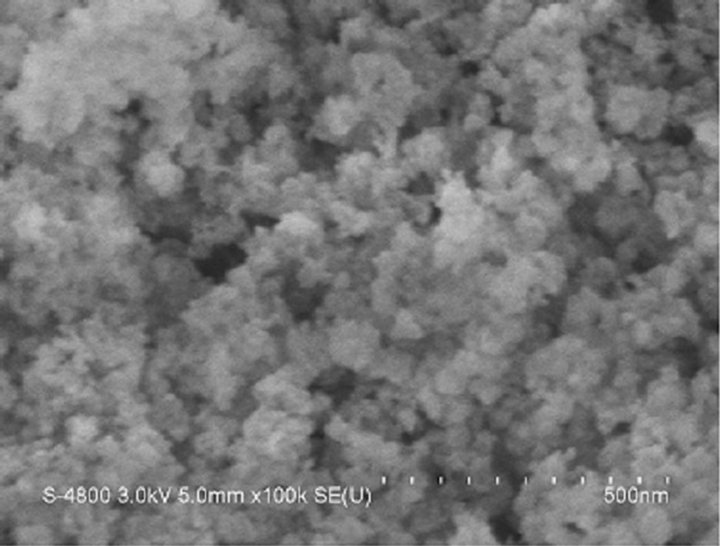
Figure 4. FESEM image of mesoporous CeO2 prepared at pH = 13.4.
 (a)
(a)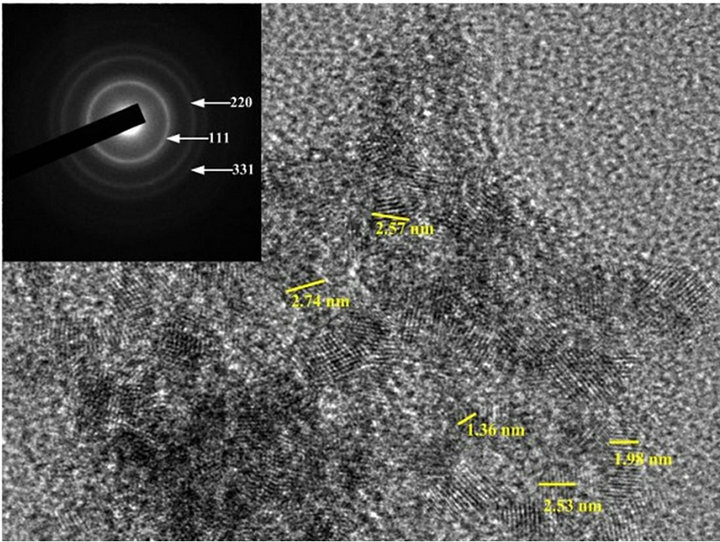 (b)
(b)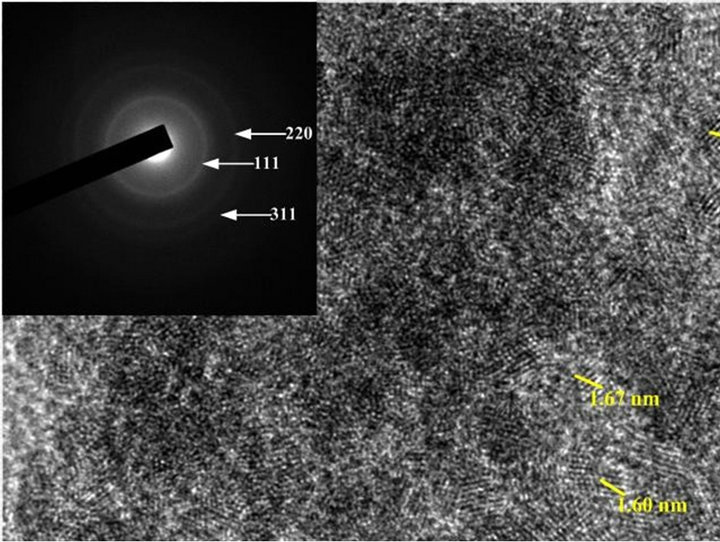 (c)
(c)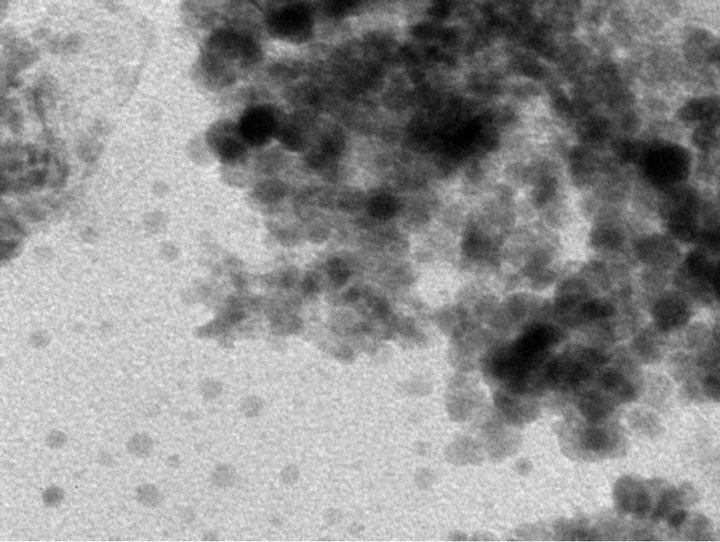 (d)
(d)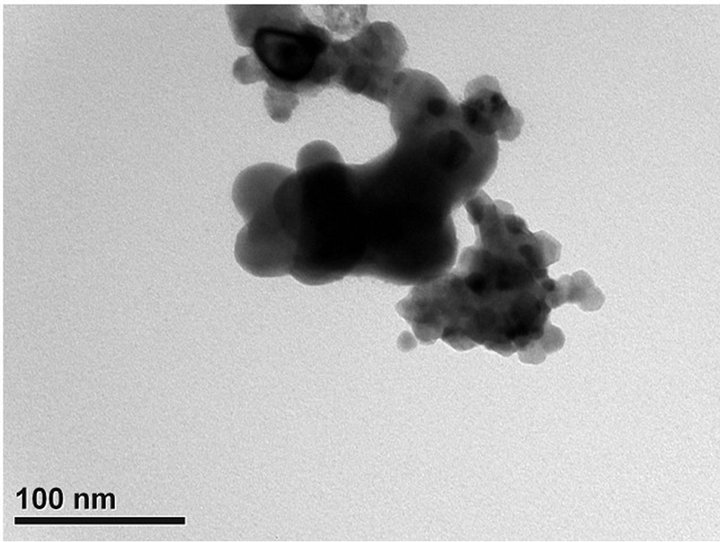 (e)
(e)
Figure 5. TEM images of (a) mesoporous CeO2 prepared at pH = 13.1; (b) mesoporous CeO2 prepared at pH = 13.6; (c) mesoporous CeO2 prepared at pH = 13.8; (d) mesoporous Ni0.4Ce0.8O2-fresh; (e) mesoporous.
According to the results of BET isotherm, SEM and TEM, it supposed that the high surface area ceria should be composed of tiny nano particles, which agglomerated regularly (depend on pH value) and then formed the mesoporous structure.
3.2. Characterization and Catalytic Activity Tests of Ni2xCe1−xO2 (x = 0.05, 0.13, 0.2)
Figure 6 shows the nitrogen adsorption-desorption isotherms of the catalysts and typical type IV Langmuir isotherms represented as similar to mesoporous ceria. By increasing the molar ratio of Ni to Ce, the hysteresis loop became more horizontal, demonstrating that the pores were made by the agglomeration of much more irregular particles. Table 2 shows the BET analysis and mobile oxygen of Ni2xCe1−xO2 catalysts. The amounts of mobile oxygen for the catalysts (x = 0.05, 0.13, 0.2) were 403, 446, and 386 μmole/g, respectively. The evaluation was
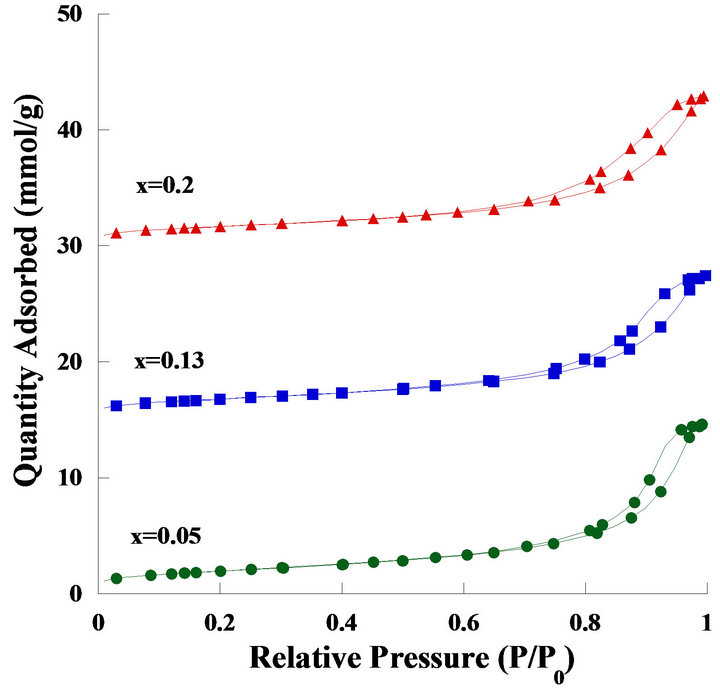
Figure 6. Nitrogen adsorption-desorption isotherms of the Ni2xCe1−xO2 catalysts, the three samples were offset vertically by 0, 15 and 30 mmol∙g−1, respectively.
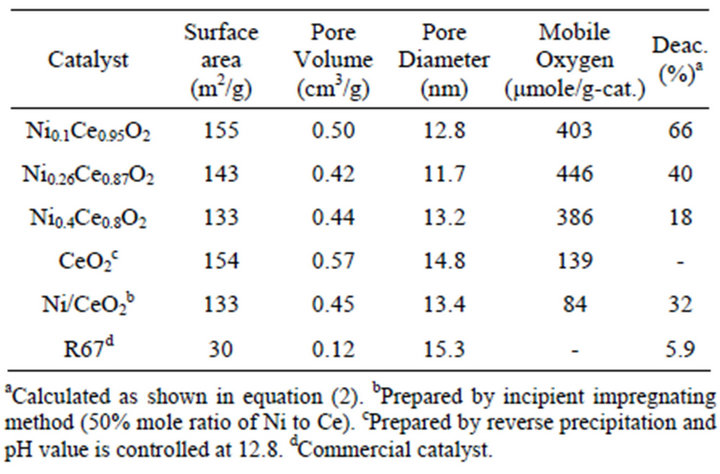
Table 2. BET analysis, amounts of mobile oxygen and deactivation for Ni2xCe1−xO2 (x = 0.05, 0.13 and 0.2) catalysts.
calculated by CO2 pulse reaction, and all tests were carried out in 15 pulses of CO2. The amounts of mobile oxygen for the catalysts were exceptionally higher than those of mesoporous ceria supposed by the co-interaction of surface nickel species to cerium. Besides, a comparative mesoporous Ni/CeO2 catalyst is also prepared by incipient impregnation method and its Ni to Ce ratio is controlled at 50%. The BET results showed reasonably between Ni/CeO2 and CeO2 catalyst. After Ni impregnating, its surface area, pore volume and pore size were reduced slightly. Furthermore, according to the BET results Ni/CeO2 and Ni0.4Ce0.8O2 catalyst showed similarly morphology.
The TPR profile is shown in Figure 7. Ni0.1Ce0.95O2 catalyst showed two peaks at around 335˚C and 630˚C, labeled as peak 1 and peak 2, which were attributed to the reduction of Ni+3 and Ni+2 on the surface, and Ni+2 reduction in the structure [20,21] . For the other two high nickel content catalysts, an extra reduction peak (labeled as peak 3) was observed in the temperature range of 350˚C - 470˚C. The extra peak was supposed to be attributed to the reduction in bonding of the weak nickel species in the structure, leading to the formation of metallic nickel. The area of peak 3 indicated that the amounts of reduced weak nickel species bonding in the structure enhanced the surface mobile oxygen species. The position of peak 2 shifted to a lower temperature, and its area decreased simultaneously with the increased nickel content; this result was deduced from the synergistic effects of structured nickel species on oxygen vacant sites at the vicinity of the surface. For the Ni/CeO2 catalyst, it showed a very strong peak at 460˚C, which was attributed to Ni+2. It indicated that NiO should be the major nickel species.
Figure 8 shows the XRD patterns of Ni2xCe1−xO2
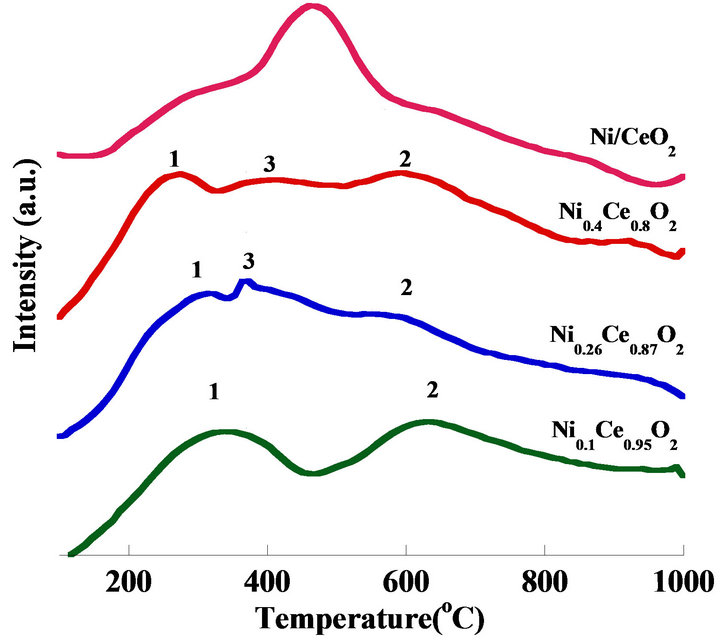
Figure 7. TPR patterns of mesoporous Ni2xCe1−xO2 and Ni/CeO2 catalysts.
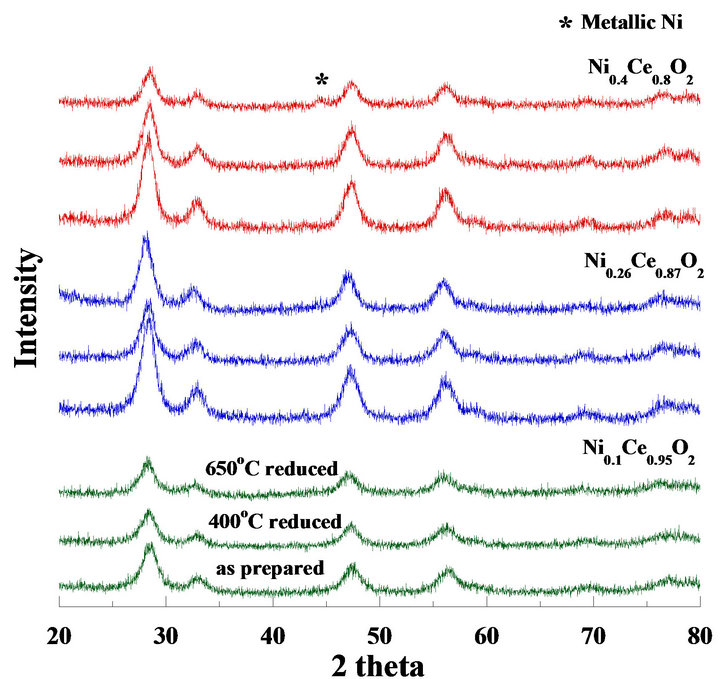
Figure 8. XRD patterns of mesoporous Ni2xCe1−xO2 catalysts, where the catalysts was calcined at 550˚C (as prepared), reduced at 400˚C and 650˚C, respectively.
catalysts calcined at 550˚C and reduced at 400˚C and 650˚C for 2 hours, respectively. After being reduced at 650˚C, only the Ni0.4Ce0.8O2 pattern exhibited a weak peak (occurring at 2 theta = 44) which corresponded to metallic Ni particles. Therefore, the Ni0.4Ce0.8O2 catalyst may possess more nickel content at the surface. The nickel species became metallic particles after treatment with H2 at 650˚C, agreeing with the TPR results. The crystallite size of metallic nickel was 12.9 nm, which was calculated by the Scherrer equation. No metallic nickel peaks occurred for the other catalysts (x = 0.05 and 0.13) due to the lower nickel content at the surface. Similar results were also found in our previous study ADDIN EN.CITE ADDIN EN.CITE.DATA [21] .
Temperature programming reforming reactions were carried out from 400˚C to 900˚C to evaluate the effects of temperature. CH4 conversion was highly influenced by the increasing temperature; conversion was achieved to a maximum value at 700˚C (not shown). Therefore, the catalytic activities tests were studied at 700˚C for 24 hours, and the feed concentration was fixed at 3 (H2O:CH4). Figure 9 shows the CH4 conversion of the Ni2xCe1−xO2 (x = 0.05, 0.13, 0.2), Ni/CeO2 and R67 catalysts in 24 hours. The Ni0.4Ce0.8O2 catalyst showed the highest CH4 conversion after reacting at 24 hours except R67. All the catalysts initially exhibited high activities; however, the activities of Ni0.1Ce0.95O2, Ni0.26Ce0.87O2, and Ni/CeO2 extremely dropped in 5 hours. After reacting for 24 hours, the deactivations of Ni0.1Ce0.95O2, Ni0.26Ce0.87O2, Ni0.4Ce0.8O2, Ni/CeO2 and R67 were 66%, 40%, 18 %, 32% and 5.9%, respectively. Since Ni0.4Ce0.8O2 and Ni/CeO2 catalysts possessed similar morphology and nickel contents, the results of long-term catalytic activity tests demonstrated the reverse precipitation method is much better for the
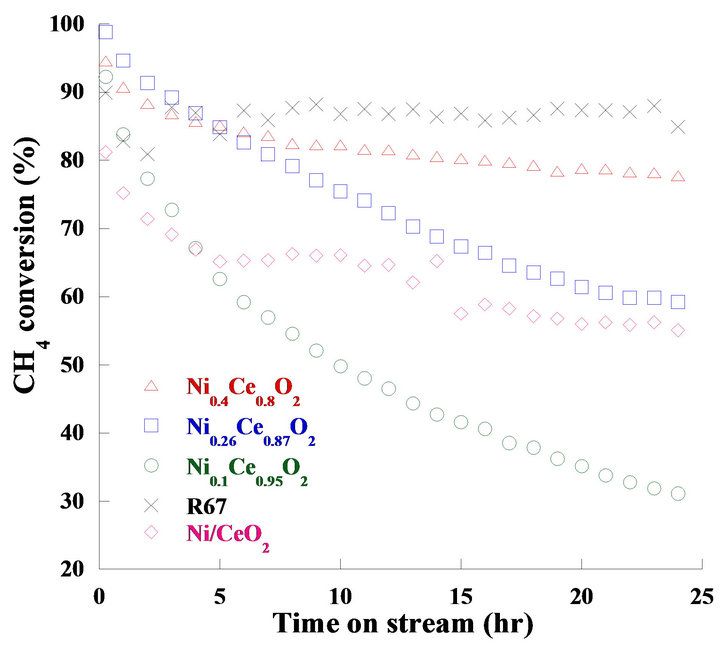
Figure 9. CH4 conversion of the long-term catalytic activity tests.
nickel/ceria system due to its better activity and stability for the methane steam reforming reactions.
TEM images of the fresh/used Ni0.4Ce0.8O2 were shown in Figures 5(d) and (e). For the fresh one, there were many tiny particles with an average particle size of about 10 nm. After the catalytic test (Figure 5(e)), it showed only part of the particles agglomerated which leading to the less deactivation loss. The better performance of the Ni0.4Ce0.8O2 catalyst was speculated to have been influenced by the following: 1) the higher nickel content in the catalyst allowed more active sites that can react with reactants and suppress the coke deposition leading to the lower deactivation; 2) the enhancement of mobile oxygen was produced by the defects in or the synergistic effects of the fluorite structure.
4. Conclusion
The present study proposed a novel method to prepare high surface area CeO2, which successfully enables control over the surface area. The optimized specific surface area and the pore diameter reached 695 m2/g and 3.23 nm, respectively, in which was closed to the micropore (<2 nm). Therefore, the pore size of the prepared material can be controlled very closely to the micro pore. TEM and BET results showed that a great many of nano ceria particles agglomerated regularly and formed the mesoporous structure, leading to the similar pore size and particle size. Ni0.4Ce0.8O2 catalysts exhibited good activity in the steam reforming of methane. The CO2 pulse reaction and TPR results indicated that the enhancement in nickel content in the structure can increase the surface mobile oxygen species, which can facilitate the catalytic activity in the steam reforming of methane. With the use of this new method, the applications of mesoporous ceria can become more extensive in a number of fields, including as three-way catalysts, as electrolytes of fuel cells, in reforming reactions, and in some other practical applications. In future studies, the authors aim to perform the same process using other type of base metals as active sites in steam reforming or in other processes.
5. Acknowledgements
The authors like to thank for the financial support of this study from National Science Council of the Republic of China under the contract No. NSC 101-2623-E-035- 001-ET and Feng Chia University (under contract No. FCU-09G27102 and -10G27101) are highly acknowledged.
REFERENCES
- C. Lamonier, A. Ponchel, A. D’Huysser, L. JalowieckiDuhamel, “Studies of the Cerium-Metal-Oxygen-Hydrogen System (Metal = Cu, Ni),” Catalysis Today, Vol. 50, No. 2, 1999, pp. 247-259. doi:10.1016/S0920-5861(98)00507-0
- J. G. Li, T. Ikegami, J. H. Lee and T. Mori, “Characterization and Sintering of Nanocrystalline CeO2 Powders Synthesized by a Mimic Alkoxide Method,” Acta Materialia, Vol. 49, No. 3, 2001, pp. 419-426. doi:10.1016/S1359-6454(00)00327-X
- S.-D. Kim, I.-S. Hwang, H.-M. Park, J.-K. Rhee, C.-W. Nam, “Chemical Mechanical Polishing of Shallow Trench Isolation Using the Ceria-Based High Selectivity Slurry for Sub-0.18 μm Complementary Metal Oxide Semiconductor Fabrication,” Journal of Vacuum Science & Technology B: Microelectronics and Nanometer Structures, Vol. 20, No. 3, 2002, pp. 918-923. doi:10.1116/1.1475984
- E. P. Murray, T. Tsai and S. A. Barnett, “A DirectMethane Fuel Cell with a Ceria-Based Anode,” Nature, Vol. 400, No. 6745, 1999, pp. 649-651. doi:10.1038/23220
- B. C. H. Steele, “Fuel-Cell Technology: Running on Natural Gas,” Nature, Vol. 400, No. 6745, 1999, pp. 619-621. doi:10.1038/23144
- B. Elidrissi, M. Addou, M. Regragui, C. Monty, A. Bougrine and A. Kachouane, “Structural and Optical Properties of CeO2 Thin Films Prepared by Spray Pyrolysis,” Thin Solid Films, Vol. 379, No. 1-2, 2000, pp. 23-27. doi:10.1016/S0040-6090(00)01404-8
- S. Yabe and T. Sato, “Cerium Oxide for Sunscreen Cosmetics,” Journal of Solid State Chemistry, Vol. 171, No. 1-2, 2003, pp. 7-11. doi:10.1016/S0022-4596(02)00139-1
- R. Li, S. Yabe, M. Yamashita, S. Momose, S. Yoshida, S. Yin and T. Sato, “Synthesis and UV-Shielding Properties of ZnOand CaO-doped CeO2 via Soft Solution Chemical Process,” Solid State Ionics, Vol. 151, No. 1-4, 2002, pp. 235-241. doi:10.1016/S0167-2738(02)00715-4
- S. Yabe, M. Yamashita, S. Momose, K. Tahira, S. Yoshida, R. Li, S. Yin and T. Sato, “Synthesis and UVShielding Properties of Metal Oxide Doped Ceria via Soft Solution Chemical Processes,” International Journal of Inorganic Materials, Vol. 3, No. 7, 2001, pp. 1003-1008. doi:10.1016/S1466-6049(01)00198-2
- M. Yamashita, K. Kameyama, S. Yabe, S. Yoshida, Y. Fujishiro, T. Kawai and T. Sato, “Synthesis and MicroStructure of Calcia Doped Ceria as UV Filters,” Journal of Materials Science, Vol. 37, No. 4, 2002, pp. 683-687. doi:10.1023/A:1013819310041
- D. Gamarra, C. Belver, M. Fernández-García and A. Martínez-Arias, “Selective CO Oxidation in Excess H2 over Copper-Ceria Catalysts: Identification of Active Entities/ Species,” Journal of the American Chemical Society, Vol. 129, No. 40, 2007, pp. 12064-12065. doi:10.1021/ja073926g
- N. Laosiripojana, D. Chadwick and S. Assabumrungrat, “Effect of High Surface Area CeO2 and Ce-ZrO2 Supports over Ni Catalyst on CH4 Reforming with H2O in the Presence of O2, H2, and CO2,” Chemical Engineering Journal, Vol. 138, No. 1-3, 2008, pp. 264-273. doi:10.1016/j.cej.2007.05.035
- N. Laosiripojana and S. Assabumrungrat, “Catalytic Dry Reforming of Methane over High Surface Area Ceria,” Applied Catalysis B: Environmental, Vol. 60, No. 1-2, 2005, pp. 107-116. doi:10.1016/j.apcatb.2005.03.001
- G. Wrobel, C. Lamonier, A. Bennani, A. D’Huysser and A. Aboukaïs, “Effect of Incorporation of Copper or Nickel on Hydrogen Storage in Ceria,” Journal of the Chemical Society, Faraday Transactions, Vol. 92, No. 11, 1996, pp. 2001-2009. doi:10.1039/ft9969202001
- D. Terribile, A. Trovarelli, J. Llorca, C. de Leitenburg and G. Dolcetti, “The Synthesis and Characterization of Mesoporous High-Surface Area Ceria Prepared Using a Hybrid Organic/Inorganic Route,” Journal of Catalysis, Vol. 178, No. 1, 1998, pp. 299-308. doi:10.1006/jcat.1998.2152
- S. A. Hassanzadeh-Tabrizi, M. Mazaheri, M. Aminzare and S. K. Sadrnezhaad, “Reverse Precipitation Synthesis and Characterization of CeO2 Nanopowder,” Journal of Alloys and Compounds, Vol. 491, No. 1-2, 2010, pp. 499- 502. doi:10.1016/j.jallcom.2009.10.243
- T. Hayakawa, S. Suzuki, J. Nakamura, T. Uchijima, S. Hamakawa, K. Suzuki, T. Shishido and K. Takehira, “CO2 Reforming of CH4 over Ni/Perovskite Catalysts Prepared by Solid Phase Crystallization Method,” Applied Catalysis A: General, Vol. 183, No. 2, 1999, pp. 273-285. doi:10.1016/S0926-860X(99)00071-X
- Z. Miroslaw, “Preparation and Characterization of Ceria Nanoparticles by Microwave-Assisted Solvothermal Process,” Journal of Alloys and Compounds, Vol. 454, No. 1-2, 2008, pp. 347-351. doi:10.1016/j.jallcom.2006.12.078
- C. T. Kresge, M. E. Leonowicz, W. J. Roth, J. C. Vartuli and J. S. Beck, “Ordered Mesoporous Molecular Sieves Synthesized by a Liquid-Crystal Template Mechanism,” Nature, Vol. 359, No. 6397, 1992, pp. 710-712. doi:10.1038/359710a0
- Y.-S. Seo, Y.-S. Jung, W.-L. Yoon, I.-G. Jang and T.-W. Lee, “The Effect of Ni Content on a Highly Active NiAl2O3 Catalyst Prepared by the Homogeneous Precipitation Method,” International Journal of Hydrogen Energy, Vol. 36, No. 1, 2011, pp. 94-102. doi:10.1016/j.ijhydene.2010.09.082
- K.-H. Lin, H.-F Chang and A. C. C. Chang, “Biogas Reforming for Hydrogen Production over Mesoporous Ni2xCe1−xO2 Catalysts,” International Journal of Hydrogen Energy, Vol. 37, No. 20, 2012, pp. 15696-15703. doi:10.1016/j.ijhydene.2012.03.130
NOTES
*Corresponding author.