Open Journal of Applied Sciences
Vol. 3 No. 1 (2013) , Article ID: 29431 , 6 pages DOI:10.4236/ojapps.2013.31007
A Comparison of Methods to Verify Energy-Saving Benefits for Chillers
National Taipei University of Technology, Taipei, China
Email: rasheed0701@hotmail.com
Received October 12, 2012; revised November 25, 2012; accepted December 2, 2012
Keywords: Chiller; ESCO; COP; Regression Analysis
ABSTRACT
The simulation model for performance of chiller (ASHRAE model in this study) disclosed in ASHRAE Guideline 14 in 2002 is implemented in Taiwan to verify the efficiency of energy-saving methods adopted by energy service companies (ESCO). Since the accuracy of the simulation model for performance of chillers has influenced on the promotion of the ESCO business, the author used practical measurement data to compare the accuracy between the ASHRAE model and the commonly used energy consumption model of chillers (XY model in this study) and concluded that the XY model had much higher accuracy than the ASHRAE model.
1. Introduction
As industry and business thrive in Taiwan and technology changes swiftly, national income and living quality have improved substantially and “energy” plays an indispensable role. Energy has a close connection with the environment and economy, including national security, economic development and daily life of people, and, thus, can be considered the locomotive of economic development and social progress. According to the Bureau of Energy, Ministry of Economic Affairs, annual energy demand has increased in the past two decades, from 88,445,786 kl oil equivalent in 1997 to 146,279,087 kl oil equivalent in 2007 (Figure 1) [1]. Crude oil occupies the largest pie in the total supply. For a country which heavily depends on energy, economic development is often restricted by energy supply. A shortage of energy supply will have a huge impact on national development as well as industry, business, transportation and daily life. Taiwan has limited indigenous energy due to its geographical characteristics and 98% of energy is imported. As a result, developing new energy resources to decrease import of energy is a must. More important is to elevate energy utilization efficiency.
Taiwan, located in a subtropical area, is hot and humid in summer, and the demand for air conditioning is huge. Air conditioning equipment covers window air conditioners, packaged air conditioners, interior blowers and central air conditioning systems. In Taiwan, air conditioners make up 30% [2] of energy consumption in summer and even reach 40% [2] at peak load. The most crucial equipment of a central air conditioning system is the chiller, which makes up 60% [2] of energy consumption of the system. Accordingly, how to lower energy consumption costs and elevate energy efficiency is an important issue in the reduction of energy consumption and relief of global warming. This study aims to verify the energy-saving benefits of chillers and compares the accuracy between the ASHRAE model and XY model using regression analysis to provide a reliable verification tool of the energy-saving mechanism in ESCO.
Regression Analysis Method is selected to verify the relationship between flow rate and differential pressure through the experimental figures. Such relationship will then be applied in determining the flow rate of  water system for establishing a flow rate determining alternative which is much lower in cost and more convenient in information acquisition. The experiment is conducted with a Mini-sized
  System for which, the Pressure Transmitter and the Paddle Wheel Flow Meter are mounted next to the Condenser of the Chiller as well as at the inlet/outlet ends of the
  Case and the Pump respectively. In the meantime, a record is also maintained for the values when the pump,
  Case and Condenser are operated under varied servicing conditions such as single pump operation, multi-pump tie-up operation and multi-pump varied-frequency operation, etc. Consequentially, actual figures are based to develop the model for investigating the relationship between differential pressure and flow rate and for analyzing the
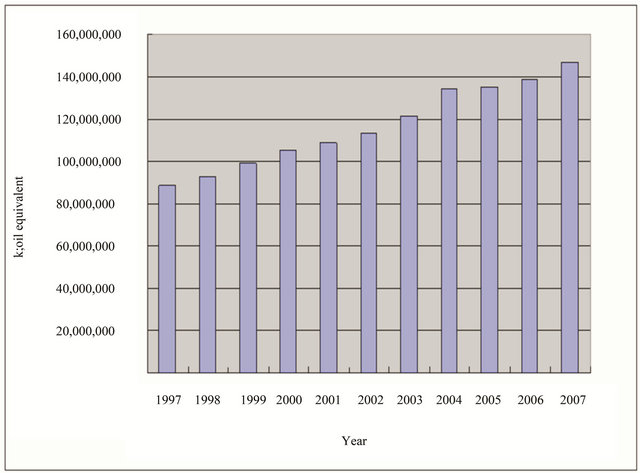
Figure 1. The annual volume of energy supply in Taiwan.
result [3].
2. Experimental Methods
2.1. ASHRAE Model [4]
ASHRAE issued Guideline No. 14 for assessing the energy efficiency of on-site chiller units in 2002. The return temperature of cooling water, the outlet temperature of chilled water and refrigeration tons of load were continuously measured and generated the water-side parameter. The data was further generalized to produce the performance formula of the tested chiller as the basis for assessing energy consumption. ASHRAE Guideline No. 14 refers to two performance simulation models of the chiller. One is the simple model. Another is the temperature-related model. The simple model was used when the return temperature of cooling water and the supply temperature of chilled water remained the same. Since the on-site return and supply temperature of cooling water was influenced by the exterior wet-bulb temperature, the temperature-related mode was adopted in the study (i.e. ASHRAE model). The detailed description is as below:
1) Simple Model
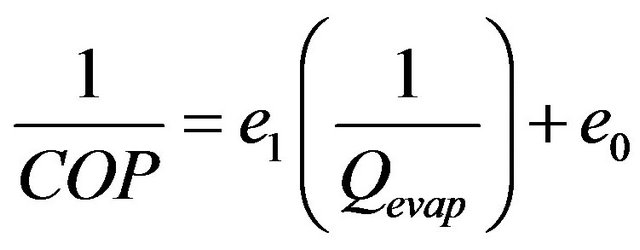 (1)
(1)
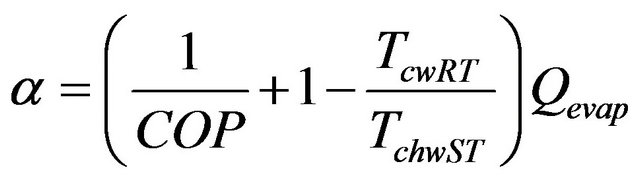
2) Temperature-related Model
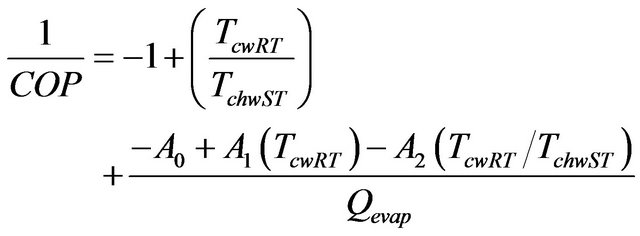 (2)
(2)
In the equation:
COP = The coefficient performance of chiller
 = The return temperature of cooling water (K)
 = The supply temperature of chilled water (K)
 = The refrigerating capacity of chiller (kW)
 = The coefficient of chiller If defined,
 (3)
(3)
the measurement data was used to make the relationship diagram of α to and  many parallel straight lines could be found in the figure. All straight lines corresponded to the same cooling temperature and the slope of the straight line group was the coefficient A2. Coefficient A2 is computed through the way.
If further defined,
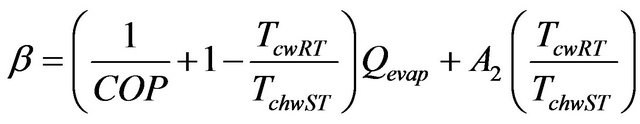 (4)
(4)
the measurement data was used to make the relationship diagram of β to  and all data points converged to a single straight line. The slope of straight line was coefficient A1 and the intercept was the coefficient A0. A1 and A0 was computed through the way.
2.2. XY Model [5]
The model which is commonly seen in the studies related to the energy consumption of chillers is the quadratic equation in the Equation (5), and the energy consumption of a chiller is shown as below:
 (5)
(5)
 : The regression coefficient;
X: The difference between the return temperature of cooling water and the supply temperature of chilled water;
Y: Partial load ratio (PLR).
3. Case Study
The data obtained by measuring the supply and return temperature of chilled water, supply and return temperature of cooling water, chilled water flow and the power dissipation of the chiller on the site were used to establish the energy consumption model of the chiller unit and predict the energy consumption on the same baseline. The air conditioning system had three centrifugal chillers: one 250-ton and two 400-ton machines. Each machine is equipped with a 20HP pump. The experiment was conducted in spring so the load of the air conditioning was less. A 250-ton chiller alone could support the air conditioning of the entire building. So, the 250-ton machine was chosen for the measurement to collect the operation data from January 24 to March 11, 2006. The data was collected on a one-minute-one-data basis and averaged into one data every 10 min, 20 min, 30 min, 1 hr, 2 hr, 3 hr and per day. The XY model and ASHRAE model methods were used for modeling and the accuracy of both methods was compared. Table 1 shows the distribution of modeling data from January 24 to March 11, 2006. All variables were within the scope of the modeling data to avoid errors resulting from any decline in accuracy. Tables 2(a) and 2(b) shows the regression coefficient of the XY model.
Generally, when the coefficient R2 reaches 0.95, the data is considered accurate and reliable. Table 2 demonstrates that the R2 of the XY model is more than 0.99, showing high accuracy, while R2 of the ASHRAE model is only 0.94 a shown in Table 3.
The data was substituted in the XY model and ASHRAE model to compute the simulated energy consumption and the average error of the actual and simulated energy consumptions. The result is shown in Table 4. It is obvious that the average error of the XY model is much less than the average error of the ASHRAE model.
Table 5 is the data collected from March 12 to 14, 2006. The data was substituted in the XY model and ASHRAE model to compare the accuracy of the predicted energy consumption. The average error of the actual energy consumption and simulated energy consumption is shown in Table 6, and it is obvious that the average error of the prediction in the XY model is less than 0.8% and the average error of the prediction in the ASHRAE model is approximately 3%. Hence, the predicted energy consumption of the XY model is more accurate than that of the ASHRAE model.
Figure 2 is the comparison of actual and simulated energy consumption between the two models from March 12 to 14 (based on one data every 2 hours). It shows clearly that the predicted energy consumption of the XY model almost overlapped with the actual energy consumption with high accuracy, and the ASHRAE model has more errors.
4. Conclusions
The energy saving of air conditioners is a heated issue
Table 1. The distribution of modeling data.

Table 2. (a) The regression coefficient of the XY model (1 min - 30 min); (b) The regression coefficient of the XY model (1 hr - 1 day).
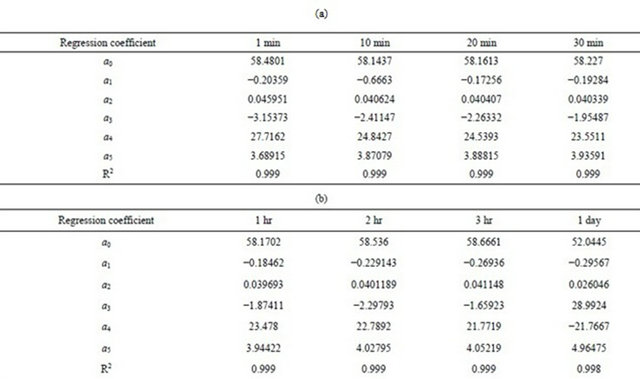
Table 3. The regression coefficient of the AS HRAE model.
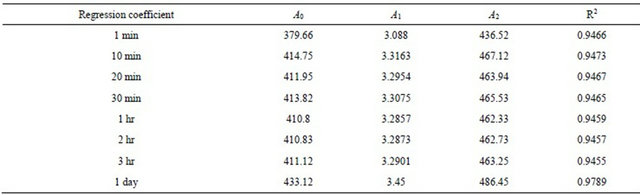
Table 4. The comparison of the average modeling errors between the XY model and ASHRAE model.

Table 5. The measurement range from 3/12 to 3/14.
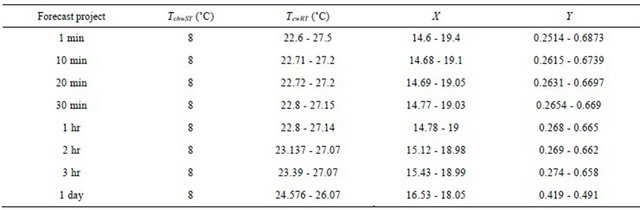
Table 6. The comparison of the average prediction errors between the XY model and ASHRAE model.
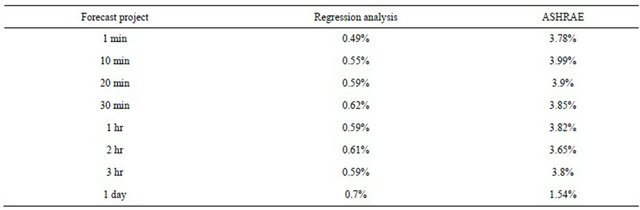
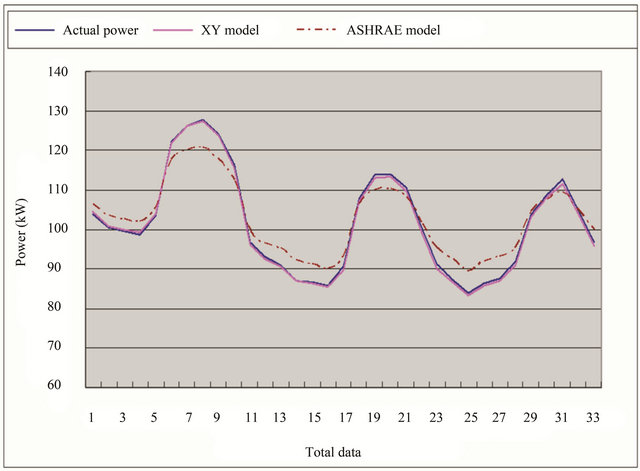
Figure 2. Actual and simulated energy consumption between the two models from March 12 to 14.
both academically and industrially. Currently, although many products and methods are alleged to benefit the energy saving of chillers, how to effectively verify and improve the actual efficiency of chillers in the most direct and accurate way is an integral part in the improvement of each unit. For this, the regression analysis used in this study can efficiently present the difference before and after improving the energy-saving performance of chillers. Consequently, the approach in this study can be used to verify the benefits of different energy-saving methods for chillers.
The major purpose of ESCO is to make use of energysaving technologies and concepts to find energy for customers, make utilization reasonable, improve energy utilization efficiency and save on cost. Nonetheless, how much energy is saved cannot be known without verification. In this study, regression analysis is adopted as the verification method to provide an analysis tool for ESCO in the verification of energy saving and should be implemented extensively.
REFERENCES
- Bureau of Energy, Ministry of Economic Affairs. http://www.moeaboe.gov.tw/
- C.-Y. Chu, “Application of Grey System Theory to Predict Chiller Power Consumption,” Master Thesis, National Taipei University of Technology, 2007.
- C.-L. Chen, “Study on Applying Differential Pressure in Determining the Flow Rate of Air Conditioning and Heating System,” Master Thesis, National Taipei University of Technology, 2011.
- P.-W. Tai, “Verification Approach for Chillers Applied to Energy Saving Performance Contract,” Master Thesis, National Taipei University of Technology, 2006.
- ASHRAE Handbook, “Supervisory Control Strategies and Optimization,” CH.40, 1999.