American Journal of Analytical Chemistry
Vol.09 No.03(2018), Article ID:83080,16 pages
10.4236/ajac.2018.93015
Determination of Lead in Water by Linear Sweep Anodic Stripping Voltammetry (LSASV) at Unmodified Carbon Paste Electrode: Optimization of Operating Parameters
Ndoye Mouhamed1, Kane Cheikhou1, Gadji Elhadji Momar Rokhy1, Diédhiou Moussa Bagha1, Mar-Diop Codou Guèye1, Theo Tzedakis2*
1Ecole Supérieure Polytechnique, Université Cheikh Anta Diop, Dakar, Senegal
2Laboratoire de Génie Chimique, UMR CNRS 5503, Université de Toulouse III-Paul Sabatier, Toulouse, France

Copyright © 2018 by authors and Scientific Research Publishing Inc.
This work is licensed under the Creative Commons Attribution International License (CC BY 4.0).
http://creativecommons.org/licenses/by/4.0/


Received: January 25, 2018; Accepted: March 13, 2018; Published: March 16, 2018
ABSTRACT
This study presents the elaboration of a simple and cheap electrode made by carbon paste introduced into a cavity of electrode body, and used for the lead traces determination in tap water. A potentiostatic pre-electrolysis at constant voltage enables the reduction of the lead (Pb2+) and the accumulation of the metallic lead at and into the carbon paste; the reoxidation of the Pb (Linear sweep voltammetry) leads to the anodic striping peak. The effect of the main operating parameters on the shape of the peak and the magnitude of the current was examined and their optimal values were determined. Then calibration was achieved and the method was successfully applied (using all the optimized parameters) to the determination of lead in water, with a detection limit of 0.138 µg∙L−1. Compared to other methods (ICP-AES for example), the proposed method offers a satisfactory detection limit of the Pb2+ (0.138 µg∙L−1) because of the important specific area of the carbon paste electrode, for a significantly lower cost. Besides, there is no observed loss in the electrode answer in terms of peak current, which means that there is no any irreversible steps nor deactivation of the electrode, even after ten successive measurements; only reduction of the lead followed by the deposit oxidation was observed at the electrode.
Keywords:
Carbon Paste Electrode, Lead, Linear Sweep Anodic Stripping Voltammetry, Water

1. Introduction
Lead is one of the most dangerous environmental pollutants and it has also a strong chemical toxicity effect even at low concentrations, causing irreversible cognitive damage and loss of intellectual quotient (IQ) [1] .
Lead penetrates body through food and air. It hasn’t any known physiological function [2] [3] [4] . Exposure to small amounts may cause deterioration of cognitive or motor functions in adults and irreversible neurological damage in children [5] from drinking water lead exposure (especially children under 6 years).
Its use in metallurgy, paints, pipelines, gasoline and in certain consumer products as a stabilizer, causes environmental contamination and public health problems.
The release of lead into drinking water systems, mainly due to corrosion processes on lead surface containing to plumbing materials, is a serious public health problem and can be influenced by many factors such as the pH and the alkalinity [6] . Quantification of lead in drinking water is very important given the high toxicity of this metal. The acceptable lead concentration in drinking water is currently under review by the World Health Organization (WHO) a concentration lower than 10 µg∙L−1. Consequently assessing the health risk from lead (Pb) in potable water requires accurate quantification of its concentration, but this determination is relatively difficult due to the low contents in water systems [7] . Different technics were used for trace lead analysis such as spectroscopic methods especially atomic adsorption spectroscopy [8] , graphite furnace atomic adsorption spectroscopy (GF-AAS) [9] , inductively coupled plasma mass spectroscopy (ICP-MS) [10] and inductively coupled plasma atomic emission spectroscopy (ICP-AES) [11] . These methods exhibit excellent sensitivity and good selectivity, but have different drawbacks such as time consuming used for analysis and very expensive instruments are required. Electrochemical methods including stripping voltammetric technics such as anodic stripping voltammetry (ASV) [12] , cathodic stripping voltammetry [13] , square wave voltammetry [14] and differential pulse voltammetry [15] have recognized powerful tools for trace analysis. The heavy metals are generally present at cations forms in the environment, so they can be electro-reduced to electrode area with the corresponding potential, which corresponds to accumulation step. This step will be followed by an oxidation step of metal, corresponding to the stripping step [16] . The performance of the method is strongly influenced by the nature of the working electrode [17] - [30] . Different working electrodes are used in voltammetric determination of lead. These include hanging mercury drop electrode (HMDE) [17] [18] [19] , mercury film electrode [20] [21] [22] gold electrode [23] , gold screen printed electrode [24] , Bismuth electrodes [25] [26] [27] [28] and renovated silver ring electrode [29] . The hanging mercury drop electrode is the most common because of its analytical properties in the cathodic range; however, health considerations and safety regulations limit its application because of its toxicity [30] .
The glassy carbon-mercury-film electrode was used [21] for the simultaneous determination of zinc, copper, lead, and cadmium in fuel ethanol by anodic stripping voltammetry; the detection limits sited were in the range 10−9 - 10−8 mol∙L−1 for these metal species. The bismuth alone (bismuth bulk electrode [26] , or a bismuth film [27] ) or modified by carbon nanotubes [28] , was used for titration (by anodic stripping voltammetries) of mixtures of lead, cadmium, zinc, or indium; low detection limits (~1 µg/L) seems to be achieved.
Since its introduction by Ralph Norman Adams [31] as an alternative to the mercury electrode, the carbon paste electrode has been largely used for its advantages such as easy preparation, stable response, wide window potential and its biocompatibility. These carbon paste electrodes appears to be selective and sensitive compared to the metallic material [32] [33] [34] ; in addition they can be modified by chemical or biological substances (Banana Tissue, poly (1,8-diaminonaphtalene)) to increase the sensitivity of the electrode, especially for the determination of dissolved lead [35] [36] [37] . Many studies have shown the sensitivity of the modified carbon paste electrode for lead analysis, however performances of unmodified carbon paste electrode were not extensively studied [38] , and the present study focuses on this part; it expects to develop an electro-chemical method for the determination of very low lead content in tap water in Dakar. Indeed, even if the linear sweep anodic stripping voltammetry (LSASV) is a very sensitive technique, the response obtained (ip) is notably influenced by variables such as time (taccumulation) and potential (Eacc) of accumulation, concentration of the electrolyte support and stirring rate. Therefore, it is necessary to optimize the parameters, which may have significant influence on the measured current, in order to reduce the detection limit content of the lead. In addition this work also expects to check the electrochemical stability of the unmodified carbon paste electrode in order to operate under reversible conditions and consequently to get reproducible measurements.
2. Material and Methods
2.1. Apparatus
The experiments were carried out using a Voltalab potentiostat (PGZ100) connected to a classical electrochemical “three electrodes” cell; Metrohm titration
tanks, having various capacities (1 < < 150) as function of the available
volume of the sample to be analyzed could be used. The working electrode used is the manufactured carbon paste electrode (CPE) of which a picture was showed in Figure 1(a) and Figure 1(b). A reference electrode of Ag/AgCl/KClsaturated and an auxiliary platinum electrodes were also used. The response of the system was observed via a computer using the software Voltalab master 4.
2.2. Chemicals
A standard solution of lead 1000 ppm Pro Analysis Sigma-Aldrich was used to

Figure 1. Pictures of the: (a) Supporting “teflon made” rod of the manufactured electrode; (b) Carbon Paste manufactured “disk shaped” electrode; (c) Three electrodes cell.
prepare lead solutions at different concentrations. The acids used for the preparation of the supporting electrolyte are nitric acid 70% DAEJUNG, sulfuric acid PROLABO 98%, hydrochloric acid 37% PANREAC and perchloric acid (70% - 72%, MERCK). Each dosage was preceded by thorough cleaning of electrodes followed by electrolytic cell cleaning with ethanol and rinsing with distilled water. The graphite carbon powder was used for the preparation of the carbon paste.
2.3. Carbon Paste Electrode Preparation
The carbon paste electrode (Figure 1(a) and Figure 1(b)) was prepared by mixing of 100 mg of graphite powder (ketjen black 300 supplied by akzonobel) and 50 µL of paraffin oil. The obtained mixture was kneaded until to produce a homogeneous paste, a part of which is introduced into a cylinder cavity (internal diameter 2.5 mm) with a pencil bar (acting as electronic collector). The resulting working electrode (the external disk area) was cleaned and dried using a filter paper that removes excess oil used in the preparation of the paste carbon (in order to avoid any influence of the oil on the conductivity of the electrode).
2.4. Procedure for Lead Analysis
The working electrode was immersed into 50 mL of lead solution in which 129 μL of concentrated HClO4 was added to obtain an electrolyte with a concentration of 0.03 M. The reduction of Pb2+ was carried out by chronoamperometry under a constant applied potential ranging from −800 to −1300 mV (preconcentration step), under stirring (magnetic bar at 200 rpm) throughout the electrolysis. The lead deposed into the carbon paste electrode was then oxidized by linear scanning voltammetry (redissolution step) between −700 and 0 mV. The presence of an oxidation peak in the obtained voltammogram attests the presence of the lead in the analyzed solution. Several parameters such as electrolysis time, accumulation potential were studied/optimized to improve the method sensibility for the determination of lead in drinking water. Response of system is an anodic stripping peak in which the amount of lead is proportional to the magnitude of the current.
3. Results and Discussion
3.1. Preliminary Experiments for the Lead Detection: Linear Sweep Voltammetry (Cathodic and Anodic for Stripping)
Current-potential curves (not showed here) were plotted by Linear Sweep Voltammetry under stirring and in presence of atmospheric oxygen, using aqueous solution of perchloric acid (0.03 M), in absence and in presence of lead (200 µg/L of Pb2+ - 10−6 M); None curve exhibits any peak or any wave for the Pb2+ reduction. Other experiments with the same concentration of lead, without stirring or higher potential scan rates does not lead to more satisfactory results.
In order to try to get a signal for the lead, potentiostatic elecrtolyses were achieved to reduce Pb2+ in various conditions, and followed by the plotting of the current potential curves to the anodic direction. The applied cathodic potential chosen ranges from −700 to −1800 mV, and the electrolyses durations vary from 1 to 30 min. During the electrolyses the metallic lead deposited accumulates to the electrode surface, and it can reoxidize during the anodic striping.
Figure 2 presents the results, i.e. the temporal evolution of the current during the potentiostatic reduction of the Pb2+ (inset), and the current-potential curves obtained during the stripping (1 to 3).

Figure 2. Current-potential curves obtained by LSASV, starting the potential-scan from −0.7 V until 0 V, at the CPE. r = 200 mV∙s−1; CE = Pt; RE = Ag/AgCl/KCl. (1): solution without Pb2+ (blanc); (2): stirred solution containing 200 µg/L of Pb2+, without accumulation (no pre-electrolysis); (3): same solution as in (2), with a pre-electrolysis (at constant potential: −1300 mV/Ag/AgCl/KCl) before to plot the curve to the anodic direction. Inset: Temporal evolution of the current during the preelectrolysis for the reduction of Pb2+ at the CPE (in relation with curve 3).
*curve (1), plotted in absence of lead, towards the anodic direction, with the CPE immersed in the electrolyte, does not exhibit current in the whole potential range, meaning that no reaction occurs on the CPE; specifically nor dissolved oxygen nor proton reductions were observed.
*curve (2) obtained with the same electrode, immersed in the electrolyte containing 200 µg/L of Pb2+, but without preelectrolysis, exhibits at −0.7/−0.6 V an exponential shaped area, attributed to the reduction of solvent at CPE and probably include the reduction of the Pb2+. No anodic stripping peak was observed meaning that, during the scan, there is not accumulation of enough of lead on the CPE.
*curve (3) was obtained, under the same conditions as in (2), but after an electrolysis performed at E = −0.7 V. The cathodic part of the curve exhibits a nicely resolute diffusion wave at the potential range from −0.7 until −0.47 V. The plateau is due to the reduction of Pb2+ on the lead coated CPE and translates a Pb2+/Pb reversible system (in comparison with a Pb2+/Pb more irreversible system on the barre CPE). At the potential area −0.47 to −0.3, the curve presents a peak attributed to the anodic oxidation of lead previously deposited and accumulated at the CPE.
3.2. Deaeration Time Effect on the Current Magnitude of the Anodic Stripping Peak
The previously obtained current-potential curves (Figure 2) does not clearly indicates a signal for the oxygen reduction on the CPE; this could mean that the O2/H2O system is irreversible on the CPE, but does not inform about its behavior on the lead covered CPE. Theoretically, under the required constant potential, both reductions (Pb2+®Pb and O2®H2O) could carry out independently, without mutual effects. Here, the effect of the deaeration time of the solution by nitrogen was examined in order to evaluate the influence of dissolved oxygen on the lead reoxidation current. Results were present in Figure 3 which gives the I = f (E) curves obtained for durations ranging from 2 min to 10 min, by LSASV, starting the potential-scan from −0.7 V until 0 V.
Curves clearly show that for bubbling times lower than 4 min, there is no lead deposition; the anodic striping peak of the lead oxidation appears for experiments submitted to a more than 4 min nitrogen bubbling. Reduction of oxygen could lead to various intermediates (such hydroxide radicals, hydrogen peroxide,…) which are able to modify the surface area of CPE, typically to create H-O-C bonds [39] . These terminal functions could enhance or strongly reduce the Pb2+ adsorption sites, and consequently the Pb2+ reduction current; in this case, at the applied potential of −1.3 V reduction of Pb2+ does not occur and all the current is used to reduce O2.
Increasing the bubbling time before the preelectrolysis (4 to 10 min) enables the Pb2+ to be reduced to Pb; the absence of dissolved oxygen in the solution implies no reaction, so there is none modification of the surface area of the CPE and this enables the lead reduction and the deposit accumulation. For nitrogen
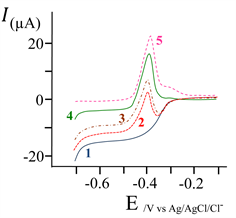
Figure 3. Effect of nitrogen bubbling time on the Current-Potential curves, obtained starting the potential-scan from −0.7 V until 0 V, at the CPE. Stirred solution containing Pb2+ at 200 µg∙L−1; Eacc: −1.3 V; taccumulation: 10 min; r: 200 mV∙s−1; N˚ curve/nitrogen bubbling time (min), respectively: 1/2; 2/4; 3/6; 4/8; 5/10.
bubbling times higher than 10 minutes, curves does not show changes in the magnitude of the current of the anodic striping peak. Note that, this time can be easily and significantly reduced by decreasing the initial volume of the sample to be analyzed (a few minutes bubbling time /t < 3 min/ for a few cm3 /v < 5 cm3/ of analyzed volumes).
3.3. Effect of the Potential Applied for the Reduction of the Lead (Accumulation Potential) on the Current Magnitude of the Anodic Stripping Peak
The applied potential must enable the reduction of Pb2+ on barre CPE, and also on this electrode “coated by metallic lead”. During this operation, all metallic species, having a higher potential than the potential of the system Pb2+/Pb, could be reduced and eventually deposited; consequently, if their adhesion is so enough, their oxidation could become possible, however at higher potential than this one observed for the lead oxidation. The effect of the applied potential during the accumulation phase (which enables the lead deposition), on the anodic stripping peak current, was examined in the range of −600 to −1800 mV/Ag/AgCl/KCl and the results were presented in Figure 4. The anodic peak current increase when the applied cathodic potential decreases from −0.7 to −1.4 V. This strange behavior could be attributed to an irreversible behavior of the system Pb2+ on the CPE; in this potential range, the electronic transfer limits the reduction of Pb2+, thus, decreasing the applied potential increases the resulting cathodic current and consequently the accumulated metallic lead on the CPE. In fact, in this examined range, there is no a significant effect of the mass transfer limitation for the reduction of Pb2+ on the CPE, especially if the CPE was not entirely covered by the metallic deposit of Pb. For applied cathodic potentials, ranging from −1.4 to −1.8 V, the curve of the Figure 4 show a decrease of the magnitude of the stripping peak current. This decrease is attributed to the reduction of the solvent simultaneously to the reduction of Pb2+.

Figure 4. Evolution of the current magnitude of the anodic stripping peak, (obtained on CPE during the potential sweep to the anodic direction), against the cathodic potential applied to reduce Pb2+ to Pb. Stirred (200 rpm) solution containing 200 µg/L of Pb2+; r = 200 mV/s; N2 1 bar; electrolyses time for the metallic lead accumulation on the CPE: 10 min; CE: Pt; RE: Ag/AgCl/Cl−.
The produced gas H2 could also creates local turbulences, which could cause a certain dispersion into the bulk of the electrodeposit (especially for dendritic lead deposited on the CPE, in the limiting current conditions). In addition with the loss of current attributed to the proton reduction, that is why the quantity of “the metallic lead oxidized” decreases with the applied potential, implying the
stripping peak current magnitude to decrease. The value of −1.3
was selected as the optimum pre-concentration potential.
3.4. Effect of the Electrolysis Duration (Preconcentration Time) on the Current Magnitude of the Anodic Stripping Peak
Figure 5 presents the voltammograms obtained after various durations of the potentiostatic electrolyses, carried out at the previous selected potential (−1.3 V), using the CPE immersed into a 100 µg/L solution of Pb2+.
The magnitude of the current of the anodic striping peak, linearly increase (inset) versus the time, for electrolyses durations lower than 20 min. This means that during these electrolyses, the cathodic current remains constant, and this indirectly imply that the CPE electrodes does not passivates; its surface does not significantly change by the lead deposits (because the linear increase of the peak current). This result is very important especially for the reproducibility and the repeatability of analyses of solutions containing very lows quantities (see following sections) of Pb2+.
For longer electrolyses, the increase of the magnitude of the current (inset of Figure 5) is higher than the augmentation expected by a linear evolution. This could be due to an increase of the electrochemical surface by the lead electrodeposited! Longer electrolyses times lead to a significant quantity of the metallic lead, which also acts as electronic collector and enables higher quantities of Pb2+ to be reduced. For the present study, an electrolysis time of 10 min was retained

Figure 5. Effect of preconcentration time on the I = f(E) curves, obtained from −0.7 V to 0 V towards the anodic direction, on carbon paste electrode (CPE). Stirred solution containing 100 µg/L of Pb2+ under N2 1bar; potential scan rate r = 200 mV/s, Applied potential for preconcentration (electrolysis enabling to accumulate Pb at the CPE): −1.3 V; CE (Pt); RE (Ag/AgCl/Cl−). N˚ curve/prelectrolysis time (min), respectively: 1/0; 2/10; 3/20; 4/25; 5/30. Inset: Magnitude of the anodic striping peak current versus the electrolyses times (accumulation of Pb at the CPE); Ipeak(µA) = 0.1042 × t(s) (for t < 20 min).
in order 1) to stay in the linear part of the curve Ipeak = f (electrolysis time) and, 2) to propose a rapid method for the lead titration.
3.5. Effect of the Supporting Electrolyte (Nature and Concentration) on the Current Magnitude of the Anodic Stripping Peak
Various acidic solution (nitric, sulfuric, hydrochloric and perchloric) were examined as eventual supporting electrolyte for the titration of the lead. Figure 6(a) presents the results in terms of the evolution of the magnitude of the striping anodic peak (oxidation of the accumulated lead on the CPE) against the nature of the acidic solution. Hydrochloric and perchloric acidic solutions provide the higher signals.
Two reasons could explain the obtained differences in the magnitude of the peak current against the nature of the electrolyte:
1) Higher diffusion coefficients of the Pb2+ could lead to higher cathodic current and consequently a higher accumulated quantity of the deposit;
2) A higher adhesion energy of the deposit on the CPE in the case of perchloric acid: this enables to keep all the reduced metallic lead at the electrode surface and avoid some dispersion because the stirring or the sponges nature of the deposit. The effect of the concentration of the supporting electrolyte choses (i.e. perchloric acid) was examined, expecting to increase the answer of the system, specifically for low concentrated solutions of lead.
In absence of electrolyte, when the applied potential is so cathodic enough to overcome the activation limitation for the reduction of Pb2+, the transfer of Pb2+ to the interface is limited by both diffusion and migration. Migration flux of Pb2+ increases when the electrolyte added concentration decreases, implying the
 (a)
(a)
 (b)
(b)
Figure 6. Effect of the supporting electrolyte (nature (a) and concentration (b)) on the current magnitude of the anodic stripping peak (a) and (b); the last obtained from the I = f(E) curves plotted from −0.7 V to 0 V towards the anodic direction, on carbon paste electrode (CPE). Stirred solution containing Pb2+{(a): 1 mg/L; (b): 0.1 mg/L} under N2 1 bar; potential scan rate r = 200 mV/s, Applied potential for preconcentration (electrolysis enabling to accumulates metallic lead on CPE): −1.3 V; taccumulation: 10 min; CE (Pt); RE (Ag/AgCl/KCl); (b) Perchloric acid concentration effect on the current magnitude of the anodic stripping peak.
cathodic current of Pb2+ to increase; consequently, for the same electrolysis duration, the accumulated quantity of the metallic lead increases, so the current magnitude of the anodic stripping peak also increases. In the present study, the electrolyte was involved in large excess {6000 < ([electrolyte]/[Pb2+]) < 20,000} meaning that the migration of the lead must be negligible, and implying a slight effect of the electrolyte concentration on the magnitude of the anodic striping peak. However, results presented in Figure 6(b) indicate a strong dependence of the peak current versus the perchloric acid concentration! Indeed, decreasing the electrolyte concentration (from 100 to 10 mM) causes the magnitude of the current to strongly increases (from 5 to 80 µA), in fact the presence of perchloric acid appears to change the behavior of the electrode; the reduction of the lead Pb2+ become more irreversible probably by some disaggregation of the graphite powder by the perchloric acid. The concentration of electrolyte chosen to carry out the analyses is 0.03 M which 1) provides a higher current of the anodic striping peak, 2) ensure an ionic conductivity so high enough (to suppress possible disturbances by the matrix of the sample to be analyzed) and 3) reduce a possible negative effect of the high acidic content.
3.6. Effect of the Potential Scan Rate on the Current Magnitude of the Anodic Stripping Peak
The effect of the potential scan rate r on the current magnitude of the anodic stripping peak was examined, expecting to increase the answer of the system, specifically for low concentrated solutions of lead. The results are the anodic curves obtained under various potential scan rates 80 £ r (mV∙s−1) £ 300; they are similar to these presented in Figure 5 (not showed here to save place).
Theoretically, the peak current increases linearly with the r for adsorption (or a thin layer cell or a monolayer) limited systems and linearly with the square root of r for diffusion limited systems. Here nor Ipeak = f (r0.5) nor Ipeak = f (r) exhibit a linear evolution, probably because a limitation of the Pb oxidation caused by both phenomena: desorption and then surface migration of the metallic lead into the pores of the CPE, until its surface, where take places the Pb oxidation.
Note that four-fold increase of the potential scan rate causes a slight increase of the peak potential (ΔEpeak = 60 mV) of the Pb oxidation system, and this translates that the Pb®Pb2+ is a slightly irreversible system. The scan rate of 200 mV∙s−1 was chosen as a satisfactory value of the potential scan rate to carry out the study of the effect of the various operating parameters.
3.7. Effect of the Pb2+ Concentration on the Current Magnitude of the Anodic Stripping Peak
The influence of the Pb2+ concentration (ranging from 0.1 to 100 μg∙L−1) on the magnitude of the current of the anodic stripping peak was studied, using the CPE. A part of the results were present in Figure 7(a) and the I = f (E) curve obtained for [Pb2+] = 3 µg/L was indicated Figure 7(b).
A satisfactory linear dependence was observed between the oxidation peak current and the Pb2+ concentration:
The detection limit of the elaborated carbon paste electrode is 0.138 μg∙L−1. The reproducibility was studied for three concentrations of Pb2+: 3, 10 and 20 μg∙L−1 by repeating the experiments 6 times, and comparable results were obtained with a uncertainties lower than 5%.
3.8. Discussion: Application in Drinking Water Analysis
The previous experiments were carried out in order 1) to validate the ability of the carbon paste electrode in the Pb2+-traces electrochemical analysis and 2) to select the optimum operating parameters enabling to obtain the highest answer
 (a)
(a)
 (b)
(b)
 (c)
(c)
Figure 7. (a) Effect of the [Pb2+] on the current magnitude of the anodic stripping peak of the Pb, obtained during a scan (LSASV) from −0.7 V to 0 V towards the anodic direction, on carbon paste electrode (CPE). Stirred solution containing Pb2+ into 0.03 M HClO4; r = 200 mV/s, Applied potential for preconcentration (electrolysis enabling to accumulates metallic lead on CPE): −1.3 V; taccumulation: 10 min; CE (Pt); RE (Ag/AgCl/KCl). N2 1 bar; (b) Reoxidation voltammogram obtained with a 3 µg/L solution of Pb2+; (c) Reoxidation voltammogram obtained with a tap water collected in a recent building in Dakar city.
(e.g. the magnitude of the current) produced by the LSASV technique (thus enabling lowering the detection limit concentration). The results show that all the examined operating parameters strongly affect the shape and the size of the anodic striping peak. The optimum values of these parameters for the analysis of lead were summarized in Table 1. Besides, the previous results, specifically the calibration curve (Figure 7(a)) shows that, using the CPE (and the previously indicated electrochemical device), it is possible to detect and to quantify lead (Pb2+) at concentration equal to 3 µg∙L−1 with uncertainties less than 5% (detection limit with the available apparatus: 0.1 µg/L of Pb2+); this concentration is lower than the accepted concentration fixed by WHO (10 μg∙L−1).
The proposed “simple” analytical method was involved to directly determine lead (Pb2+) in various aqueous samples collected in Senegal (irrigation and wastewater samples), as well as in samples of drinking water of some various kind of buildings in Dakar City.
More than ten samples, were analyzed without any further treatment and the concentrations of Pb2+ were deduced from the stretched range of the regression equation (§3.7.). The Pb2+ concentrations found reaches for some samples until 270 μg∙L−1, contents significantly higher than the limit of the WHO (World Health Organization) standards (10 µg∙L−1) in tap water. The high concentrations of lead in tap water are mainly due to the presence of lead in the “house-drinking water network”. In the same order, to assess to the practical analytical utility of the method, distilled water samples that have been kept in contact for two hours with a pure lead material at the pH 7, were analyzed by LSASV at the unmodified carbon paste electrodes: result show a concentration of Pb2+, higher than the limit of the WHO (14.48 µg/L).
Figure 7(c) presents a reoxidation voltammogram obtained, under the optimum values of the operating parameters, with a tap water collected in a recent building in Dakar city. Two peeks were observed, the first one (Epeek~ −0.4 V) corresponds to the oxidation of lead electrodeposited (2 < Pb2+µg/L < 3) and the second (Epeek~ −0.1 V) corresponds to the oxidation of an another heavy metal electrodeposited simultaneously to the lead, thus confirming the selectivity of the proposed method
4. Conclusions
Linear Sweep Anodic Stripping voltammetry on a carbon paste electrode was proposed for the analysis of lead at low concentrations in water, as an alternative

Table 1. The operating parameters strongly affect the shape and the size of the anodic striping peak (Pb˚®Pb2+), and their optimum values enabling to obtain the highest answer of the system.
to other methods longer or expensive. The proposed method is not cost effective and can be easily used to quickly analyze on site tap water even in individual “house-drinking water networks”. The effect of the main operating parameters on the shape of the anodic striping peek and also on the magnitude of its current, was examined and their optimal value were determined. Then calibration was achieved and the method was successfully applied (using all the optimized parameters) to the determination of lead in water, with a detection limit of 0.138 µg∙L−1.
Compared to other methods (ICP-AES for example) the proposed method offers a satisfactory detection limit of the Pb2+ (0.138 µg∙L−1) because of the important specific area of the carbon paste electrode, for a significantly lower cost. Besides, there is no observed loss in the electrode answer (peak current) which means that there is no any irreversible steps nor deactivation of the electrode, even after ten successive measurements; only reduction of the lead followed by the deposit oxidation was observed at the electrode.
This study has shown that LSASV on the CPE is a fast (~15 minutes), selective (specific potential for the reading of the current: −0.4 to −0.35 V/ Ag/AgCl/Cl−) and sensitive method for the analysis of lead. The method provides reproducible results thanks to the high specific surface offered by the carbon paste. Next step will consist to examine the ability of the elaborated electrode in the titration of other heavy metals present in the tap water, and this will constitute a future work.
Cite this paper
Mouhamed, N., Cheikhou, K., Rokhy, G.E.M., Bagha, D.M., Guèye, M.-D.C. and Tzedakis, T. (2018) Determination of Lead in Water by Linear Sweep Anodic Stripping Voltammetry (LSASV) at Unmodified Carbon Paste Electrode: Optimization of Operating Parameters. American Journal of Analytical Chemistry, 9, 171-186. https://doi.org/10.4236/ajac.2018.93015
References
- 1. Hu, J., Ma, Y., Zhang, L., Gan, F. and Ho, Y.S. (2010) A Historical Review and Bibliometric Analysis of Research on Lead in Drinking Water Field from 1991 to 2007. Science of the Total Environment, 408, 1738-1744.
- 2. Boeckx, R.L. (1986) Lead Poisoning in Children. Analytical Chemistry, 58.
- 3. Moncrieff, A.A., Koumides, O.P., Clayton, B.E., Patrick, A.D., Renwick, A.G.C. and Roberts, G.E. (1964) Lead Poisoning in Children. Archives of Disease in Childhood, 39, 1-13.
- 4. Warniment, C., Tsang, K. and Galazka, S.S. (2010) Lead Poisoning in Children. American Family Physician Journal, 81, 751-757.
- 5. Haider, T., Haider, M., Wruss, W., Sommer, R. and Kundi, M. (2002) Lead in Drinking Water of Vienna in Comparison to Other European Countries and Accordance with Recent Guidelines. International Journal of Hygiene and Environmental Health, 205, 399-403.
- 6. Kim, E.J., Herrera, J.E., Huggins, D., Braam, J. and Koshowski, S. (2011) Effect of PH on the Concentrations of Lead and Trace Contaminants in Drinking Water: A Combined Batch, Pipe Loop and Sentinel Home Study. Water Research, 45, 2763-2774.
- 7. Portugal, L.A., Ferreira, H.S., dos Santos, W.N.L. and Ferreira, S.L.C. (2007) Simultaneous Pre-Concentration Procedure for the Determination of Cadmium and Lead in Drinking Water Employing Sequential Multi-Element Flame Atomic Absorption Spectrometry. Microchemical Journal, 87, 77-80.
- 8. Mendil, D. and Uluozlü, O.D. (2007) Determination of Trace Metal Levels in Sediment and Five Fish Species from Lakes in Tokat, Turkey. Food Chemistry, 101, 739-745.
- 9. Falomir, P., Alegria, A., Barberá, R., Farré, R. and Lagarda, M.J. (1999) Direct Determination of Lead in Human Milk by Electrothermal Atomic Absorption Spectrometry. Food Chemistry, 64, 111-113.
- 10. Hwang, T.-J. and Jiang, S.-J. (1996) Determination of Copper, Cadmium and Lead in Biological Samples by Isotope Dilution Inductively Coupled Plasma Mass Spectrometry after On-Line Pre-Treatment by Anodic Stripping Voltammetry. Journal of Analytical Atomic Spectrometry, 11, 353-357.
- 11. Rao, K.S., Balaji, T., Rao, T.P., Babu, Y. and Naidu, G.R.K. (2002) Determination of Iron, Cobalt, Nickel, Manganese, Zinc, Copper, Cadmium and Lead in Human Hair by Inductively Coupled Plasma-Atomic Emission Spectrometry. Spectrochimica Acta Part B: Atomic Spectroscopy, 57, 1333-1338. https://doi.org/10.1016/S0584-8547(02)00045-9
- 12. Guzsvány, V., Nakajima, H., Soh, N., Nakano, K. and Imato, T. (2010) Antimony-Film Electrode for the Determination of Trace Metals by Sequential-Injection Analysis/Anodic Stripping Voltammetry. Analytica Chimica Acta, 658, 12-17. https://doi.org/10.1016/j.aca.2009.10.049
- 13. Ensafi, A.A., Khayamian, T., Benvidi, A. and Mirmomtaz, E. (2006) Simultaneous Determination of Copper, Lead and Cadmium by Cathodic Adsorptive Stripping Voltammetry Using Artificial Neural Network. Analytica Chimica Acta, 561, 225-232. https://doi.org/10.1016/j.aca.2006.01.015
- 14. El Mhammedi, M.A., Achak, M. and Chtaini, A. (2009) Ca10 (PO4)6 (OH)2-Modified Carbon-Paste Electrode for the Determination of Trace Lead (II) by Square-Wave Voltammetry. Journal of Hazardous Materials, 161, 55-61.https://doi.org/10.1016/j.jhazmat.2008.03.057
- 15. Inam, R. and Somer, G. (2000) Direct Method for the Determination of Selenium and Lead in Cow’s Milk by Differential Pulse Stripping Voltammetry. Food Chemistry, 69, 345-350. https://doi.org/10.1016/S0308-8146(00)00045-5
- 16. March, G., Nguyen, T.D. and Piro, B. (2015) Modified Electrodes Used for Electrochemical Detection of Metal Ions in Environmental Analysis. Biosensors, 5, 241-275. https://doi.org/10.3390/bios5020241
- 17. Gillain, G., Duyckaerts, G. and Disteche, A. (1979) Direct and Simultaneous Determinations of Zn, Cd, Pb, Cu, Sb and Bi Dissolved in Sea Water by Differential Pulse Anodic Stripping Voltammetry with a Hanging Mercury Drop Electrode. Analytica Chimica Acta, 106, 23-37. https://doi.org/10.1016/S0003-2670(01)83701-6
- 18. Hernández-Méndez, J., Carabias-Martínez, R. and González-López, M.E. (1982) Simultaneous Determination of Tin and Lead by a.c. Anodic Stripping Voltammetry at a Hanging Mercury Drop Electrode Sensitized by Cetyltrimethylammonium. Analytica Chimica Acta, 138, 47-54. https://doi.org/10.1016/S0003-2670(01)85285-5
- 19. Fernández-Bobes, C., Fernández-Abedul, M.T. and Costa-García, A. (1998) Anodic Stripping of Heavy Metals Using a Hanging Mercury Drop Electrode in a Flow System. Electroanalysis, 10, 701-706. https://doi.org/10.1002/(SICI)1521-4109(199808)10:10<701::AID-ELAN701>3.0.CO;2-I
- 20. Fischer, E. and van den Berg, C.M.G. (1999) Anodic Stripping Voltammetry of Lead and Cadmium Using a Mercury Film Electrode and Thiocyanate. Analytica Chimica Acta, 385, 273-280. https://doi.org/10.1016/S0003-2670(98)00582-0
- 21. de Oliveir, M.F., Saczk, A.A., Okumura, L.L., Fernandes, A.P., de Moraes, M. and Stradiotto, N.R. (2004) Simultaneous Determination of Zinc, Copper, Lead, and Cadmium in Fuel Ethanol by Anodic Stripping Voltammetry Using a Glassy Carbon-Mercury-Film Electrode. Analytical and Bioanalytical Chemistry, 380, 135-140. https://doi.org/10.1007/s00216-004-2733-8
- 22. Gil, E.P. and Ostapczuk, P. (1994) Potentiometric Stripping Determination of Mercury (II), Selenium (IV), Copper (II) and Lead (II) at a Gold Film Electrode in Water Samples. Analytica Chimica Acta, 293, 55-65. https://doi.org/10.1016/0003-2670(94)00075-1
- 23. Bonfil, Y., Brand, M. and Kirowa-Eisner, E. (2000) Trace Determination of Mercury by Anodic Stripping Voltammetry at the Rotating Gold Electrode. Analytica Chimica Acta, 424, 65-76. https://doi.org/10.1016/S0003-2670(00)01074-6
- 24. Mandil, A., Idrissi, L. and Amine, A. (2010) Stripping Voltammetric Determination of Mercury (II) and Lead (II) Using Screen-Printed Electrodes Modified with Gold Films, and Metal Ion Preconcentration with Thiol-Modified Magnetic Particles. Microchimica Acta, 170, 299-305. https://doi.org/10.1007/s00604-010-0329-x
- 25. Kadara, R.O. and Tothill, I.E. (2008) Development of Disposable Bulk-Modified Screen-Printed Electrode Based on Bismuth Oxide for Stripping Chronopotentiometric Analysis of Lead (II) and Cadmium (II) in Soil and Water Samples. Analytica Chimica Acta, 623, 76-81. https://doi.org/10.1016/j.aca.2008.06.010
- 26. Armstrong, K.C., Tatum, C.E., Dansby-Sparks, R.N., Chambers, J.Q. and Xue, Z.-L. (2010) Individual and Simultaneous Determination of Lead, Cadmium, and Zinc by Anodic Stripping Voltammetry at a Bismuth Bulk Electrode. Talanta, 82, 675-680.https://doi.org/10.1016/j.talanta.2010.05.031
- 27. Charalambous, A. and Economou, A. A Study on the Utility of Bismuth-Film Electrodes for the Determination of In (III) in the Presence of Pb (II) and Cd (II) by Square Wave Anodic Stripping Voltammetry. Analytica Chimica Acta, 547, 53-58.https://doi.org/10.1016/j.aca.2004.12.048
- 28. Ho-Hwang, G., Han, W.K., Park, J.S. and Kang, S.G. (2008) Determination of Trace Metals by Anodic Stripping Voltammetry Using a Bismuth-Modified Carbon Nanotube Electrode. Talanta, 76, 301-308. https://doi.org/10.1016/j.talanta.2008.02.039
- 29. Bas, B. and Jakubowska, M. (2008) The Renovated Silver Ring Electrode in Determination of Lead Traces by Differential Pulse Anodic Stripping Voltammetry. Analytica Chimica Acta, 615, 39-46. https://doi.org/10.1016/j.aca.2008.03.042
- 30. Gomdje, V.H., Ngono, T.R.L., Elqouatli, S.E., Najih, R. and Chtaini, A. (2013) Electroanalytical Determination of Lead with Carbon Paste Modified Steel Electrode. Acta Technica Corviniensis—Bulletin of Engineering, 6, 139.
- 31. Adams, R.N. (1958) Carbon Paste Electrodes. Analytical Chemistry, 30, 1576-1576.https://doi.org/10.1021/ac60141a600
- 32. Adam, V., Zehnalek, J., Petrlova, J., Potesil, D., Sures, B., Trnkova, L., Jelen, F., Vitecek, J. and Kizek, R. (2005) Phytochelatin Modified Electrode Surface as a Sensitive Heavy-Metal Ion Biosensor. Sensors, 5, 70-84. https://doi.org/10.3390/s5010070
- 33. Vytras, K., Svancara, I. and Metelka, R. (2009) Carbon Paste Electrodes in Electroanalytical Chemistry. Journal of the Serbian Chemical Society, 74, 1021-1033. https://doi.org/10.2298/JSC0910021V
- 34. Jaiswal, A.K., Das, S., Kumar, V., Gupta, M., Singh, N. (2015) Simultaneous Determination of Zinc (Zn), Cadmium (Cd), Lead (Pb) and Copper (Cu) in Blood Using Differential-Pulse Anodic-Stripping Voltammetry. International Journal of Engineering Research, 4, 235-239. https://doi.org/10.17950/ijer/v4s5/505
- 35. Mojica, E-R.E., Vidal, J.M., Pelegrina, A.B. and Micor, J.R.L. (2007) Voltammetric Determination of Lead (II) Ions at Carbon Paste Electrode Modified with Banana Tissue. Journal of Applied Sciences, 7, 1286-1292. https://doi.org/10.3923/jas.2007.1286.1292
- 36. Mariame, C., Rhazi, M.E. and Adraoui, I. (2009) Determination of Traces of Copper by Anodic Stripping Voltammetry at a Rotating Carbon Paste Disk Electrode Modified with Poly (1,8-Diaminonaphtalene). Journal of Analytical Chemistry, 64, 632-636. https://doi.org/10.1134/S1061934809060161
- 37. Ait Sidi Mou, A., Ouarzane, A. and Rhazi, M.E. (2016) Detection of Mercury by a New Sensor Based CPE Modified with Extract of Takaout Plant. Mediterranean Journal of Chemistry, 5, 514-520. https://doi.org/10.13171/mjc54/01605201630/aitsidimou
- 38. Popa, D.E., Mureseanu, M. and Tanase, I.G. (2012) Organofunctionalized Mesoporous Silica Carbon Paste Electrode for Simultaneously Determination of Copper, Lead and Cadmium. Revista de Chimie, 63, 565-571.
- 39. Wei, L., Zhao, T.S., Zeng, L., Zeng, Y.K. and Jiang, H.R. (2017) Highly Catalytic and Stabilized Titanium Nitride Nanowire Array-Decorated Graphite Felt Electrodes for All Vanadium Redox Flow Batteries. Journal of Power Sources, 341, 318-326.https://doi.org/10.1016/j.jpowsour.2016.12.016