American Journal of Analytical Chemistry
Vol.05 No.13(2014), Article ID:50022,11 pages
10.4236/ajac.2014.513096
Carbon Nanotubes as Nanosensor for Differential Electrolytic Micropotentiometry
Abdulaziz N. Amro1, Abdalla Mahmud Abulkibash2, Muataz Ali Atieh3,4*
1Department of Chemistry, Faculty of Science Taibah University, Al-Madinah Al-Munawarah, KSA
2Chemistry Department, King Fahd University of Petroleum & Minerals, Dhahran, KSA
3Chemical Engineering Department, King Fahd University of Petroleum & Minerals, Dhahran, KSA
4Center of Research Excellence in Nanotechnology (CENT), King Fahd University of Petroleum & Minerals, Dhahran, KSA
Email: *motazali@kfupm.edu.sa
Copyright © 2014 by authors and Scientific Research Publishing Inc.
This work is licensed under the Creative Commons Attribution International License (CC BY).
http://creativecommons.org/licenses/by/4.0/


Received 18 July 2014; revised 5 August 2014; accepted 22 September 2014
ABSTRACT
Carbon nanotubes as nanosensor were synthesized on the surface of the silver electrode using floating catalyst chemical vapor deposition reactor. Acetylene gas was used as a carbon source, ferrocene as a source of the iron nanocatalyst and hydrogen as a carrier and an activate agent. Several runs were performed to find the optimum conditions that produce sensitive Ag-CNTs electrodes. The electrodes obtained at each run were characterized by SEM. The optimum conditions that produce sensitive Ag-CNTs were found to be at a reaction time of 15 minutes, reaction temperature of 700˚C, hydrogen flow rate of 25 ml/min and an acetylene flow rate of 75 ml/min. These optimum conditions were confirmed from the normal behavior of the resulting Ag-CNTs electrodes in the titration of 10 µL of chloride using dc differential electrolytic potentiometry. When conditions that differ from the optimum ones were applied in the preparation of the Ag- CNTs electrodes, abnormal titration curves were obtained. The superiority of the Ag-CNTs electrodes was demonstrated by the successful applications of these electrodes as an indicating system in the micro titrations of different volumes of cyanide solution with silver nitrate reach. By applying this technique a volume of 1.2 µL sample of cyanide was successfully titrated. The normal behavior of the Ag-CNts electrodes was compared to that of the normal silver electrodes which exhibit an abnormal behavior.
Keywords:
CNTs, Silver Electrode, Differential Electrolytic Potentiometry

1. Introduction
Differential electrolytic potentiometry (DEP) is a titrimetric technique which utilizes two identical metallic electrodes that are polarized either by a dc constant current or by a time bias square wave. The potential difference between these electrodes is measured during the course of the titration. At the end-point, this potential difference produces a sharp symmetrical peak. DEP technique doesn’t require a reference electrode and thus the difficulties of the salt bridge are eliminated. Moreover, polarization enhances the response of the electrodes. This technique has been applied to various types of titrimetric reactions using different types of electrodes [1] -[7] . Carbon nanotubes (CNTs) have been the subject of numerous investigations in chemical, physical and material areas due to their novel properties [8] [9] . Depending on their atomic structure, CNTs behave electrically as a metal or as a semiconductor [10] [11] . The subtle electronic properties suggest that CNTs have the ability to promote charge-transfer reactions when used as an electrode [12] -[15] . Various methods have been applied for the preparation of carbon nanotubes. The most common techniques employed are: arc discharge [16] [17] , laser ablation [18] and chemical vapor deposition (CVD) [19] -[21] . For the first time the deposition of CNTs on silver electrodeis reported and the resulting Ag-CNT electrodes were characterized by SEM and TEM. The optimum conditions required to prepare Ag-CNTs electrode that shows a normal response were achieved. The prepared Ag- CNTs electrodes were applied in a microtitration of chloride with silver nitrate. The electrodes that were prepared under the optimum conditions only have shown normal behavior and the other electrodes were found to exhibit abnormal behaviors.
2. Expermental
2.1. Coating Silver Electrodes with CNT
Nine silver electrodes each of 2 cm length and 1 mm diameter were used to deposit the CNTs on their surfaces. The floating catalyst chemical vapor deposition (FC-CVD) reactor was used to produce Ag-CNTs electrodes. The production of CNTs in the present work has been conducted in a two horizontal tubular reactor. Quartz tube of 2.5 cm in diameter and 100 cm in length was placed in the two reactors and heated by silicon carbide heating element as shown in Figure 1. Ferrocene (Fe C10H10) as a source of iron catalyst was placed at the middle of the first reactor while a silver electrode of a length of 2 cm in was placed in the middle of the second reactor.
Acetylene gas of 99.5% purity was used as a hydrocarbon source and hydrogen gas was used as a carrier and reactant gas. Argon was used to flush the air from the system before and after the completion of the reaction. Several experiments were performed at reaction temperatures ranging from 600˚C - 900˚C. The flow rate of hydrogen was varied from 10 - 150 ml/min while that of the hydrocarbon was varied from 75 - 300 ml/min and the reaction time was fixed at a period of 30 min.
Four silver electrodes were fabricated from a silver wire of 1.0 mm diameter. Two of these electrodes were coated with the CNTs and applied in microtitrimetry. The other two electrodes were used in microtitrimetry without treatment. A small cell that can accommodate two electrodes and the tip of a micro pipette or a micro injector was used. The Ag-CNTs electrodes were cleaned properly using a solution of 1.0 M HNO3 then rinsed with deionized water and used as an indicating system. A solution of 1.0 M KNO3 was used as a supporting electrolyte.
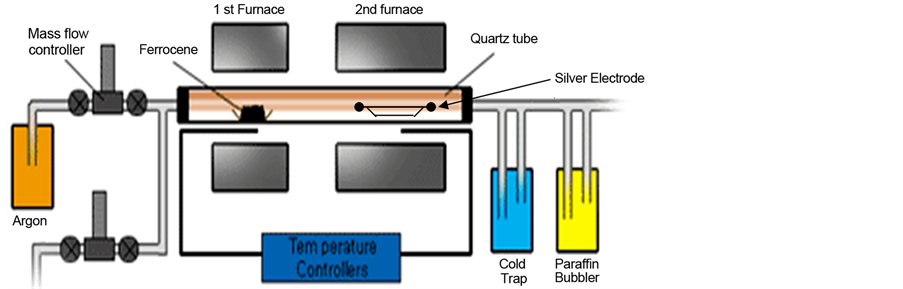
Figure 1. Floating catalyst chemical vapor deposition reactor.
2.2. Preparation of Solutions
A solution of 0.05 M NaCl (BDH) was prepared by dissolving the required amount of the salt in a volumetric flask and diluting to the mark with distilled deionized water. A solution of 0.05 M KCN (Fisher) was carefully prepared in the fume hood. Silver nitrate (Fluka) was used to prepare a solution of 0.05 M. A solution of 1.0 M HNO3 was prepared and used to clean the electrodes. A solution of 0.05 MM KNO3 was prepared and used as a supporting electrolyte. All of the solutions were prepared using distilled deionized water. In case of investigating the behavior of the prepared Ag-CNTs electrodes dc DEP was applied. However, in case of cyanide the technique of m.s.b. DEP which more sensitive than dc DEP was used to locate the end-point.
2.3. Procedure
The setup of the microtitration by differential electrolytic potentiometry which includes, a small cell, a dc and a mark-space polarizing sources and a micro injector was described elsewhere [22] . The silver electrodes coated with CNTs were cleaned properly using a solution of 1.0 M HNO3 then rinsed with deionized water and used as an indicating system. A solution of 0.05 M AgNO3 was used as a titrant in the titration of both NaCl and KCN.
Micropipettes that deliver volumes of 1, 10 and 100 micro liter were employed to deliver the sample into the titration cell. The output of the mark-space bias and the micro liter injector were all controlled using Lab. View software [22] .
3. Results and Discussion
3.1. Effect of the H2 and Acetylene Flow Rates on the Growth of CNTs on the Silver Electrode
In the floating catalyst method, an amount of 100 mg of ferrocene was placed in the middle of the reactor and vaporized at a temperature of 120˚C. Under these conditions and in presence of hydrogen and acetylene gases, ferrocene is reduced to Fe ions. These ions were carried with hydrogen and acetylene gases to the reaction chamber. The temperature of this chamber was fixed at a value of 700˚C using a period of 15 minutes as a reaction time. The Fe ions will aggregate into nano scaled catalyst particles and will deposit on the surface of the silver electrode. As a result, the growth of the CNTs on the surfaces of the silver electrodes will be initiated. The hydrogen flow rate affects the concentration of the carbon atoms produced from the cracking of the acetylene gas and their absorption on the catalyst particles. In this study, hydrogen flow rate was limited in the range 10 - 50 ml/min while the acetylene flow rate was varied from 25 - 100 ml/min. In order to find the optimum conditions that will produce Ag-CNTs electrodes that have normal performance, the flow rates of hydrogen and acetylene, the reaction temperatures and the reaction times used were investigated. Figure 2 shows the effect of hydrogen flow rate on the growth of the CNTs on the surface of the silver electrode. It is obvious from this figure

 (a) (b)
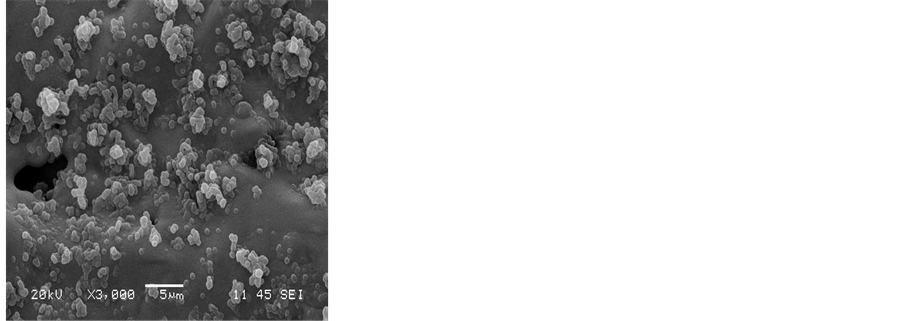
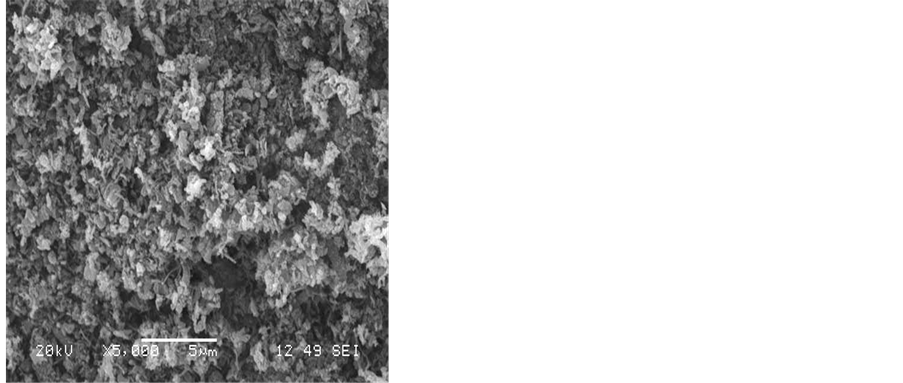
Figure 2. SEM images show the effects of the flow rates of hydrogen and acetylene on the formation of CNTs on the silver electrode H2:C2H2, a) 10:100, b) 10:75 mL/min. The reaction temperature and time were fixed at 700˚C and 15 min.
that there is no real growth of CNTs on the surface of the silver electrode. It seems that hydrogen at a flow rate of 10 ml/min has no significant effect on the growth of CNTs. At this value of flow rate there will be no enough hydrogen in the reaction chamber that can activate the surfaces of the Fe nanoparticles to act as a catalyst. Thus these particles will remain as iron carbide nanoparticles. However, as can be seen from Figure 2, small amounts of carbon nanoparticles were formed due to the cracking of acetylene gas at a high flow rate.
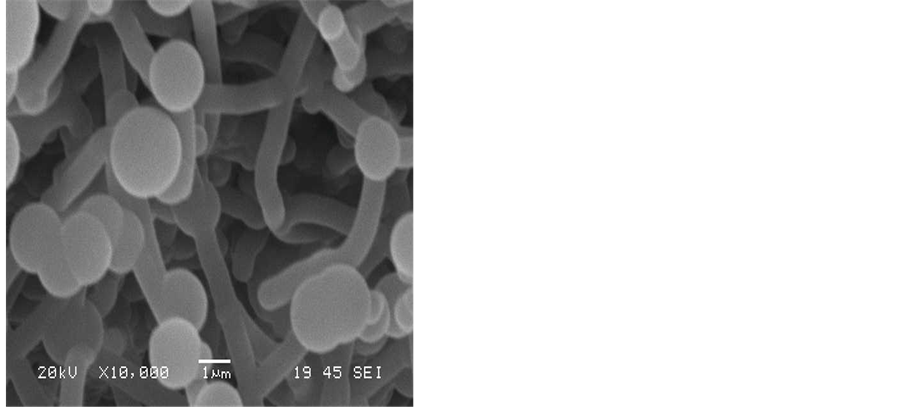
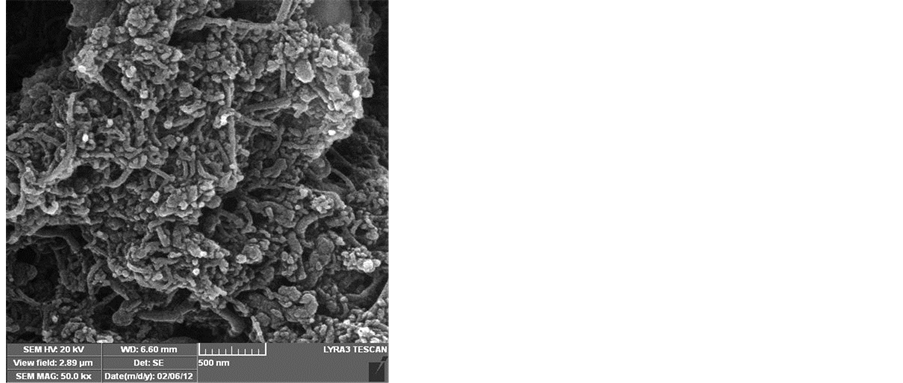
Increasing the hydrogen flow rate to a value of 25 ml/min was found to increase the formation of solid carbon on the surface of the iron catalyst as is shown from the SEM images in Figure 3. From these images it is apparent that hydrogen has a significantly effect on the carbon deposition characteristics. As the hydrogen content of the gas is increased, there is a gradual increase in the amount of the solid carbon formed on the Fe catalyst. It was also noted that the deposition of CNTs of high purity requires a hydrogen flow rate of 25 ml/min and that of acetylene to be 75 ml/min.
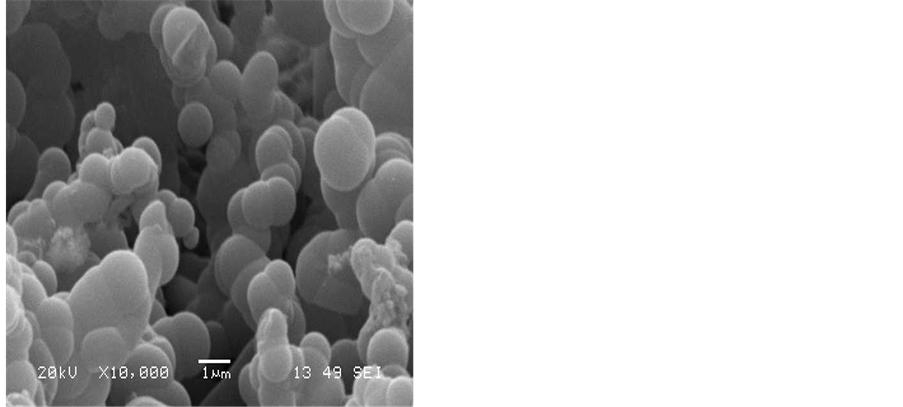
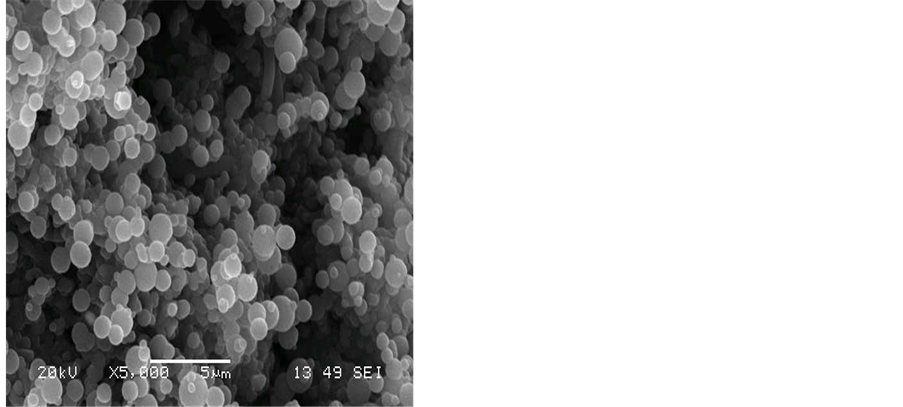
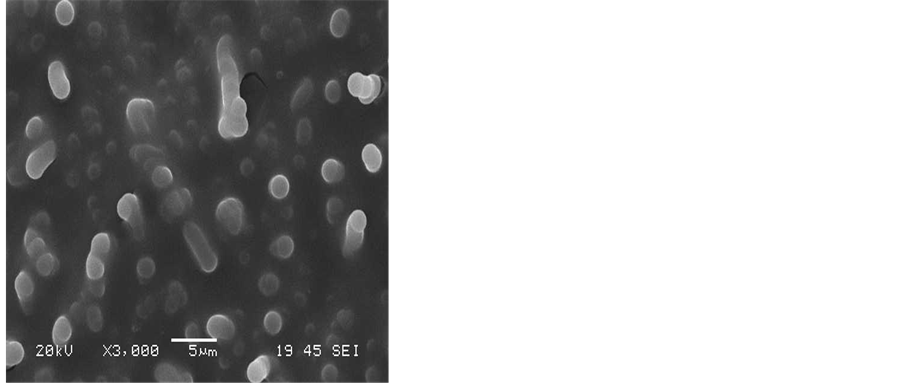
At higher flow rates of hydrogen for instance at 50 mL/min., amorphous carbon materials were formed. Figure 4 shows that lumps of carbon nanoparticles and carbon nanofibres have formed on the surface of the silver electrode. The amount of amorphous carbon materials increases with the hydrogen flow rate. However, carbon nanotubes of low purity were also produced at such conditions.

 (a) (b)
 (c) (d)
Figure 3. SEM images showing the effect of hydrogen flow rate to acetylene flow rate on the formation of CNT on the silver electrode: H2:C2H2, a) 25:100, b) 25:75, c) 25:50, d) 25:25 mL/min. Reaction temperature 700˚C and the reaction time was 15 min.
 (a) (b)
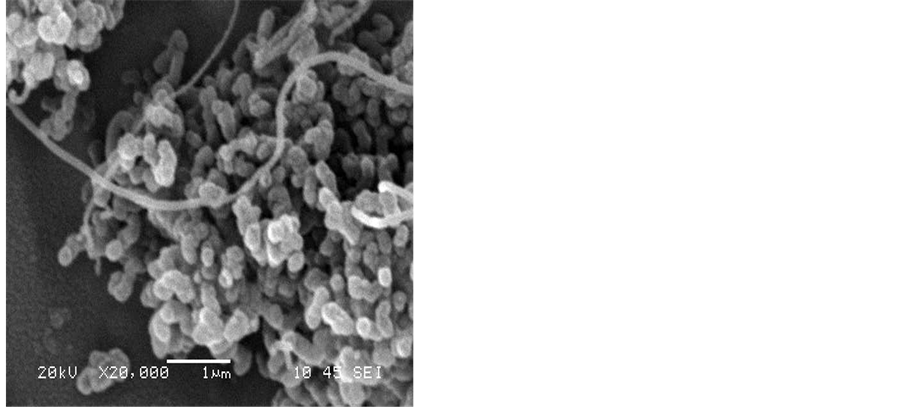
 (c) (d)
Figure 4. SEM images showing the effect of hydrogen flow rate to acetylene flow rate on the formation of CNT on the silver electrode H2:C2H2, a) 50:100, b) 50:75, c) 50:50, d) 50:25 mL/min. The reaction temperature and time were fixed at 700˚C and 15 min.
3.2. Effect of the Reaction Temperature on the Growth of CNTs on the Surface of the Silver Electrode
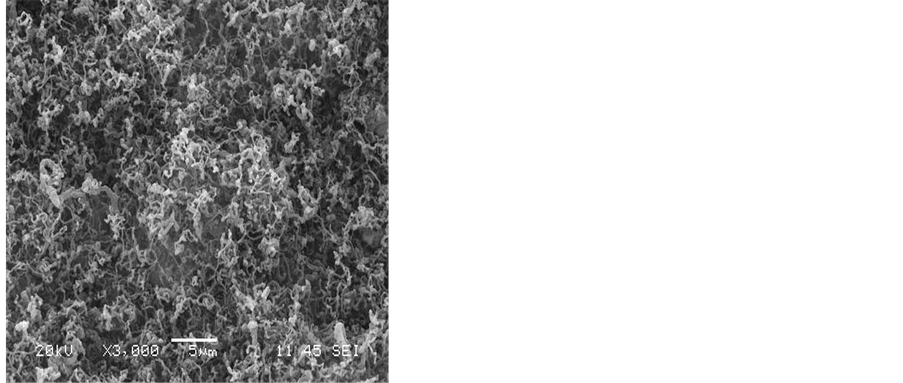
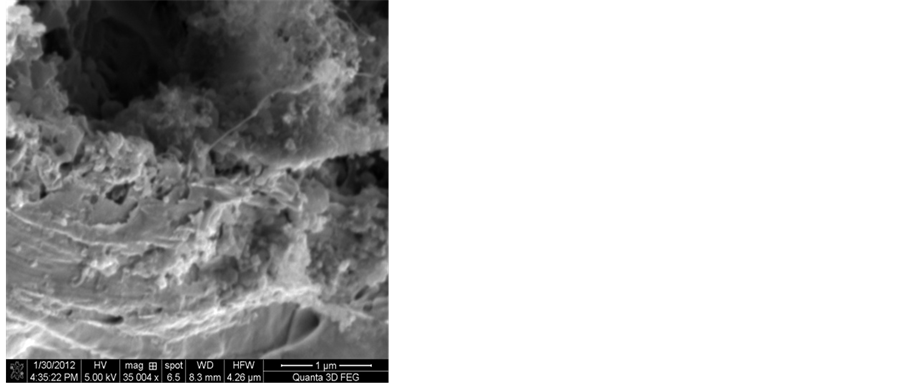
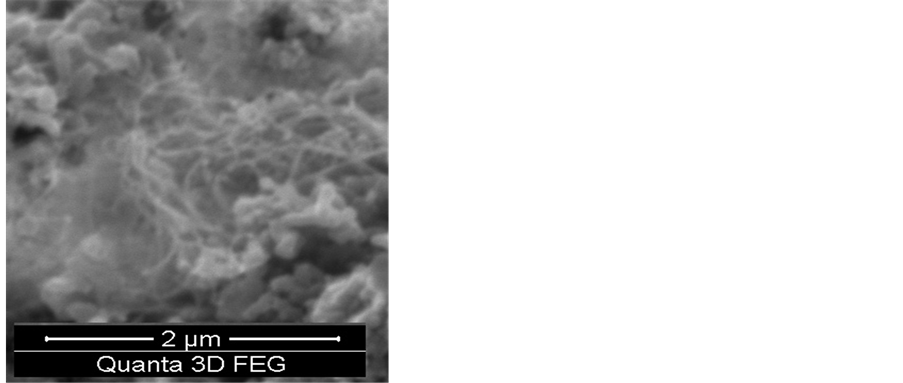
To obtain a good yield of CNTs that have high purity, the effect of the reaction temperature was also investigated. Amorphous carbon layers, nanoparticles and carbon nanotube CNTs were observed when the reaction temperature was varied from 600˚C - 850˚C. Figure 5 shows the SEM images of the formation of carbon nanotubes produced at the six reaction temperatures studied between 600˚C and 850˚C. The reaction time was 30 minutes using a hydrogen flow rate of 25 ml/min and an acetylene flow rate of 75 ml/min. The SEM images reveal that CNTs cannot grow on silver substrate at reaction temperatures below 600˚C or above 850˚C. However, the CNTs have grown with different structures when the reaction temperature was between 600˚C and 750˚C as can be seen from Figure 5(a) - Figure 5(d). Figure 5(e) shows that at a reaction temperature of 800˚C, a lot of amorphous carbon mixed with various quantities of fine carbon nanotubes can be observed. Increasing the temperature to 850˚C has resulted in many carbon fibers as can be seen from Figure 5(f).

 (a) (b)
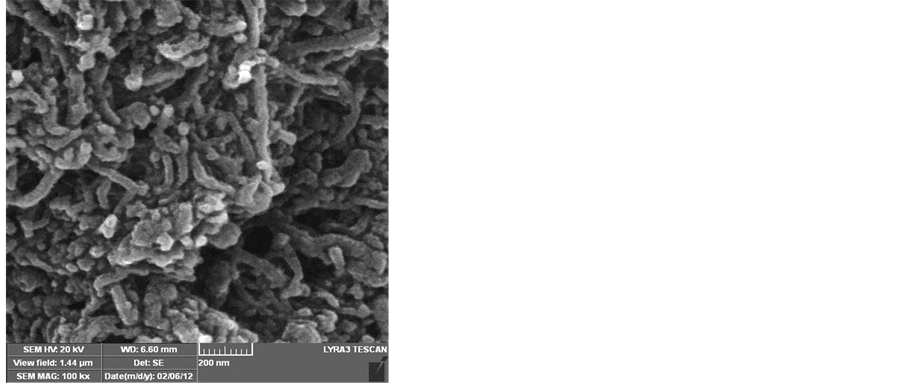
 (c) (d)
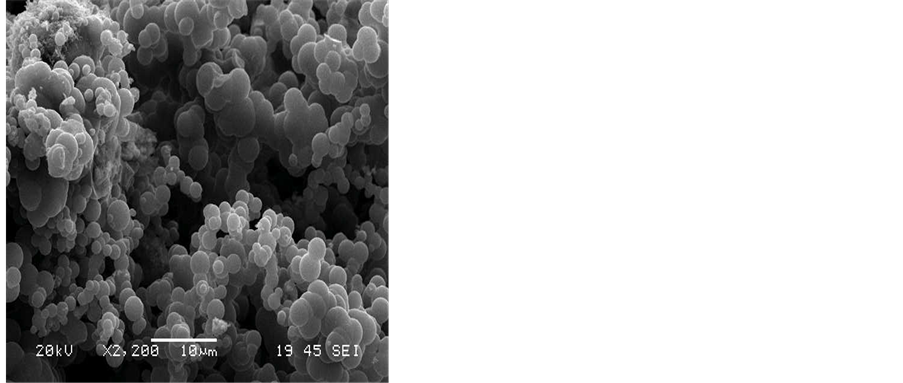
 (e) (f)
Figure 5. SEM images showing the effect of the reaction temperature on the growth of CNTs on silver electrodes a) 600˚C, b) 650˚C, c) 700˚C, d) 750˚C, e) 800˚C, f) 850˚C, flow rates (H2 25:75 C2H2), reaction time 30 min.
3.3. Effect of the Reaction Time on the Growth of CNTs on Silver Substrate
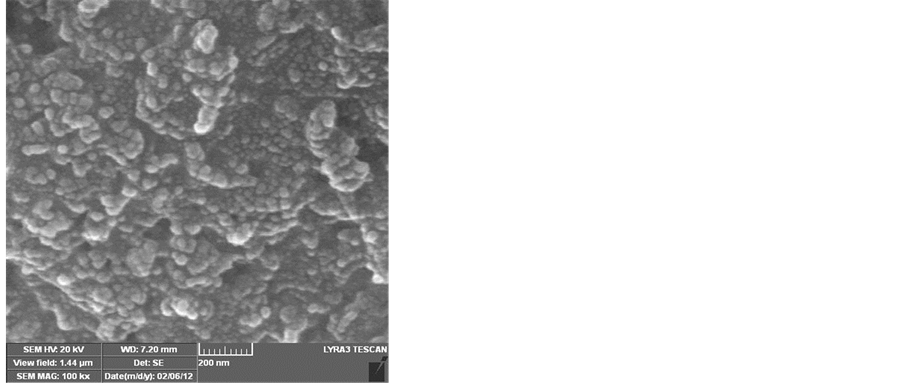
The effect of the reaction time was studied by varying this time from a period of 10 min - 60 min. As can be seen from the SEM images shown in Figure 6, no growth was observed at the reaction time of 10 min. On increasing the reaction time to15 min, it seems that this time is considered an optimum for the complete growth of the carbon nanotubes. However, increasing the reaction time above 15 min has resulted in reducing the purity of the CNTs and an amorphous carbon was formed Figure 6.
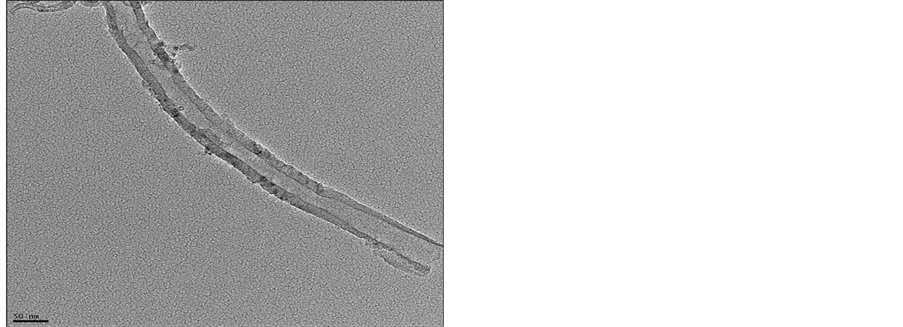
3.4. TEM Images of CNTs
TEM was carried out to characterize the structure of the nanotubes that have grown at the optimum conditions. These conditions include a reaction temperature of 700°C, a hydrogen flow rate of 25 ml/min of, acetylene flow rate of 75 ml/min. and a reaction time of 15 min. To prepare TEM samples, some alcohol was dropped on the nanotubes film, then, these films were transferred with a pair of tweezers to a carbon-coated copper grid. The TEM images of the carbon nanotubes are depicted in Figures 7(a) (b) and Figure 7(c). It is obvious, from these images that most of the nanotubes appear to be hollow with a tubular shape. However, in some of these images, catalyst particles can be seen inside the produced carbon nanotubes. Figure 7 shows that the diameters of the carbon nanotubes are in the range of 10 nm - 30 nm. It is evident from the TEM images that pure carbon nanotubes of a uniform diameter were produced when the hydrogen flow rate was 25 ml/min. It was also observed that the shape of the catalyst, which served as a seed during the production process, is important because the produced CNTs assume to follow the shape of this catalyst.
3.5. The Performance of the Ag-CNTs Electrodes
The performance of each pair of Ag-CNTs electrodes prepared under the different conditions applied was investigated by using these electrodes as an indicating system in the microtitration of 10 µL of 0.05 M chloride with a standard solution of 0.05 M AgNO3. The setup of the microtitration was described earlier [22] . The dc differential electrolytic potentiometry was applied where the electrodes were polarized by a constant current of 3µA. Figure 8 shows the resulting titration curves. It is obvious from Figure 8(a) that this titration curve represents the normal response of the polarized electrodes. The curve is in the form of a symmetrical peak with considerable height and the end-point can be easily located from its tip. The SEM image of one of these electrodes is depicted in Figure 5(b) which shows the normal deposition of the CNTs on the surface of the silver electrode. The titration curve 8. B is symmetrical, but its position has shifted and the tip of the peak gives a wrong end-point. This is due to abnormal deposition of the CNTs on the surface of the electrodes. The SEM of this type of electrode is depicted in Figure 5(d).
The performance of the Ag-CNTs electrodes prepared under the optimum conditions was further investigated by comparing their performance to that of the bare silver electrodes during the micro titration of cyanide with silver nitrate using mark-space bias differential electrolytic potentiometry [6] [7] [22] . Figure 9 shows the results of titrating a volume of 10 µL of 0.05 M cyanide with a solution of 0.05 M silver nitrate. This titration was repeated for three times using bare silver electrodes as an indicating system. It is obvious that the resulting titration curves are poor and the end-points cannot be easily located from such curves. However, when these titrations were repeated using the Ag-CNTs electrodes as an indicating system, the resulting titration curves were found to be normal and the end points can be easily located from these curves as can be seen from Figure 10. In addition Table 1 show a better accuracy and precession of Ag-CNT compared to bare silver electrode.
To further investigate the behavior of the Ag-CNTs electrodes, different volumes of the cyanide solution were titrated and the results are shown in Figure 11. By applying these Ag-CNTs electrodes, a volume of 1.2 µL of cyanide can be titrated and the endpoint can be easily located from the resulting titration curve.
4. Conclusion
For the first time, effective silver electrodes coated with CNTs were prepared using the CVD method. The optimum conditions were investigated by applying these electrodes as an indicating system in the titration of chloride with silver nitrate using dc DEP. The effective electrodes were applied in the micro titration of cyanide with silver nitrate using m.s.b. DEP. A volume of 1.2 uL of cyanide was successfully titrated using the prepared electrodes and the end point was easily located from the resulting titration curve.
 (a) (b)
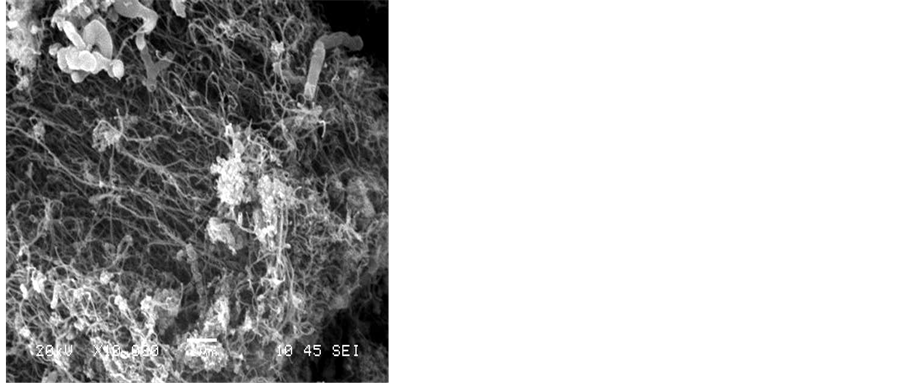
 (c) (d)
 (e) (f)
Figure 6. SEM images show the effect of the reaction time on the growth of CNTs on the silver electrode a) 10 min. b) 15 min. c) 30 min. d) 60 min. e) 90 min. f) 120 min. Flow rates (H2 25:75 C2H2) and a reaction temperature of 700˚C.
 (a) (b)
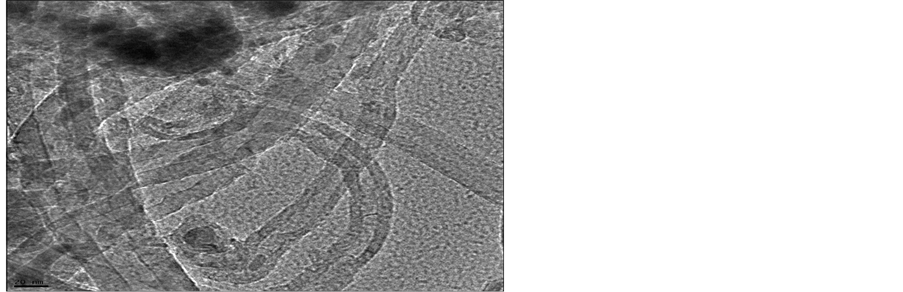 (c)
(c)
Figure 7. TEM image of CNT grown on a silver by CVD.
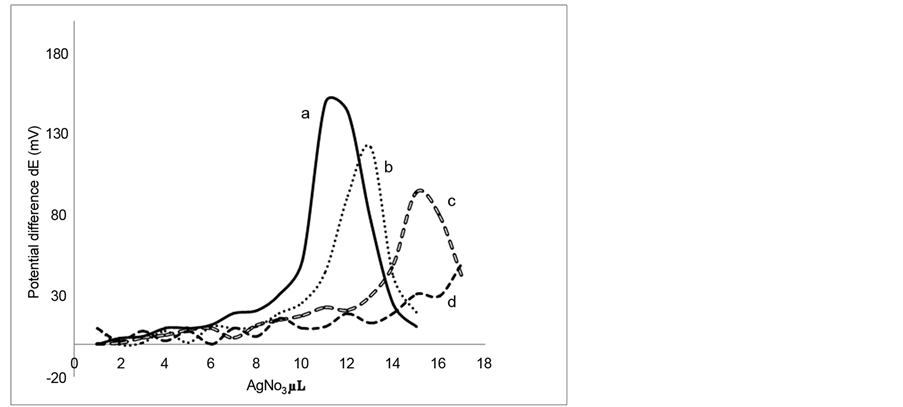
Figure 8. Dc DEP titration of 10 µL of 0.05 M NaCl with 0.05 M AgNO3 using 0.1 M KNO3 as a supporting electrolyte and Ag-CNT electrodes prepared at the conditions: a): Flow rate H2: acetylene = 25:75 mL/min. temp. = 700˚C and reaction time 15 min. b): Flow rate H2: acetylene = 50:25 mL/ min. temp. = 700˚C and reaction time 60 min. c): Flow rate H2: acetylene = 25:75 mL/min. temp. = 600˚C and reaction time 15 min. d): Flow rate H2: acetylene = 50:25 mL/min. temp. = 700˚C and reaction time 15 min. This is in agreement with the information deduced from the SEM images.
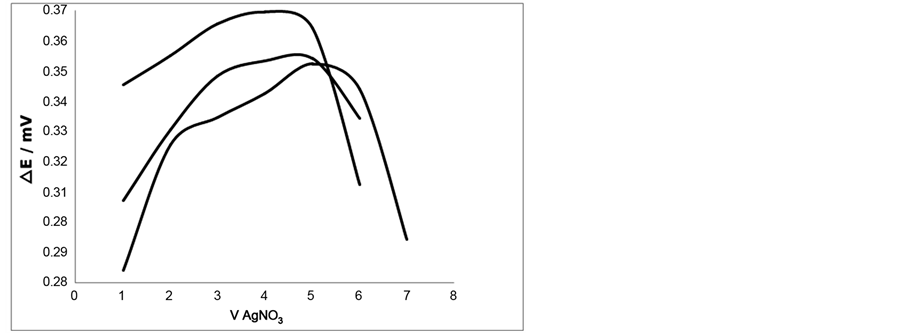
Figure 9. Titration of 10 µL (three times) of 0.05 M cyanide with AgNO3 using m.s.b.-DEP (5% bias) and bare silver electrodes as an indicating system.
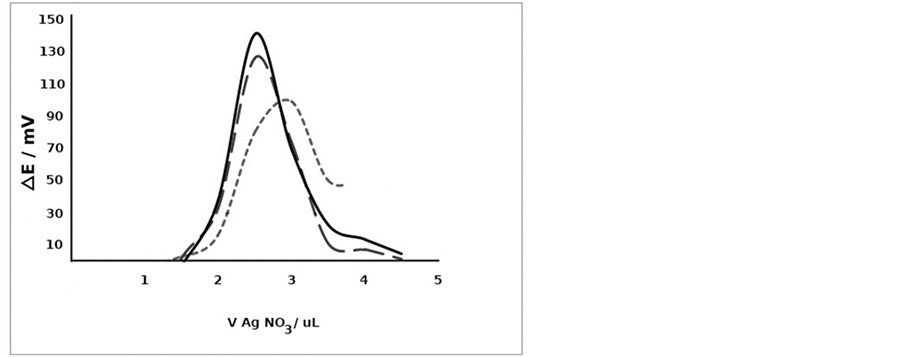
Figure 10. Titration of 5 µL (three times) of 0.05 M cyanide with AgNO3 using m.s.b.-DEP (5% bias) and Ag-CNTs electrodes as an indicating system.
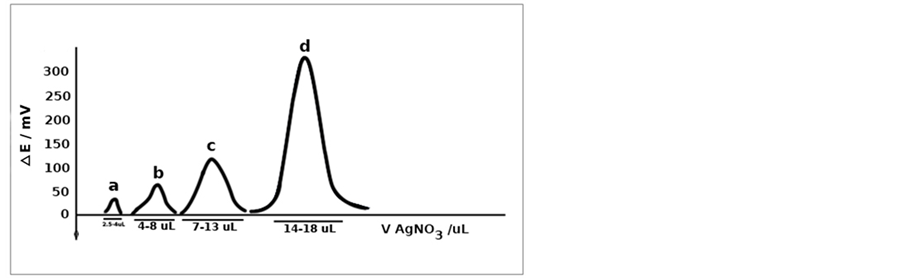
Figure 11. Titration of a-1.2 µL, b-4 µL, c-10 µL and d-20 µL of 0.05 M cyanide with AgNO3 using m.s.b.-DEP (5% bias) and Ag-CNTs electrodes as an indicating system.

Table 1. Accuracy and precision of cyanide sample microtitration by ac-DEP (n = 3).
Acknowledgements
The authors acknowledge the financial support of King Abdulaziz City for Science and Technology (KACST) under project APR-30-59. The support of Chemistry department at King Fahd University of Petroleum& Minerals is also acknowledged.
References
- Bishop, E. (1958) Differential Electrolytic Potentiometry. Part II. Precision and Accuracy of Applications to Redox Titrimetry. Analyst, 83, 985-212. http://dx.doi.org/10.1039/an9588300212
- Bishop, E. and Short, G.D. (1962) Differential Electrolytic Potentiometry. Part VI. The Precision and Accuracy of Applications to Acid-Base Titrations with Antimony Electrodes. Analyst, 87, 467. http://dx.doi.org/10.1039/an9628700467
- Bishop, E.R. and Dhaneshwer, B. (1962) Differential Electrolytic Potentiometry. Part V. The Precision And accuracy of Applications to Argentimetry. Analyst, 87, 207. http://dx.doi.org/10.1039/an9628700207
- Bishop, E. (1956) Ultramicro Potentiometric Titrimetric Analysis Differential Electrolytic Potentiometry in Redox Systems. Microchimca Acta, 44, 619-629.
- Malmstadt, H.V. and Fett, E.R. (1955) Automatic Differential Potentiometric Titrator. Analytical Chemistry, 27, 1348.
- Abdennabi, A.M.S. and Bishop, E. (1982) Differential Electrolytic Potentiometry with Periodic Polarisation. Part XXV. Direct and Mark-Space Biased Periodic Current Polarisation in Acid-Basetitrimetry in Acetic Anhydride-Acetic Acid. Analyst, 107, 1032. http://dx.doi.org/10.1039/an9820701032
- Al-Ghannam, S.M. and Al-Olyan, A.M. (2005) Differential Electrolytic Potentiometric Titration of Vitamin C in Pharmaceutical Preparations. Journal of Food and Drug Analysis, 13, 295-300
- Ajayan, P.M. (1999) Nanotubes from Carbon. Chemical Reviews, 99, 1787-1800. http://dx.doi.org/10.1021/cr970102g
- Odom, T.W., Huang, J.L., Kim, P. and Lieber, C.M. (1998) Atomic Structure and Electronic Properties of Single- Walled Carbon Nanotubes. Nature, 391, 62-64. http://dx.doi.org/10.1038/34145
- Jang, J.W., Lee, D.K., Lee, C.E., Lee, T.J., Lee, C.J. and Noh, S.J. (2002) Metallic Conductivity in Bamboo-Shaped Multiwalled Carbon Nanotubes. Solid State Communications, 122, 619-622. http://dx.doi.org/10.1016/S0038-1098(02)00153-9
- Tekleab, D., Czerw, R., Carroll, D.L. and Ajayan, P.M. (2000) Electronic Structure of Kinked Multiwalled Carbon Nanotubes. Applied Physics Letters, 76, 3594-3596. http://dx.doi.org/10.1063/1.126717
- Nugent, J.M., Santhanam, K.S.V., Rubio, A. and Ajayan, P.M. (2001) Fast Electron Transfer Kinetics on Multiwalled Carbon Nanotube Microbundle Electrodes. Nano Letters, 1, 87-91. http://dx.doi.org/10.1021/nl005521z
- Gong, K., Yan, Y., Zhang, M., Su, L., Xiong, S. and Mao, L. (2005) Electrochemistry and Electroanalytical Applications of Carbon Nanotubes: A Review. Analytical Sciences, 21, 1383-1393. http://dx.doi.org/10.2116/analsci.21.1383
- Wang, J. (2005) Carbon-Nanotube Based Electrochemical Biosensors: A Review. Electroanalysis, 17, 7-14. http://dx.doi.org/10.1002/elan.200403113
- Merkoçi, A., Pumera, M., Llopis, X., Pérez, B., del Valle, M. and Alegret, S. (2005) New Materials for Electrochemical Sensing VI: Carbon Nanotubes. TrAC Trends in Analytical Chemistry, 24, 826-838. http://dx.doi.org/10.1016/j.trac.2005.03.019
- Collins, P.G. and Avouris, P. (2000) Nanotubes for Electronics. Scientific American, 283, 62-69.
- Ebbesen, T.W. and Ajayan, P.M. (1992) Large-Scale Synthesis of Carbon Nanotubes. Nature, 358, 220-222. http://dx.doi.org/10.1038/358220a0
- Guo, T., Nikolaev, P., Thess, A., Colbert, D. and Smalley, R. (1995) Catalytic Growth of Single-Walled Nanotubes by Laser Vaporization. Chemical Physics Letters, 243, 49-54. http://dx.doi.org/10.1016/0009-2614(95)00825-O
- Beckman, W. (2007) UC Researchers Shatter World Records with Length of Carbon Nanotube Arrays. University of Cincinn, Cincinnati.
- Inami, N., Ambri Mohamed, M., Shikoh, E. and Fujiwara, A. (2007) Synthesis-Condition Dependence of Carbon Nanotube Growth by Alcohol Catalytic Chemical Vapor Deposition Method. Science and Technology of Advanced Materials, 8, 292-295. http://dx.doi.org/10.1016/j.stam.2007.02.009
- Ishigami, N., Ago, H., Imamoto, K., Tsuji, M., Iakoubovskii, K. and Minami, N. (2008) Crystal Plane Dependent Growth of Aligned Single-Walled Carbon Nanotubes on Sapphire. Journal of the American Chemical Society, 130, 9918-9924. http://dx.doi.org/10.1021/ja8024752
- Abulkibash, A.M., Al-Absi, M. and aziz Nabil Amro, A. (2013) Microtitrimetry by Controlled Current Potentiometric Titration. Journal of Analytical Chemistry, 68, 57-60. http://dx.doi.org/10.1134/S1061934813010024
NOTES

*Corresponding author.