American Journal of Analytical Chemistry
Vol. 3 No. 5 (2012) , Article ID: 19449 , 8 pages DOI:10.4236/ajac.2012.35052
A Validated Stability Indicating RP-UPLC Method for Atrovastain Calcium
Centre for Chemical Sciences and Technology, Institute of Science and Technology, JNT University, Hyderabad, India
Email: *kmukkanti@yahoo.com
Received March 3, 2012; revised March 28, 2012; accepted April 8, 2012
Keywords: Stability Indicating Study; Atrovastatin Calcium; Liquid Chromatography and Impurities
ABSTRACT
The present paper describes stability indicating reverse phase Ultra performance liquid chromatographic (RPLC) assay method for Atrovastatin Calcium in bulk drugs. The developed method is also applicable for the related substance determination and degradation products generated from forced decomposition studies. The drug substance was subjected to stress conditions of acid hydrolysis, base hydrolysis, oxidation, photolysis and thermal degradation. The degradation of Atrovastatin was observed under acid hydrolysis, base hydrolysis and peroxide hydrolysis. The drug was found to be stable to other stress conditions attempted. Successful separation of the drug from synthetic impurities and degradation product formed under stress conditions was achieved on a C18 column using buffer 0.02 M phosphoric acid and acetonitrile. The developed UPLC method was validated with respect to linearity, accuracy, precision, specificity and robustness. The developed UPLC method to determine the related substances and assay determination of Atrovastatin can be used to evaluate the quality of regular production samples. It can be also used to test the stability sample of Atrovastatin Calcium.
1. Introduction
Atrovastatin is a synthetic hydroxyl methyl glutaryl coenzyme A (HMG-CoA) reductage inhibitor that has been demonstrated to be efficacious in reducing both cholesterol and triglyceride. It is administered as the calcium salt of the active hydroxyl acid and is used to reduce the raised levels in patients with primary hyperlipidemia or combined hyperlipidemia [1,2]. Chemically, ATV (3R, 5R)-7-[2-(4-fluorophenyl)-3-phenyl-4-(phenylcarbamoyl)-5-(propan-2-yl)-1H-pyrrol-1-yl]-3,5-dihydroxy-heptan oic acid calcium salt (2:1) trihydrated [3]. Atv Ca is a white to off white powder.
The HPLC coupled with UV detection was used for determination of this lipid lowering drug in pharmaceutical preparations [4-7]. In recent years, several LC-MS methods have been developed for quantification of Atv and its metabolites in plasma [8,9], Atrovastatin calcium and its impurities (Figure 1). In the literature, a few HPLC-UV methods are available for simultaneous analysis of Atv and its impurities.
The developed UPLC RP-HPLC method has good separation for all impurities including Atovastatin and analyzed time is very less while comparative with all methods. By using this method about 100 samples are analyzing in QC Dept with reproducible results. It is very useful for our QC dept and manufacturing dept to get results within short period.
To our knowledge, there have been no data describing the superior validated stability indicating UPLC method for Atrovastatin Calcium. Therefore, the aim of the present study was to establish inherent stability of Atv through stress studies under a variety of ICH recommended test conditions and to develop a stability indicating assay [10].
2. Experimental
2.1. Chemicals
Samples of Atrovastatin Calcium and its five potential impurities namely Imp-A, Imp-B, Imp-C, Imp-D and Imp-E were received from Inogent Laboratories, Hyderabad, India and the chemical structures are given in Figure 1. LC grade acetonitrile was purchased from Merck, Darmstadt, Germany. Analytical reagent grade Phosphoric Acid was also purchased from Merck. High purity water was prepared by using a Milli-Q plus purification system (Millipore, Bedford, MA, USA).

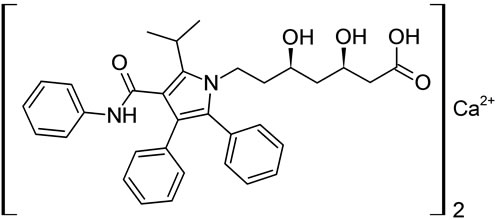

Atrovastatin calcium Imp-A Imp-B
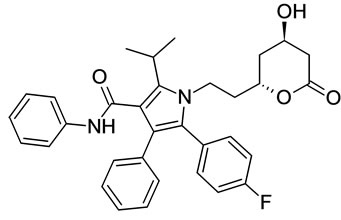
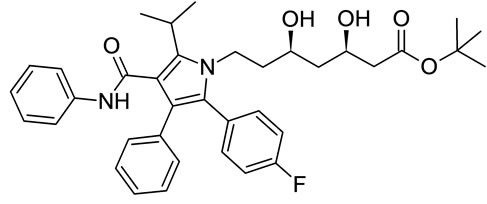
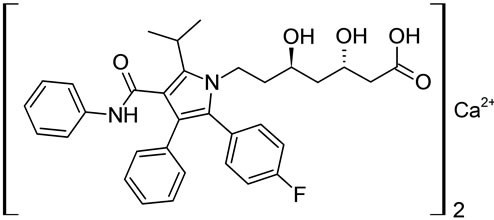
Imp-C Imp-D Imp-E
Figure 1. Chemical structures of Atrovastatin calcium and its impurities.
2.2. Instrumentation and Chromatographic Conditions
The UPLC system used for the method development, forced degradation studies and method valida-tion was a waters Accquiy quaternary pump plus auto sampler and Photo diode array detector. The output signal was monitored and processed using Empower software on Pentium computer. Photo stability studies were carried out in a photo stability chamber (sanyo, Leicestershire, UK). Thermal stability studies were performed in a dry air oven (Mack Pharmatech, Hyderabad).
Chromatographic separation was performed using a reverse phase Zorbax Extended C18 column (50 × 3.0 mm i.d., 1.8 µm). The mobile phase consisted of ortho phosphoric acid and acetonitrile. The flow rate was set to be 0.5 mL·min–1.
2.3. Sample Preparation
A commercial tablet of Lipitor (80 mg) was weighed, placed in 100 ml volumetric flask and dissolved in a mixture of acetonitrile and water solution (50:50, v/v). This solution was sonicated for 15 min at room temperature and then topped off to volume. After shaking, 40 ml of the flask content were transferred into 100 ml volumetric flask and diluted with acetonitrile and water (50/50, v/v). An aliquot was filtered through a nylon membrane filter.
2.4. Standards Preparation
A stock solution of Atrovastatin calcium (200 µg·mL–1) and all impurities (200 µg·mL–1) were prepared in diluent. The spiked solutions were prepared by taking 0.05%, 0.075%, 0.010%, 0.125%, 0.150% and 0.2% of all impurities in diluent from stock solutions for the evaluation of limit of detection, limit of quantification and linearity in accordance with ICH guide lines. Atrovastatin sample solution from stock spiked with 0.05%, 0.075%, 0.010%, 0.125%, 0.150%, 0.2%, 0.25% and 0.3% of all impurities to establish accuracy, precision and robustness. The quantities of impurities were calculated from their peak areas.
2.5. Validations
The objective of method validation is to demonstrate that it is suitable for its intended purpose as it stated in International Conference on Harmonization (ICH) and Societe Francaise des Scienceset Techniques pharmaceutiques (SFST) guidelines [11].
An important part of method validation is the system suitability test (pharmacopee Europeenne 6th edition). We established a number of theoretical plates, peak symmetry, and resolution for each compound; reputability of the injection (retention time and peak area) was checked.
Recommended validation characteristics including linearity (determination coefficient), accuracy (% recovery, %RSD), precision (%RSD), and selectivity were checked according to ICH and SFSTP requirements [12].
2.5.1. Selectivity
According to ICH [11] stress testing of the drug substances can help the intrinsic stability of the molecule and validated the stability indicating power of the analytical procedures used. The standard conditions for photo stability testing are described in ICH Q1B [12]. The stress conditions employed for the degradation study included light (carried out as per ICH Q1B), heat (60˚C), acid hydrolysis (1 N HCl), base hydrolysis (1 N NaOH), water hydrolysis and oxidation (6% peroxide). For heat and light studies, the study period was 10 days whereas for acid, base, water hydrolysis and oxidation, it was 48 h. Peak purity of stressed samples of Atrovastatin Ca was checked by using a Photo diode array detector from waters. The purity angle within the purity threshold limit obtained in all stressed samples demonstrated the analyte peak homogeneity.
Assay studies were carried out for stress samples against qualified reference standard and mass balance (% assay + % impurities +% of degradation products) were calculated.
2.5.2. Precision
The precision of the related substance method was checked by injecting six individual preparations (300 µg·mL–1) of Atrovastatin Calcium each spiked with 0.3% impurity. The %RSD for percentage of each impurity was calculated. Intraday precision was also determined.
Assay method precision was evaluated by carrying out six independent assays of test samples of Atrovastatin Calcium against qualified reference standard. The %RSD of six assay values obtained was calculated. The intermediated precision of the related substances method and assay method was evaluated by different analyst and by using a different instrument from the same laboratory.
2.5.3. Linearity
Linearity solutions were prepared from stock solution at a six concentration levels from 25% to 200% of assay analyte concentration (300 µg·mL–1) (25%, 50%, 75%, 100%, 150% and 200%).For the chromatographic purity method concentration levels ranging from LOQ to 200% of analytical concentration (300 µg·mL–1) (LOQ, 25%, 50%, 75%, 100%, 150%, and 200%) were prepared. Calibration equation obtained from regression analysis was used to calculate the corresponding predicted responses. The residuals and sum of the residuals squares, % y-intercept for both the assay and chromatographic purity method was calculated.
2.5.4. Sensitivity
Sensitivity was determined by establishing the limit of detection (LOD) and limit of quantification (LOQ) for imp-A, imp-B, imp-C and imp-D established at a signal to noise ratio of 3:1 and 10:1, respectively, by injecting a series of diluted solutions with known concentration solutions. The precision study was also carried out at the LOQ level by injecting six individuals’ preparations of imp-A, imp-B, imp-C and imp-D and calculates the %RSD for the area of each impurity.
2.5.5. Accuracy
The accuracy of the assay method was evaluated in triplicate at six concentration levels, i.e. 50, 75, 100, 125, 150, 200 µg·mL–1. The percentage of recoveries was calculated from the slope and Y-intercept of the calibration curve obtained from linearity studies.
The accuracy study of impurities was carried out in triplicates at 0.05%, 0.075%, 0.1%, 0.125%, 0.15%, 0.2%, 0.25% and 0.3% of the impurity stock concentration (300 µg·mL–1). The percentage of recoveries for impurities were calculated from the 0.15% of standard solution.
2.5.6. Robustness
To determine the robustness of the developed method, experimental conditions were deliberately altered and resolution between Atrovastatin Calcium and imp-A, imp-B, imp-C and imp-D was recorded.
The flow rate of the mobile phase was 0.7 ml·min–1. To study the effect of the flow rate on the resolution, flow was changed by 0.1 units from 0.6 to 0.8 ml·min–1 and the effect of the column temperature was studied at 22˚C and 32˚C instead of 27˚C, while the change of the composition of the mobile phase.
2.5.7. Solution Stability and Mobile Phase Stability
The solution stability of Atrovastatin Calcium in assay method was carried out by leaving the both the test solutions of sample and reference standard in tightly capped volumetric flasks at room temperature for 48 h. The same sample solutions were analyzed for 6 h interval up to the study period. The mobile phase stability was also carried out by assaying the freshly prepared sample solutions against freshly prepared reference standard solution for 6 h interval up to 48 h. Mobile phase prepared was kept constant during the study period. The %RSD for the assay of Atrovastatin Calcium was calculated during mobile phase and solution stability experiments.
The solution stability of Atrovastatin Calcium and its impurities in the related substances method was carried out by leaving spiked sample solution in tightly capped volumetric flasks at room temperature for 48 h. Content of imp-A, imp-B, imp-C and imp-D were determined for every 6 h interval up to the study period. The mobile phase stability was also carried out for 48 h by injecting the freshly prepared sample solutions for every 6 h interval. Content of imp-A, imp-B, imp-C and imp-D were checked in the test solutions.
3. Results and Discussion
3.1. Optimization of Chromatographic Conditions
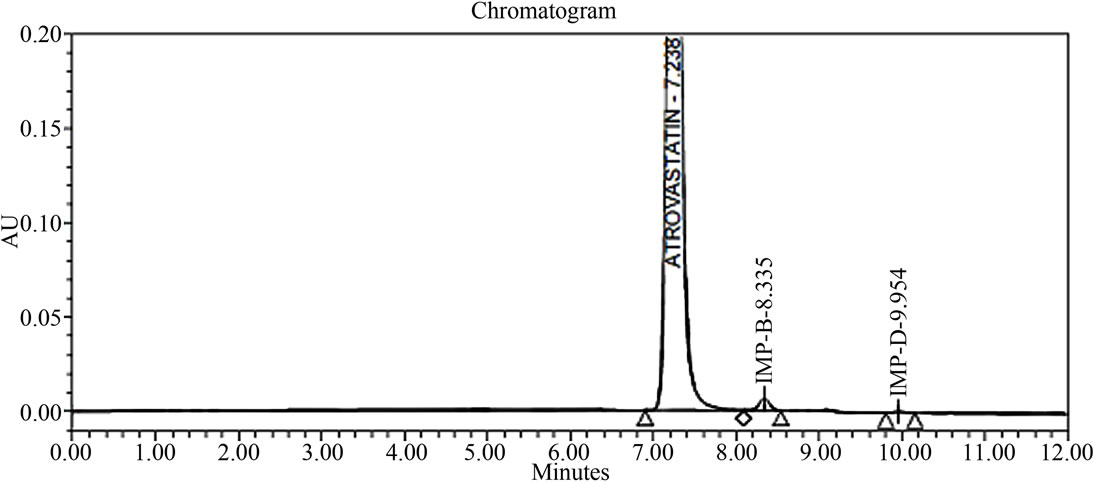
The main objective of the chromatographic method is to separate Atrovastatin Calcium and from imp-A, imp-B, imp-C, imp-D and imp-E impurities were co eluted using different stationary phases such as C8, phenyl and cyno as well as different mobile phases. The chromatographic separation was achieved on a Zorbax Extended C18, 50 × 3.0 mm 1.8 µm columns. The peak shape of Atrovastatin Calcium was found to be symmetrical, imp-A, imp-B, imp-C, imp-D and imp-E were separated with a resolution greater than 2, typical retention times were 6.9, 8.3, 9.1, 9.9 and 10.3 min. respectively. The system suitability results are given in the Table 1 and the developed LC method was found to specific for Atrovastatin Calcium and its five impurities namely imp-A, imp-B, impC, imp-D and imp-E (Figure 2).
3.1.1. Results of Forced Degradation Studies
Degradation behaviors: LC studies on Atrovastatin calcium under different stress conditions suggested the following degradation behaviors.
Degradation in basic solution: In 1 N NaOH at room temperature after 24 h, major degradation was observed.
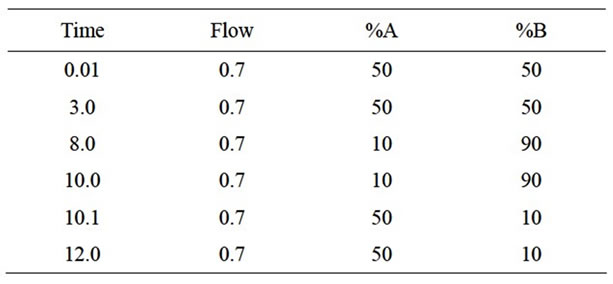
Table 1. Gradient programme.
 (a)
(a)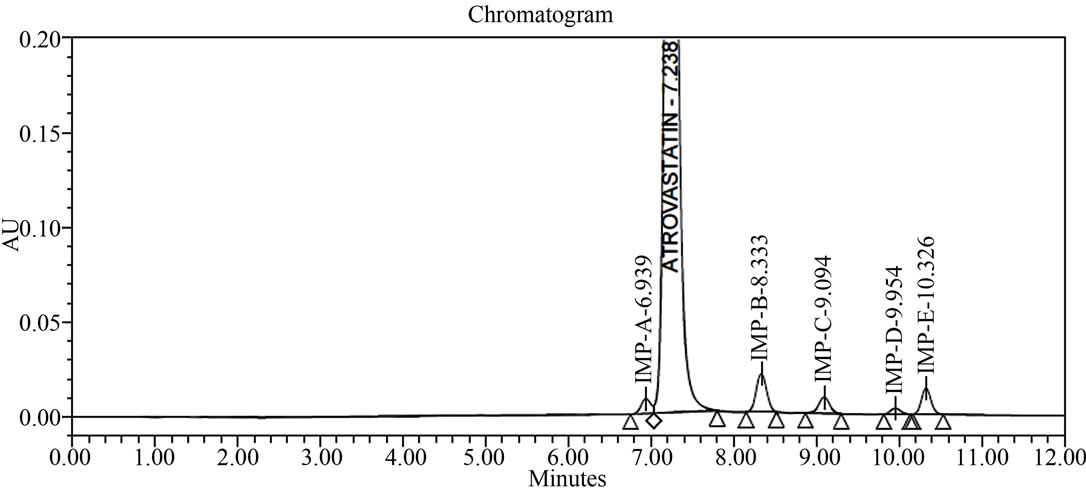 (b)
(b) (c)
(c)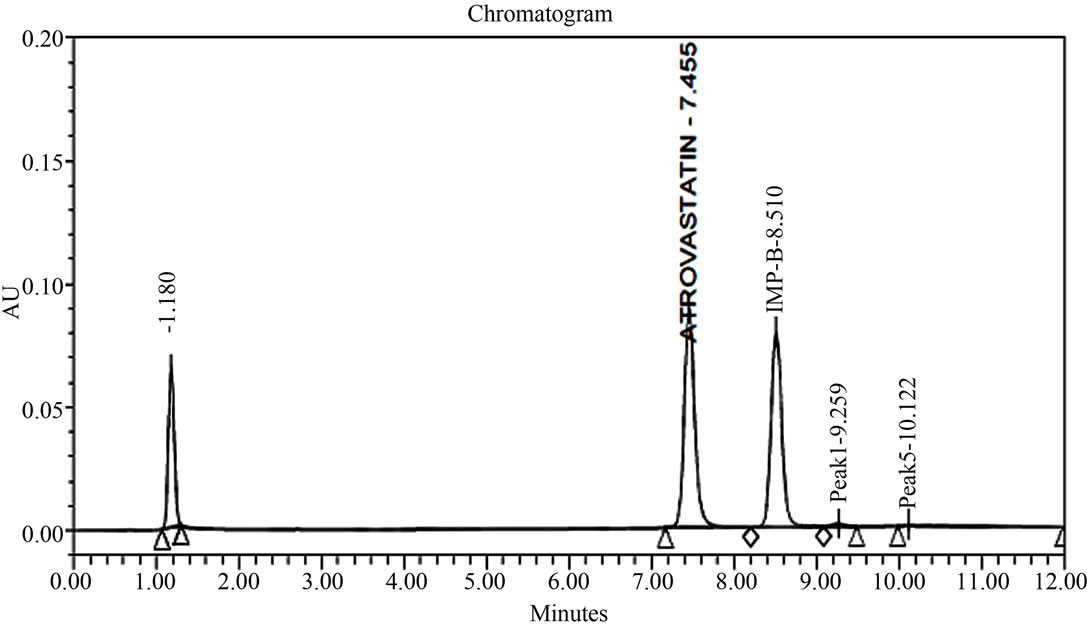 (d)
(d) (e)
(e) (f)
(f)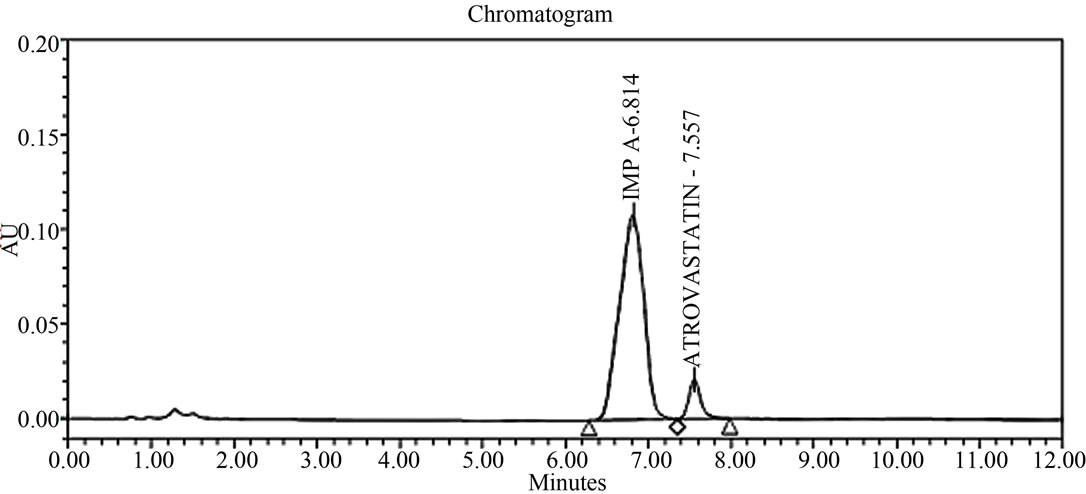 (g)
(g)
Figure 2. Typical HPLC chromatograms of Atrovastatin Calcium under stress conditions. (a) Atrovastatin calcium bulk sample as such; (b) sample spiked with imp-A, imp-B, imp-C, imp-D and imp-E at 0.3% level; (c) diluent spiked with imp-A, imp-B, imp-C, imp-D and imp-E at 0.3% level; (d) Acid hydrolysis (1 N HCl); (e) 3% peroxide hydrolysis; (f) Thermal degradation@80˚C; (g) Base hydrolysis (1 N NaOH).
A major degradation product was observed it converted to imp-A (Table 2).
The Degradation in acidic solution: In 1 N HCl at room temperature major degradation was observed. The drug gradually underwent degradation with time and prominent degradation was observed (17%). A major degradation product was observed (17%) at 1.8 min retention time (Figure 2).
Degradation in neutral (water) solution: No major degradation products were observed after 48 h at room temperature. The drug was also stable in water on heating at 60˚C for 4 h. The drug was stable to water hydrolysis.
Thermal degradation: The drug was stable to the effect of temperature. When the drug powder was exposed to dry heat at 60˚C for 24 h, no degradation was observed.
Oxidative hydrolysis: The drug was exposed to 3% hydrogen peroxide at room temperature for 24 h. The drug was underwent degradation with time 3% hydrogen peroxide and prominent degradation was observed converted to imp-B.
The mass balance of stressed samples was close to 99.6% (Table 3). The assay of Atrovastatin calcium is unaffected in the presence of imp-A, imp-B, imp-C, imp-D and imp-E and its degradation products conforms the stability indicating power of the developed open method.
In all above conditions Atrovastatin is pure and peak purity pass (Table 2). The symmetry factor and column efficiency is looking good in all above conditions (Table 3). The RTs for Impurity-A, Impurity-B, Impurity-C, Impurity-D and Impurity-E are 6.9, 8.3, 9.0, 9.9 and 10.3 (Table 2) and RRTs of Impurity-A, Impurity-B, Impu-
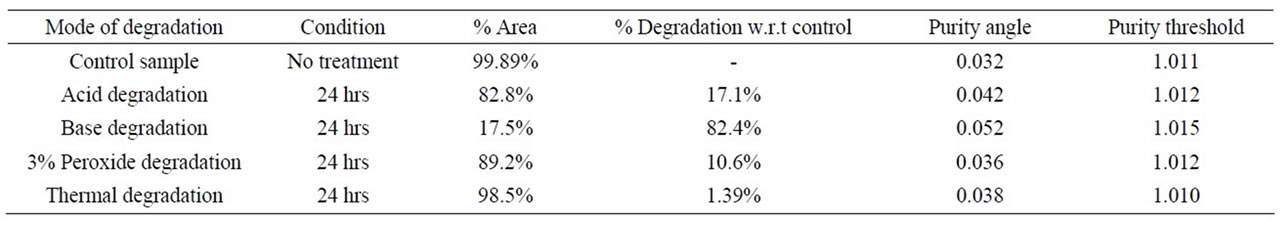
Table 2. Forced degradation studies.
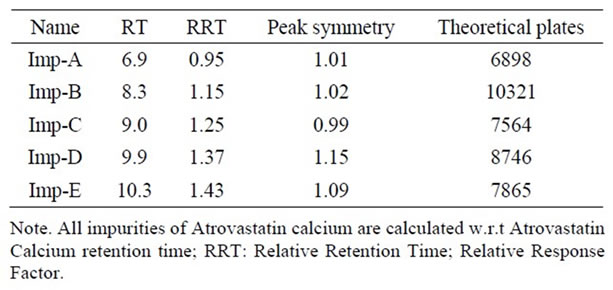
Table 3. RRTs and RTs of Atrovastatin impurities.
rity-C, Impurity-D and Impurity-E are 0.95, 1.15, 1.25, 1.37 and 1.43 (Table 3).
3.1.2. Precision
The %RSD of the assay of Atrovastatin Calcium during the assay method precision study was within 0.05% and the %RSD for the area imp-A, imp-B, imp-C, imp-D and imp-E in related substances method precision study was within 2.1%. The %RSD of the assay results obtained in the intermediated precision study was within 0.1% and the %RSD for the area of imp-A, imp-B, imp-C ,imp-D and imp-E were well within 4.12%, conforming good precision of the method.
3.1.3. Limit of Detection and Limit of Quantification
The limit of detection of all impurities namely imps-A, imp-B, imp-C, imp-D and imp-E was achieved at 2.4 µg·mL–1, 3.2 µg·mL–1, 1.2 µg·mL–1, 3.5 µg·mL–1 and 1.1 µg·mL–1 for 2 µl injection volume (Table 4). The limit of quantification for all impurities namely imps-A, imp-B, imp-C, imp-D and imp-E was achieved at 6.2 µg·mL–1, 11.5 µg·mL–1, 3.8 µg·mL–1, 10.5 µg·mL–1 and 3.1 µg·mL–1 for 2 µl injection volume (Table 4). The precision at LOQ concentration for imp-A, imp-B, imp-C, imp-D and imp-E were below 2.4%.
3.1.4. Linearity
The linearity calibration plot for the assay method was obtained over the calibration ranges tested, i.e. 50 - 200 µg·mL–1 and correlation coefficient obtained was greater than 0.999. The results showed that an excellent correlation existed between the peak area and concentration of the analyte.
Linear calibration plot for the related substances method
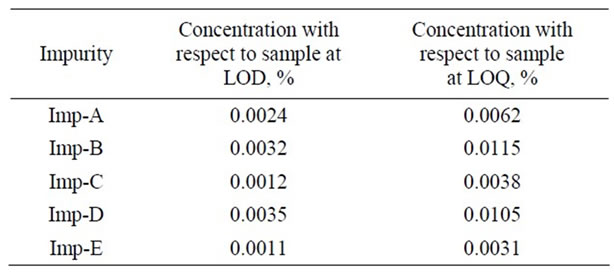
Table 4. LODs and LOQs of impurities by signal to noise ratio method.
was obtained over calibration ranges tested, i.e. LOQ (0.05%) to 0.3% for imp-A, imp-B, imp-C, imp-D and imp-E. The correlation coefficient obtained was greater than 0.999. The above results showed that an excellent correlation existed between the peak area and the concentration of imp-A, imp-B, imp-C, imp-D and imp-E.
3.1.5. Accuracy
The percentage recovery of Atrovastatin calcium in bulk drug sample ranged from 99.8% to 100.8%. The percentage recovery of impurities in Atrovastatin Calcium sample varied from 98.7% to 103.5%.
3.1.6. Robustness
In all the deliberate varied chromatographic conditions (flow rate and column temperature), the resolution between the critical pairs, i.e. Atrovastatin calcium and imp-A was greater than 4.0, illustrating the robustness of the method.
3.1.7. Solution Stability and Mobile Phase Stability
The %RSD of the assay of Atrovastatin calcium during the solution stability experiments were within 0.2%. No significant changes were observed in the content of impurities namely imp-A, imp-B, imp-C, imp-D and imp-E during solution stability and mobile phase stability experiments when performed using the related substance method. The solution stability and mobile phase stability experiment data confirms that the sample solution and mobile phases used during assay and the related substance determination were stable for at least 48 h.
4. Conclusion
The LC method developed for quantitative and related substance determination of Atrovastatin calcium is precise, accurate, rapid and specific. The method was fully validated, and the data found to be satisfactory for all the method validated parameters tested. The developed method is stability indicating and can be conveniently used by a quality control department to determine the related substances and assay of regular Atrovastatin Calcium commercial samples and also stability samples.
5. Acknowledgements
The authors would like to thank the Director, Institute of Science and Technology, Jawaharlal Nehru technological University for their support to carry out this investigation.
REFERENCES
- J. L. Witzum, “Drug Used in the Treatment of Hyperlipoproteinemias,” 9th edition, Mc Graw Hill, New york, 1996.
- L. Posvar, L. L. Radulovic, D. D. Cilla, et al., “Tolarance and Pharmacokinetics of Signal-Dose Atrovastatin, a Potent Inhibitor of HMG-CoA Reductase, in Health Subjects,” The Journal of Clinical Pharmacology, Vol. 36, No. 8, 1996, pp. 728-731.
- S. Budavari, “The Merck Index, an Encyclopaedia of Chemicals, Drugs and Biologicals,”13th edition, Merck, White House Station, 2001.
- T. G. Altuntas and N. Erk, “Liquid Chromatographic Determination of Atorvastatin in Bulk Drug, Tablets, and Human Plasma,” Journal of Liquid Chromatography & Related Technologies, Vol. 27, No. 1, 2004, pp. 83-93. doi:10.1081/JLC-120027087
- M. K. Pasha, S. Muzeeb, S. J. S. Basha, D. Shashikumar, R. Mullangi and N. R. Srinivas, “Analysis of Five HMGCoA Reductase Inhibitors—Atorvastatin, Lovastatin, Pravastatin, Rosuvastatin and Simvastatin: Pharmacological, Pharmacokinetic and Analytical Overview and Development of a New Method for Use in Pharmaceutical Formulations Analysisand In Vitro Metabolism Studies,” Biomedical Chromatography, Vol. 20, No. 3, 2006, pp. 282-293. doi:10.1002/bmc.561
- U. Seshachalam and C. B. Kothapally, “HPLC Analysis for Simultaneous Determination of Atorvastatin and Ezetimibe in Pharmaceutical Formulations,” Journal of Liquid Chromatography & Related Technologies, Vol. 31, No. 5, 2008, pp. 714-721. doi:10.1080/10826070701854402
- S. Erturk, E. S. Aktas, L. Ersoy and S. Ficicioglu, “An HPLC Method for the Determination of Atorvastatin and Its Impurities in Bulk Drug and Tablets,” Journal of Pharmaceutical and Biomedical Analysis, Vol. 33, No. 5, 2003, pp. 1017-1023. doi:10.1016/S0731-7085(03)00408-4
- R. Nirogi, K. Mudigonda and V. Kandikere, “Chromatography-Mass Spectrometry Methods for the Quantification of Statins in Biological Samples,” Journal of Pharmaceutical and Biomedical Analysis, Vol. 44, No. 2, 2007, pp. 379-387. doi:10.1016/j.jpba.2007.02.008
- L. Novakova, D. Satinsky and P. Solich, “HPLC Methods for the Determination of Simvastatin and Atorvastatin,” TrAC Trends in Analytical Chemistry, Vol. 27, No. 4, 2008, pp. 352-367.
- M. Bakshi and S. Singh, “Development of Validated Stability-Indicating Assay Methods—Critical Review,” Journal of Pharmaceutical and Biomedical Analysis, Vol. 28, No. 6, 2002, pp. 1011-1040. doi:10.1016/S0731-7085(02)00047-X
- CPMP/ICH/281/95, “Note for Guidance on Validation of Analytical Procedure: Methodology, ICH Topic Q2B Validation of Analytical Procedure: Methodology, Step 4,” 1996. www.ich.org
- CPMP/ICH/381/95, “Note for Guidance on Validation of Analytical Method: Definition and Terminology, Step 5,” 1994. www.ich.org
NOTES
*Corresponding author.