Journal of Geoscience and Environment Protection
Vol.04 No.06(2016), Article ID:67319,12 pages
10.4236/gep.2016.46007
Fluid Inclusion Studies on Quartz Veinlets at the Ali Javad Porphyry Copper (Gold) Deposit, Arasbaran, Northwestern Iran
Behzad Hajalilou*, Mehraj Aghazadeh
Department of Geology, Payame Noor University, Tehran, Iran

Copyright © 2016 by authors and Scientific Research Publishing Inc.
This work is licensed under the Creative Commons Attribution International License (CC BY).
http://creativecommons.org/licenses/by/4.0/


Received 18 May 2016; accepted 11 June 2016; published 14 June 2016
ABSTRACT
Ali Javad porphyry copper-gold deposit is located in Arasbaran porphyry copper belt at northwestern Iran, some 20 km east of Sungun Mine. Porphyry mineralization at the Ali Javad deposit occurred in post-Oligocene quartz monzonite bodies which intruded in the Eocene volcanic rocks. Mineralization occurred as veins, veinlets and dissemination both as hypogene and supergene type. Several types of veinlets were distinguished during the study of the deposit. Fluid inclusion studies on fluids trapped in quartz which were taken from drill core samples indicated a wide range of homogenization temperature in the veinlets from 138˚C to 565˚C which their salinity demonstrated 33 - 61 wt% NaCl equivalent. Mineralizing fluids density at the deposit was 0.8 - 1.2 g/cm3. Fluid inclusion studies suggested that Ali Javad deposit is an Au-rich porphyry copper deposit; its fluid inclusion features were comparable with other porphyry deposits.
Keywords:
Fluid Inclusion, Silica Veinlet, Porphyry Copper Deposit, Ali Javad, Arasbaran, Iran

1. Introduction
The majority of porphyry deposits were developed as a result of subduction magmatism in syn-subduction and post-collisional tectonic settings [1] . These deposits enjoy similar mineralization and alteration patterns through- out the world [2] - [4] . Porphyry deposits in Iran are distributed in four different zones including Arasbaran, Middle part of Uromieh-Dokhtar volcanoplutonic, Kerman and Eastern Iran belts [5] . Recent studies demonstrated that most of the porphyry deposits in Iran developed in Eocene to Miocene post-collisional settings in the four porphyry mineralization zones and belts [5] . It was suggested that porphyry deposits in Iran developed as a result of partial melting of metamorphosed mafic lower crust with a contribution of metasomatised lithospheric mantle [5] [6] .
Fluid inclusions are among unique indications which can decipher temperature, salinity, fluid chemical composition and the pressure governing the system due to their entrapment during millions of years. Fluid inclusion studies can give us data on mineral forming temperature and mineralizing fluid chemical composition [7] . The fluid composition may be obtained as elements, dissolved ions and molecules, stable isotopes and radiogenic isotopes. The temperature of homogenization is directly correlated to the composition of the fluid. The fluid density of the paleo-fluids may only be measured by measuring fluid inclusions. The development of the rocks and fluids over time can be known a bit better by comparing several generations of fluid inclusions. The interpretation of fluid composition, density and PT-conditions for the different generations may provide information about the deformation history of the system [8] [9] .
The interaction between magmatic and hydrothermal processes is very important for the forming of several ore types. Most of the ore occurrences are formed by hot fluids interacting with or altering the minerals in the crust. The most primitive fluids are derived from magmas that are cooled and crystallized, but meteoric water and sea water can also play an important role [10] . Metals in porphyry copper deposits are considered to be deposited through the dynamic evolution of a magmatic hydrothermal fluid that undergoes depressurization, cooling, chemical reactions with wall rocks (mainly the ore-hosting granite), and mixing with non-magmatic fluids [4] [11] [12] . As a result, porphyry systems are characterized by extensive vein formation associated with mineralization and alteration. Generally, hydrothermal alteration results in potassic, propylitic, sericitic (phyllic) and argillic assemblages, which are documented to occur as concentric alteration halos around the ore progenitor intrusions [1] [4] . Fluid trapped by quartz and other host minerals during alteration and mineralization processes has a wide range of compositions and is the only record of the ore-forming fluid [13] . As such, fluid inclusions provide fundamental information on the physical and chemical nature of ore-forming fluids. This is critical for understanding the nature and transportation-deposition mechanisms of ore-forming fluids in porphyry copper deposits [13] [14] .
Ali Javad porphyry copper-gold deposit is located in the Arasbaran belt at northwestern Iran, at 46˚52'E longitude and 38˚40'N latitude coordinates, some 20 km east of Sungun deposit Mine, 35 km northwest of Ahar city (Figure 1). Numerous exploration activities have been done on the deposit including geological mapping
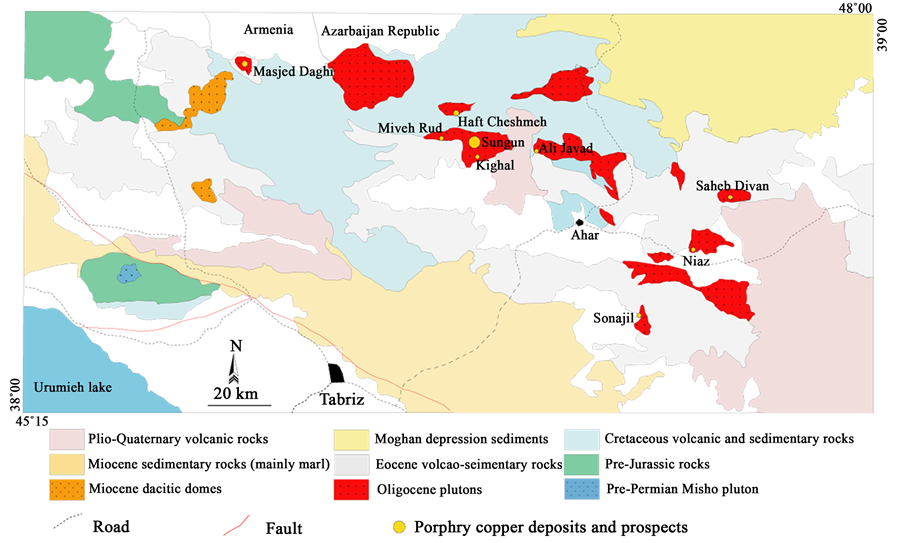
Figure 1. Geological map of Arasbaran belt and location of intrusive bodies as well as porphyry copper deposits (after [5] ).
and drilling with a total run of 11,000 m by Mehr Asl Company [15] . The maximum depth of the run was 670 m deep. Geological and exploration studies on the deposit suggested a porphyry copper-gold mineralization [15] . The present study focuses mainly on the fluid inclusion studies at Ali Javad deposit. Formation condition of the deposit has been deduced from the results obtained from fluid inclusion studies.
2. Regional and Ore Geology
Arasbaran porphyry copper belt in the northwestern Iran bridges eastern and western parts of the Alp-Himalayan metallogenic belt. The belt stretches northwestward to Gharabagh Mountains in Azerbaijan which finally ends in Armenia and Turkey, hosting numerous porphyry copper deposits [5] [16] . The belt extends south and southeastward into Central Iran metallogenic belt. Arasbaran belt is 70 - 80 km wide and 400 km long, including Cretaceous and Cenozoic volcano-sedimentary rocks intruded by Cenozoic intrusions (Figure 1). A wide variety of intrusive bodies of different nature and ages emplaced in the Arasbaran belt during Oligocene-Miocene [17] - [21] . Extensive alteration zones as well as various mineralization such as porphyry, skarn and epithermal deposits have been developed throughout the belt during emplacement of Oligocene-Miocene intrusions [22] - [24] . In Arasbaran belt, Plutonism initiated from middle to late Oligocene by calc-alkaline intrusion, followed by late Oligocene-lower Miocene shoshonitic intrusive bodies [20] [21] . Dacitic, granodioritic and monzonitic domes are the latest plutonic activity within the belt which cut through the earlier bodies. Shohsonitic intrusive bodies as well as younger domes are of adakitic nature while older intrusive bodies are of common calc-alkaline nature [20] . The formation of shoshonitic intrusions in the Arasbaran belt is attributed to partial melting of metasomatised lithospheric mantle in a post-collision tectonic setting [1] - [21] while younger adakitic intrusions are attributed to slab roll-back and melting of the subsiding slab [18] and melting of lower mafic crust [5] .
Porphyry copper mineralization in Arasbaran belt is essentially associated with Oligo-Miocene intrusive bodies. More than ten deposits and prospects for porphyry copper can be observed in the belt among which Sungun, Masjeddaghi, Haftcheshmeh, Sahebdivan, Niyaz, Mivehrude, Kighal and Ali Javad can be numerated (Figure 1) where Sungun is considered as a world class deposit [6] . Based on the dating results made on the belt, porphyry copper deposits formed during two stages: late Oligocene (28 - 27 Ma) and early Miocene (22 - 20 Ma) [5] . The formation of Ali Javad porphyry copper-gold deposit was attributed to younger plutonic activity in the area [15] .
In the deposit, outcrops constitute of Cretaceous sedimentary and volcanic rocks, Eocene volcanic and pyroclastic deposits as well as Oligo-Miocene intrusions which cut across earlier deposits. All these rock units were underlain by Plio-Quaternary volcanic and pyroclastic rocks. Several intrusions have been recognized at the deposit locality. The oldest intrusion at the deposit locality is Sheivar Dagh quartz-diorite to granodiorite body with granular texture which show sometimes porphyroid texture. Sheivar Dagh intrusion show high-K calcal- kaline and adakitic nature which is emplaced in 30.8 ± 2.1 Ma [20] [22] . Ali Javad porphyry stock which is located at the central part of the deposit, is the mineralizing agent for the porphyry deposit associated with consequent alterations. The porphyry body is 300 m × 500 m, but the mineralization is mainly concentrated at the western part of the stock. Ali Javad porphyry body has porphyry texture and monzonitic to quartz monzonitic composition. Phenocrysts are mainly feldspars as well as mafic minerals such as biotite and amphibole. Development of different kind of alterations led to the replacement of primary minerals by secondary minerals [15] .
3. Mineralization and Alteration
Porphyry copper type mineralization at Ali Javad deposit is developed within quartz-monzonitic body and host pyroclastics and volcanic rocks as disseminated, veins and veinlets. Mineralization developed as both hypogene and supergene zones. Hypogene mineralization developed during potassic and phyllic alteration. The process was especially intensified during potassic to phyllic transition. Leached zone above the deposit is of variable thickness, varying from 40 - 250 m, the underlying supergene zone varies in thickness from 80 - 200 m, extends from 60 - 450 m at the deposit. The reserve of the deposit was estimated 81.55 Mt copper ore @ 0.754%. Furthermore, the gold reserve was estimated 37.8 Mt @ 1.8 ppm [15] .
Alteration zonation at Ali Javad deposit demonstrates conformity with Lowel-Guilbert porphyry system [25] which was proposed in 1975. Potassic alteration developed mainly in porphyry quartz monzonite stockwork in the central part of the system. A wide variety of quartz-sericite and siliceous alteration developed at its periphery which developed in porphyry intrusion and host rocks. Propylitic alteration developed at the periphery of the system within the host rock. Supergene argillic alteration was observed associated with siliceous cap at or near the surface [15] .
Veins and veinlets was well developed at the Ali Javad deposit. Most of the veinlets consist of quartz, however, biotite, k-feldspar and sericite veinlets are also observed. Quartz veinlets are mainly concentrated at both potassic and phyllic alteration, but potassic zone hosts more veinlets than phyllic zone. Four types of siliceous veinlets were recognized based on mineralogy and relative temporal relation:
1) The first type occurred mainly in potassic alteration halo, developed at the central and deeper parts of the porphyry system. They constitute of quartz + K-feldspar + biotite + pyrite + chalcopyrite ± molybdenite. Their irregular structure suggests that they were formed at a higher temperature, when they developed at a rather ductile condition, probably after porphyry stock crystallization. The width of the veinlets is generally less than 1 cm.
2) The second type cut across the first type or developed at the core of the first type veins during their re-opening. They consist of quartz + pyrite + chalcopyrite ± anhydrite. Sulfide minerals developed at the center of the veins as thin discontinuous films. Sulfides are sometimes observed as disseminations within the veinlets. They are mainly observed at the potassic alteration zone, but are also observed at the phyllic alteration zone as well. The width of the veins are variable, but is generally less than 3 cm.
3) The third type which cut across the former types, consists of quartz + pyrite ± chalcopyrite. This type is concentrated at the phyllic alteration zone. The veinlets may exceed 5 cm in width.
4) The last type which is composed of quartz, lack sulfide minerals and are observed at all alteration zones.
4. Methods
For this study, a number of samples were collected from drill holes at Ali Javad deposit. A total of 200 thin sections, 250 polished-thin sections and 32 doubly polished-thin sections were prepared for petrography, mineralography and fluid inclusions studies. The thin and polished sections were examined under transmitted and reflected light at the Payame Noor University, Tabriz, Iran. Micro-thermometric studies were carried out on doubly polished-thin sections. Temperatures of phase changes in fluid inclusions were measured using a Fluid Inclusions.
Microthermometric measurements were made using a Linkam THMSG600 with a combined heating and freezing stage with a temperature range of −196˚C to +600˚C, attached to an Olympus petrographical microscope with PVTX software. The reproducibility of the measurements was better than ±0.1˚C for temperatures of less than +200˚C and ±1˚C for temperatures between +200˚C to +600˚C. Stage calibration was carried out at −45.6˚C (Chlorobenzene), and 306˚C/8˚C (Sodium-Nitrate) using standard synthetic fluid inclusions. Ice-melt- ing temperatures were determined at a heating rate of no more than 0.1˚C/s. Homogenisation temperatures were determined at a heating rate of 1˚C/s. Homogenisation of multi-phase solid inclusions was obtained with heating cycles of about 5˚C. For two-phase inclusions, the homogenisation temperature of liquid and vapour (predominant LV → L and rare LV → V) was recorded [26] . In the multi-phase solid inclusions, two points were recorded: (1) Th(NaCl) (the temperature at which halite dissolves) and (2) Th(LV) (the temperature of vapour and liquid homogenisation).
More than 400 core samples from the hypogene alteration zones (potassic, and phyllic) and several vein types from various depths were collected for laboratory analyses. Over 200 samples were investigated for the types of inclusion, their abundance, spatial distribution, and size. Thirty two quartz wafers were polished at both sides using the procedure of [27] . The thickness of the wafers varied between 100 and 150 μm, depending on the transparency of the quartz crystals. Sample selection was biased to quartz containing an abundance of ore-re- lated sulphide minerals in the different type veins.
5. Results
Previous works on fluid inclusions of several porphyry deposits demonstrated complicated changes in fluid temperature and its composition in porphyry deposits both in time and place [28] - [33] . That’s the case for the Ali Javad deposit. Fluid inclusion samples which were studied, collected from type I, II and III veinlets described above. Most of the fluid inclusion sizes are not visible by naked eyes. The size of most fluid inclusions was generally between 1 - 10 µm, 10 - 100 µm sizes are rarely observed. The total volume of fluid inclusions on average were seldom more than 1% of the total host mineral volume. Most of the fluid inclusions were as negative crystal or anhedral in shape, but spherical, bar-like, oviodal, rectangular and irregular inclusions were also observed (Figure 2) [15] .

Figure 2. Fluid inclusion shapes (a) spherical from drill hole No.5; (b) bar-like from drill hole No.23; (c) rectangular from drill hole No.6; (d) quartz negative crystal from drill hole No.5.
Based on the petrographic studies, primary, secondary and pseudosecondary fluid inclusions were developed along microfractures, while their distribution within the crystal is random. Petrographical and morphological characteristics of the fluid inclusions were recorded at room temperature based on [27] and [34] . The discrimination of primary fluid inclusion were based on their single or random distribution within the crystal [34] . Based on the petrographic and microthermometry and the phases present in the room temperature, fluid inclusions at the Ali Javad deposit were studied as following:
Single phase vapor-rich fluid inclusions (V): most of the fluid inclusions at the Ali Javad deposit were of Single phase gaseous type which suggests boiling of mineralizing fluid and its gas-rich nature. These fluid inclusions observed were mainly smaller than 40 µm in size (Figure 3).
Liquid-rich fluid inclusions (L + V): they were small in size and the most frequent fluid inclusions next to vapor-rich types. Their volume fraction (F) was variable from 50% - 90%. The size of these liquid-rich inclusions varied between 4 - 12 µm (8µm in average) (Figure 4).
Vapor-rich fluid inclusions (V + L): their size amounted to 15 µm, their distribution was irregular in quartz crystals. Sometimes they were pseudo-secondary. Their volume fraction was less than 50% which indicates boiling of mineralizing fluids. These fluid inclusions were of less frequency (Figure 5).
Solid-rich fluid inclusions (L + V + S): these fluid inclusions were mainly observed where extensive potassic alteration occurred at the central part of the mineralization. Daughter minerals observed in the deposit were large halite crystals, smaller sylvite minerals, very small prismatic crystals of anhydrite with intermediate birefringence and red to black flaky hematite (Figure 6).
Thermometric analysis were done on primary rather large inclusions, heating method was utilized for determination of homogenization temperature. Salinity determination of mineralizing fluids of inclusion was made using halite crystal solution temperature at the heating stage, PVTX Software Modelling and temperature to salinity conversion. Heating was applied to 130 fluid inclusions, the salinity of 19 fluid inclusions were also calculated.
Fluid inclusion studies at the Ali Javad deposit indicated fluid characteristic range in type, phases involved, volumetric fraction, density, homogenization temperature, halite melting temperature and salinity in the samples studied. According to the results, the minimum salinity was recorded 33 with maximum 61 wt% NaCl equivalent. The homogenization temperature was between 138˚C to 565˚C (Figure 7).

Figure 3. Vapor-rich fluid inclusions from drill hole No.1. (a) 90 m depth; (b) 92 m depth.

Figure 4. Liquid-rich fluid inclusions, from drill hole No.5, 193 m depth.

Figure 5. Gas-rich fluid inclusions, (a) from drill hole No.2, 185 m depth; (b) from drill hole No.5, 193 m depth.

Figure 6. Solid-rich fluid inclusions (a) from drill hole No.8, 310 m depth; (b) from drill hole 20, 185 m depth; (c) from drill hole 25, 523 m depth.

Figure 7. (a) homogenization temperature versus frequency in samples from the study area; (b) salinity diagram versus frequency in samples from the study area.
Homogenization temperature in the studied fluid inclusions fall into two temperature ranges: low to medium temperature (130˚C to 350˚C) and high to very high temperatures (400˚C to more than 565˚C). The maximum homogenization temperature was recorded in saline fluid inclusions containing daughter halite ± opaque minerals which often homogenized at disappearance of vapour phase into liquid phase. In some samples, salt solved into liquid phase. Halite solution in temperature higher than homogenization temperature indicates entrapment in higher pressure [34] . Homogenization temperature of fluids which contained halite ± opaque occurred at final dissoloution of halite, was generally recorded at 450˚C to 500˚C. Multi-phase or halite-bearing fluid inclusions homogenization temperature occurred at vapor phase disappearance, were at medium and higher than 565˚C temperatures. Two-phase fluid inclusions rich in liquid phase and two-phase fluid inclusions rich in vapour phase, were the smallest samples in number (18 inclusions of L + V types and 5 inclusions of V + L type).
Homogenization temperature range of L + V type ones was between 130˚C to 430˚C, just two samples did not homogenize unless up to 500˚C. V + L type ones homogenization temperature was between 370˚C to 565˚C. Most of the homogenization temperature frequencies in three-phase ones, was homogenization to liquid phase, with maximum temperature in the range of 550˚C - 600˚C. Although halite daughter mineral was recognizable in most of the samples, the higher frequency of opaque daughter minerals especially hematite, pyrite (?) and probably chalcopyrite was considerable. Some samples had sylvite phase (triangular in shape) more than halite. Prevalent halite daughter minerals in fluid inclusions studied generally indicates higher Na and Cl content in magmatic-hydrothermal fluids evolved in mineralizing system.
6. Discussion
Fluid inclusions at the Ali Javad deposit were mainly of gas-rich types. However, polyphase fluid inclusions have also been widely observed. The polyphase fluid inclusions neighboring gas-rich types indicated fluid entrapment at boiling temperature, i.e. when vapor was in equilibrium with liquid [34] .
Parts of the copper content in the solution could be deposited as a result of boiling processes as chalcopyrite which was the major mineral at the Ali Javad deposit (similar to porphyry copper deposits). There were strong evidences which indicated boiling at the deposit, abundant gas-rich type fluid inclusions could be numerated. The evidences suggested that boiling had an important role in mineralization so that it looks there should be a tempo-spatial relationship between fluid boiling and deposit formation. New physico-chemical conditions, changes in pH and temperature transitioning lithostatic to hydrostatic conditions associated with boiling led to quartz and sulfide deposition [35] . Abundant stockwork and silica veins in the area associated with magnetite, molybdenite, quartz, pyrite and chalcopyrite as dissemination or vein-type is an evidence of the mineralization. Furthermore, saline fluid inclusions co-existing with vapor-rich fluid inclusions indicate high boiling temperature [26] .
Fluid inclusions results on the samples taken from the study area were plotted on a diagram where homogenization temperature versus salinity of typical porphyry, skarn and epithermal deposits were also plotted (Figure 8). The diagram demonstrates that the final homogenization temperature and salinity of the fluid inclusions fall

Figure 8. Salinity versus final homogenization temperature from samples taken from the Ali Javad deposit within the range of common fluid inclusions of the hydrothermal deposits.
in the range of fluid inclusions which are typical for porphyry deposits. Magmatic-hydrothermal fluid evolution tends toward lower temperature-salinity resulting from mixing with meteoric water at a later stages.
The pattern of fluid inclusions followed the alteration-mineralization zonation pattern of porphyry deposits. Fluid inclusion studies at the area on the samples of altered zones demonstrates a decrease in temperature and salinity of the fluids from potassic alteration to argillic alteration. The maximum homogenization temperature was recorded 554˚C in the potassic zone and the minimum of 131˚C in the argillic zone. The fluid inclusion studies indicate that salt-rich fluid inclusions (containing halite, sylvite and anhydrite) occurred at the central part of the deposit at the potassic zone while fluid inclusions with less diversity of salt types in fluid inclusions occurred in low temperature homogenization at the phyllic and argillic zones or even at the periphery of the mineralized body (Figure 9).
Salinity versus homogenization temperature diagram was utilized for determination of source of the mineralizing fluids [14] . Plotting the data on the diagram (Figure 10) demonstrates that the mineralization at the Ali Javad porphyry copper-gold deposit was related to fluids of magmatic-saline origin. It can be deduced that the majority of the waters involved in potassic alteration were of magmatic source [15] . In other words, solutions of magmatic origin were active at the central core of the mineralization [36] .
Density variation is very important in recognition of fluid flow mechanism and its spatial change in a hydrothermal system [15] . Density variation at the Ali Javad deposit versus temperature and salinity indicates increasing density with decreasing temperature and increasing salinity. Densities up to 1.2 gr/cm3 and close to 1.3 were also observed which suggests mineralizing fluids rich in solid phases (Figure 11).
Copper mineralization at the Ali Javad deposit is associated with gold mineralization, in other words, porphyry mineralization is of copper-gold type, most of the gold content is concentrated at the potassic and phyllic- potassic zone. Furthermore, mineralization and gold content demonstrates a positive correlation with magnetite content. No native gold has been observed during the study. So it looks that gold is likely concentrated in bornite [15] . In most of the deposits which were formed in temperatures between 200˚C to 300˚C, gold bisulfide complexation is far more effective than chloride, while chloride complexation transportation was the major phase in higher temperatures which indicates magmatic systems. Fluid inclusion evidences such as CO2 phase presence confirms gold mineralization as well as analysis made for gold content which showed 1.7 ppm. Daughter crystals of high diversity such as halite, sylvite and anhydrite may indicate presence of hydrothermal solutions rich in chloride complexes which facilitates migration of base metals during which gold was also transported, the presence of which is confirmed at the Ali Javad deposit. Potassic and lower phyllic zone hosts maximum gold content. The results obtained from fluid inclusion salinity and homogenization temperature studies were plotted on homogenization temperature versus salinity diagram of hydrothermal mineralization systems [37] in Figure 12. The diagram had five distinct area which were 1-Archaen orogenic gold 2-epithermal gold-silver 3-volcano- genic massive sulfide 4-Australian tenant creek Cu-Au deposits and 5-porphyry Cu-Au deposits. Part A

Figure 9. Frequency of fluid inclusions versus homogenization temperature with alteration pattern.

Figure 10. Homogenization temperature versus salinity of fluid inclusions of the study area (based on [14] ).

Figure 11. Density variation versus temperature and salinity where the density of NaCl solutions saturated in vapor were plotted (based on [14] ).

Figure 12. Homogenization temperature versus salinity of fluid inclusions within hydrothermal mineralization systems (diagram after [37] ).
demonstrates metal transport as chloride complexation whereas part B indicates metal transport as bisulfide complexation. As it was illustrated in the diagram, all the samples studied were all located at the fifth district which represents porphyry Cu-Au deposits where the dominant transport for metal was as chloride complexation.
7. Conclusion
The Ali Javad porphyry Cu-Au deposit is located in Arasbaran metallogenic belt. Porphyry quartz monzonitic stock of the deposit which intruded into Eocene rocks and Sheivar Dagh granitic and granodioritic body was of Oligocene age. Intrusion of quartz monzonitic stock led to porphyry Cu(-Au) mineralization associated with potassic, phyllic, argillic and propylitic alteration within the body and host rocks. Mineralization was as veins, veinlets and disseminations both as hypogene and supergene. Based on the studies, a wide variety of quartz veinlets both of sulfide-bearing and barren types have been recognized during the study. Based on the fluid inclusion studies, the fluids were single phase gas-rich, single phase liquid-rich, two phase liquid-rich, two phase vapor-rich and polyphase solid-rich ones. Homogenization temperature of fluid inclusions at the Ali Javad porphyry Cu-Au deposit ranged between 138˚C to more than 565˚C and the salinity between 33 - 61 wt% NaCl equivalents. The fluid inclusion distribution pattern followed alteration-mineralization zonation pattern of porphyry type deposit, demonstrated a decrease in fluid temperature and salinity from potassic alteration to argillic alteration. The maximum homogenization temperature of 565˚C recorded in potassic alteration zone while the minimum temperature of 131˚C recorded in argillic alteration zone. Based on the fluid inclusion studies it can be proposed that Ali Javad is a Cu-Au type porphyry deposit.
Acknowledgements
The authors thank from the Mehr Asl Company for allowing sampling from the deposit and boreholes cores.
Cite this paper
Behzad Hajalilou,Mehraj Aghazadeh, (2016) Fluid Inclusion Studies on Quartz Veinlets at the Ali Javad Porphyry Copper (Gold) Deposit, Arasbaran, Northwestern Iran. Journal of Geoscience and Environment Protection,04,80-91. doi: 10.4236/gep.2016.46007
References
- 1. Sillitoe, R.H. (2010) Porphyry Copper Systems. Economic Geology, 105, 3-41.
http://econgeol.geoscienceworld.org/content/105/1/3
http://dx.doi.org/10.2113/gsecongeo.105.1.3 - 2. Gustafson, L.B. and Hunt, J.P. (1975) The Porphyry Copper Deposit at El Salvador, Chile. Economic Geology, 70, 857-912.
http://econgeo.prod-gsw.highwire.org/content/70/5/857
http://dx.doi.org/10.2113/gsecongeo.70.5.857 - 3. Beane, R.E. and Bodnar, R.J. (1995) Hydrothermal Fluids and Hydrothermal Alteration in Porphyry Copper Deposits. In: Pierce, F.W. and Bohm, J.G., Eds., Porphyry Copper Deposits of the American Cordillera, Arizona Geological Society Digest, Vol. 20, Tucson, 83-93.
- 4. Seedorf, E., Dilles, J.H., Proffett, J.M., Einaudi, M.T., Zurcher, L., Stavast, W.J.A., Johnson, D.A. and Barton, M.D. (2005) Porphyry Deposits: Characteristics and Origin of Hypogene Features. Economic Geology 100th Anniversary, 251-298.
- 5. Aghazadeh, M., Hou, Z., Badrzadeh, Z. and Zhou, L. (2015) Temporal-Spatial Distribution and Tectonic Setting of Porphyry Copper Deposits in Iran: Constraints from Zircon U-Pb and Molybdenite Re-Os Geochronology. Ore Geology Reviews, 70, 385-406.
http://www.sciencedirect.com/science/article/pii/S0169136815000694
http://dx.doi.org/10.1016/j.oregeorev.2015.03.003 - 6. Shafiei, B., Haschke, M. and Shahabpour, J. (2009) Recycling of Orogenic Arc Crust Triggers Porphyry Cu Mineralization in Kerman Cenozoic Arc Rocks, Southeastern Iran. Mineralium Deposita, 44, 265-283.
http://link.springer.com/article/10.1007%2Fs00126-008-0216-0
http://dx.doi.org/10.1007/s00126-008-0216-0 - 7. Roedder, E. (1992) Fluid Inclusion Evidence for Immiscibilility in Magmatic Differentiation. Geochimica et Cosmochimica Acta, 56, 5-20.
http://www.sciencedirect.com/science/article/pii/001670379290113W
http://dx.doi.org/10.1016/0016-7037(92)90113-W - 8. Bakker, R.J. (2011) Fluid Inclusions; Critical Review, Applications, Computer Modeling. Short Course. University of Leoben, Leoben.
- 9. Samson, I., Anderson, A. and Marshall, D.D. (2003) Fluid Inclusions: Analysis and Interpretation. Mineralogical Association of Canada.
- 10. Robb, L. (2005) Introduction to Ore-Forming Processes. Blackwell Publishing, Hoboken.
- 11. Richards, J.P. (2011) Magmatic to Hydrothermal Metal Fluxes in Convergent and Collided Margins. Ore Geology Reviews, 40, 1-26.
http://www.sciencedirect.com/science/article/pii/S0169136811000540
http://dx.doi.org/10.1016/j.oregeorev.2011.05.006 - 12. Cooke D.R., Hollings, P. and Walsh, J.L. (2005) Giant Porphyry Deposits: Characteristics, Distribution, and Tectonic Controls. Economic geology, 100, 801-818.
http://econgeol.geoscienceworld.org/content/100/5/801
http://dx.doi.org/10.2113/gsecongeo.100.5.801 - 13. Bodnar, R.J., Lecumberri-Sanchez, P., Moncada, D. and Steele-MacInnis, M. (2014) Fluid Inclusions in Hydrothermal Ore Deposits. In: Turekian, H.D.H.K., Ed., Treatise on Geochemistry, 2nd Edition, Elsevier, Oxford, 119-142.
http://dx.doi.org/10.1016/b978-0-08-095975-7.01105-0 - 14. Wilkinson, J.J. (2001) Fluid Inclusions in Hydrothermal Ore Deposits. Lithos, 55, 229-272.
http://www.sciencedirect.com/science/article/pii/S0024493700000475
http://dx.doi.org/10.1016/S0024-4937(00)00047-5 - 15. Hajalilou, B. (2012) Final Report of Exploration in Ali Javad Area. Ministry of Industry, Mine and Trading, Mehr Asl Company. (In Persian)
- 16. Moritz, R., Rezeau, H., Ovtcharova, H., Tayan, R., Melkonyan, R., Hovakimyan, S., Ramazanov, V., Selby, D., Ulianov, A., Chiaradia, M. and Putlitz, B. (2015) Long-Lived, Stationary Magmatism and Pulsed Porphyry Systems during Tethyan Subduction to Post-Collision Evolution in the Southernmost Lesser Caucasus, Armenia and Nakhitchevan. Gondwana Research, in press.
http://www.sciencedirect.com/science/article/pii/S1342937X15002555
http://dx.doi.org/10.1016/j.gr.2015.10.009 - 17. Babakhani, A.R., Lesquyer, J.L. and Rico, R. (1990) Geological Map of Ahar Quadrangle (Scale 1:250,000). Geological Survey of Iran, Tehran, Iran.
- 18. Jahangiri, A. (2007) Post-Collisional Miocene Adakitic Volcanism in NW Iran: Geochemical and Geodynamic Implications. Journal of Asian Earth Sciences, 30, 433-447.
http://www.sciencedirect.com/science/article/pii/S1367912007000120
http://dx.doi.org/10.1016/j.jseaes.2006.11.008 - 19. Aghazadeh, M., Castro, A., Omran, N.R., Emami, M.H., Moinvaziri, H. and Badrzadeh, Z. (2010) The Gabbro (Shoshonitic)-Monzonite-Granodiorite Association of Khankandi Pluton, Alborz Mountains, NW Iran. Journal of Asian Earth Sciences, 38, 199-219.
http://www.sciencedirect.com/science/article/pii/S1367912010000179
http://dx.doi.org/10.1016/j.jseaes.2010.01.002 - 20. Aghazadeh, M., Castro, A., Badrzadeh, Z. and Vogt, K. (2011) Post-Collisional Polycyclic Plutonism from the Zagros Hinterland: The Sheivar Dagh Plutonic Complex, Alborz Belt, Iran. Geological Magazine, 148, 980-1008.
http://journals.cambridge.org/action/displayAbstract?fromPage=online&aid=8348253&fileId=S0016756811000380
http://dx.doi.org/10.1017/s0016756811000380 - 21. Castro, A., Aghazadeh, M., Badrzadeh, Z. and Chichorro, M. (2013) Late Eocene-Oligocene Post-Collisional Monzonitic Intrusions from the Alborz Magmatic Belt, NW Iran. An Example of Monzonite Magma Generation from a Metasomatized Mantle Source. Lithos, 180-181, 109-127.
http://www.sciencedirect.com/science/article/pii/S0024493713002417
http://dx.doi.org/10.1016/j.lithos.2013.08.003 - 22. Aghazadeh, M. (2009) Petrology and Geochemistry of Anzan, Khankandi and Sheivar Dagh granitoids (North and East of Ahar, Eastern Azerbaijan) with References to Associated Mineralization. Unpublished Ph.D. Thesis, Tarbiat Modares University, Tehran, Iran. (In Persian)
- 23. Mehrpartou, M. (1993) Contributions to the Geology, Geochemistry, Ore Genesis and Fluid Inclusion Investigations on Sungun Cu-Mo Porphyry Deposit (North-West of Iran). Ph.D. Thesis, Hamburg University, Hamburg, Germany.
- 24. Jamali, H., Dilek, Y., Daliran, F., Yaghubpur, A. and Mehrabi, B. (2009) Metallogeny and Tectonic Evolution of the Cenozoic Ahar-Arasbaran Volcanic Belt, Northern Iran. International Geology Reviews, 52, 608-630.
http://www.tandfonline.com/doi/abs/10.1080/00206810903416323?journalCode=tigr20
http://dx.doi.org/10.1080/00206810903416323 - 25. Guilbert, J.M. and Park, C. F. (1986) The Geology of Ore Deposits. W. H. Freeman and Company, New York.
- 26. Hajalilou, B. (2011) Fluid Inclusion Geothermometery. Payame Noor University Press, Tehran. (In Persian)
- 27. Shepherd, T.J., Rankin, A.H. and Alderton, D.H.M. (1985) A Practical Guide to Fluid Inclusion Studies. Blackie Press, London.
- 28. Eastoe, C.J. (1978) A Fluid Inclusion Study of the Panguna Porphyry Copper Deposit, Bougainville, Papua New Guinea. Economic Geology, 73, 721-748.
http://econgeol.geoscienceworld.org/content/73/5/721?related-urls=yes&legid=econgeo;73/5/721
http://dx.doi.org/10.2113/gsecongeo.73.5.721 - 29. Preece, R.K. and Bean, R.E. (1982) Contrasting Evolutions of Hydrothermal Alteration in Quartz Monzonite and Quartz Diorite Wall Rocks at the Sierrita Porphyry Copper Deposit, Arizona. Economic Geology, 77, 1621-1641.
http://econgeol.geoscienceworld.org/content/77/7/1621
http://dx.doi.org/10.2113/gsecongeo.77.7.1621 - 30. Reynolds, T.J. and Bean, R.E. (1985) Evolution of Hydrothermal Fluid Characteristics at the Santa Rita, New Mexico, Porphyry Copper Deposit. Economic Geology, 80, 1328-1347.
http://econgeol.geoscienceworld.org/content/80/5/1328
http://dx.doi.org/10.2113/gsecongeo.80.5.1328 - 31. Rusk, B.G., Reed, M.H. and Dilles, J.H. (2008) Fluid Inclusion Evidence for Magmatic-Hydrothermal Fluid Evolution in the Porphyry Copper Molybdenum Deposit at Butte, Montana. Economic Geology, 103, 307-334.
http://econgeol.geoscienceworld.org/content/103/2/307
http://dx.doi.org/10.2113/gsecongeo.103.2.307 - 32. Weis, P., Driesner, T. and Heinrich, C.A. (2012) Porphyry-Copper Ore Shells form at Stable Pressure-Temperature Fronts within Dynamic Fluid Plumes. Science, 338, 1613-1616.
http://science.sciencemag.org/content/338/6114/1613
http://dx.doi.org/10.1126/science.1225009 - 33. Li, Y., Selby, D., Feely, M., Costanzo, A. and Li, X.H. (2016) Fluid Inclusion Characteristics and Molybdenite Re-Os Geochronology of the Qulong Porphyry Copper-Molybdenum Deposit, Tibet. Mineralium Deposita, 51, 1-22.
http://link.springer.com/article/10.1007%2Fs00126-016-0654-z
http://dx.doi.org/10.1007/s00126-016-0654-z - 34. Roedder, E. (1984) Fluid Inclusions. In: Ribhe, P.H., Ed., Reviews in Mineralogy, Vol. 12, Mineralogical Society of America, Washington DC.
- 35. Bodnar, R.J. (1994) Synthetic Fluid Inclusions: XII. The System H2O-NaCl. Experimental Determination of the Halite Liquidus and Isochores for a 40 wt% NaCl Solution. Geochimica et Cosmochimica Acta, 58, 1053-1063.
http://www.sciencedirect.com/science/article/pii/0016703794905711
http://dx.doi.org/10.1016/0016-7037(94)90571-1 - 36. Takenouchi, S. (1980) Preliminary Studies on Fluid Inclusions of the Santo Tomas II (Philex) and Tapian (Marcroper) Porphyry Copper Deposits in the Philippines. Mining Geology Special Issue, No. 8, 141-150.
- 37. Large, R.R., Bull, S. W., Cooke, D.R. and McGoldrick, P.J. (1998) A Genetic Model for the HYC Deposit, Australia, Based on Regional Sedimentology, Geochemistry and Sulfide-Sediment Relationship. Economic Geology, 93, 1345-1368.
http://econgeol.geoscienceworld.org/content/93/8/1345
http://dx.doi.org/10.2113/gsecongeo.93.8.1345
NOTES

*Corresponding author.