American Journal of Industrial and Business Management
Vol. 3 No. 3 (2013) , Article ID: 33953 , 8 pages DOI:10.4236/ajibm.2013.33037
GEA.vite, an Example of Assesment Protocol to Evaluate the Efficiency and Sustainability of Viticultural Italian Companies
![]()
1Department of Agricultural and Environmental Sciences, University of Milan, Milan, Italy; 2Sata Viticulture Consulting, Rovato (BS), Italy; 3Arnaldo Caprai Società Agricola, Montefalco (PG), Italy.
Email: leonardo.valenti@unimi.it
Copyright © 2013 Leonardo Valenti et al. This is an open access article distributed under the Creative Commons Attribution License, which permits unrestricted use, distribution, and reproduction in any medium, provided the original work is properly cited.
Received March 27th, 2013; revised April 27th, 2013; accepted May 27th, 2013
Keywords: GEA.vite; Monitoring; Questionnaire; Sustainability; Improvement
ABSTRACT
GEA.vite was born in 2008 with the aim of creating a self-assessment system that would enable wine companies to monitor and quantify their level of efficiency and sustainability. This monitoring allows companies to make aware decisions about critical points along the production chain; this leads to the ability to find and adopt measures to improve company management. The first step involved research and evaluation of the most important existing protocols at the international level; the various evaluation items derived from these protocols were then improved, integrated and adapted to the different territorial situation. The second step consisted of data collection from each wine company; the first year, this activity was carried out by staff specifically dedicated to this project, with the idea of training companies to properly fill out the GEA.vite questionnaire. From the final questionnaire, consisting of 11 chapters and about 250 questions, a website (www.geavite.it) was created to make the compilation easier; on the website wineries that adopt GEA.vite can also visualize graphics and tabs to view their critical points and areas of improvement, in addition to comparing different years of monitoring. To complete the assessment, coefficients were also set for each question according to its significance in terms of efficiency and quality of operations (EQ: Efficiency & Quality) and sustainability (BIOPASS: biodiversity, landscape, environment, sustainability and social equity). A companion document was implemented to give useful insights and directions to aid companies’ management in terms of sustainability and technical operations. As of today, GEA.vite represents one of the most complete and user-friendly protocols for Italian wine sector assessment; it has been applied for one or two years at 20 wine companies; one year of monitoring allows them to define areas where it is possible to act and intervene, while the comparison between two years of monitoring shows whether the implementation of different measures leads to a general improvement in management, particularly in terms of sustainability.
1. Introduction
In recent years, interest among institutions and consumers in aspects related to the “sustainability” of production systems is increasing. This fact also affects the decisionmaking processes of purchasing; these processes relate, in fact, more and more to a focus that is not purely aesthetic or hedonistic but, rather, ethical, social, and environmental [1,2].
It is well known, however, that the definition of the “sustainability” of a process or a product must be considered taking into account all the different aspects that comprise it. These aspects take into account the environment, society, and the economy [3]. It is, thereforedifficult to unambiguously and objectively define the actual level of sustainability in the absence of evaluation methodologies based on reliable criteria of quantification.
In this context, all self-assessment protocols prepared for different industries worldwide are included. These protocols have the common objective of defining and including indications on the basis of studies and observations. These indications allow the achievement of a certain goal if properly implemented.
There are various protocols useful for the wine sector, at both the national and international level, each one written and adapted to the specific situation [4-7].
Adherence to and application of different protocols allows the company to increase its “management efficiency”. This improvement should not be understood in purely economic terms as “the ability to act and produce with maximum efficiency with minimum waste, expense, resources and time used” but must take into account the optimization of all aspects related to the concept of “sustainability” mentioned above. The new pattern of development of the “green economy” proposes in fact an economic model that shifts attention from the generation of goods to the production of new values [8].
Aspects related to the “integrated pest management” of the vine are surely particularly relevant for the viticultural sector; their application is also mandatory under the new EC Directive 128/2009 on the sustainable use of plant protection products. The evaluation must, however, include consideration of other aspects of the supply chain to be complete.
2. Materials and Methods
GEA.vite is an assessment protocol to evaluate the efficiency of viticultural Italian companies. This protocol consists of a self-assessment questionnaire and a real “protocol” that contains in-depth details for each of the areas considered in the questionnaire.
Eleven chapters, for a total of more than 250 questions, have been set to take into account all aspects of the wine sector (Table 1).
This structure is the result of an extensive research bibliography that has taken into account all the main existing international protocols [4-6,9-15].
The most relevant information derived from these sources were first assembled and organized in separate chapters; in the second phase, they were integrated with factors not yet considered and, finally, thanks to the support of companies, adapted to the specific context taken into account.
This process allows the development of an integrated framework of assessment at the level of the supply chain and more comprehensive than sources of origin.
Some insights were developed to deepen the main factors in the context of good corporate governance and, in particular, the following:
• In Chapter 8 (“Environment, Landscape and Biodiversity”), a specific assessment was introduced regarding both the context of greenhouse gas emissions through the Ita.Ca® software [16] and the “water footprint”.
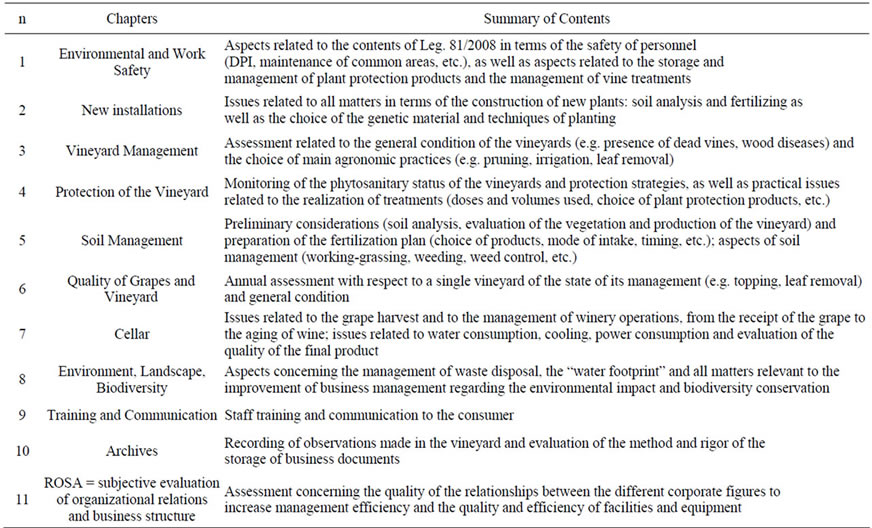
Table 1. Subdivision of chapters and related contents.
• In relation to soil management (Chapter 5), an alternative possibility of visual assessment of the quality of the soil was introduced through the use of the visual soil assessment (VSA) method [15].
• With regard to pest management (Chapter 4, “Protection of the Vineyard”), the concept of “indices of risk” (e.g. EPRIP-Environmental potential risk indicator for pesticides) was instead introduced in relation to the EU Directive 128/2009 regarding the sustainable use of plant protection products.
The single score for each question is then multiplied by two coefficients that quantify the relevance based on the impact on biodiversity, landscape, environment, sustainability, and social equity (BIOPASS coefficient) and the impact on the efficiency of management and quality of the product (EQ coefficient).
The aggregation of scores by chapter or scope is then defined by the average of the values recorded. These values are then expressed as a percentage (100% = maximum score for all questions) (Figure 1).
To facilitate an immediate and complete filling of the questionnaire by companies and allow them to visualize a graphical display of the scores achieved, the software www.geavite.it is currently active; access is allowed after entering a password.
The monitoring actually started, for some companies, in 2010, while in other cases, data collection began with the 2011 vintage.
The investigation focused on two famous Italian wine areas: the Valtènesi (located on Garda Lake) and Montefalco (in the province of Perugia) (Figure 2).
The protocol was applied by six companies for each of the two territories. For some companies, data collection has been performed for two years (2011 and 2012); the biannual study allowed a first assessment of the improvement achieved.
3. Results and Discussion
3.1. First Year of Assessment
The analysis of data obtained from the first year of monitoring in different areas showed how the different companies, although located within the same winegrowing area, sometimes appear very diverse both in terms of the aspects of EQ (Efficiency& Quality) and for those related to BIOPASS (biodiversity, landscape, environment, sustainability, and social equity). An example of this situation is the difference recorded in the scores obtained in the evaluations of the “Vineyard Management”, “Quality of the Grapes and the Vineyard” and “Archives” chapters; these chapters, in both monitored areas, presented for the EQ parameter variations in percentages greater than 80% between one company and another (see the example of the “Archives” chapter for Montefalco) (Figure 3).
This variability highlights the difficulty of homogeneity of behavior within the same production area; the aspects treated in these chapters are, in fact, often not subjected to specific rules and regulations, and for them, there is therefore a certain independence in the choice of behavior between different companies. An example of such a situation, regarding the “Archives” chapter, is related to the question “Recording of observations realized in the vineyard“, for which is assigned score is “0” if the observations are neither recorded neither stored, while the score of “4” is given to companies that register written views and store them in a computer version to facilitate the search for information in the following years.
As for issues such as “Protection of the Vineyard” and the management of the “Cellar” behavior, always considering the EQ parameter, they are rather more homogeneous between companies in both the wine areas (Figure 4). From the graphs, it can be observed that the maximum percentage difference observable for these two items is equal to approximately 15%.
Considering instead the feedback obtained through evaluation of BIOPASS, the differences in score between the various companies are quite evident for all parameters evaluated in both areas.
Particularly evident is the diversity of the scores given
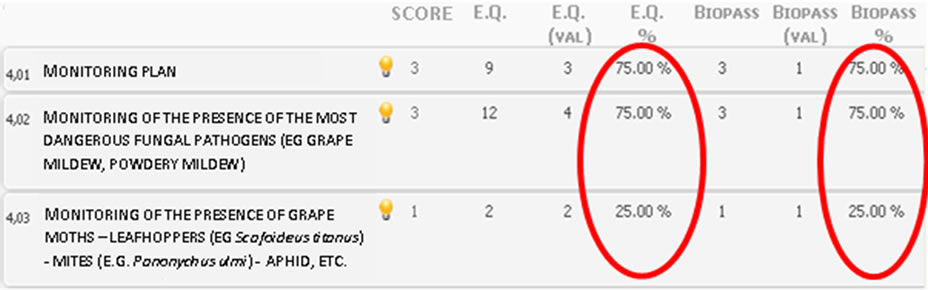
Figure 1. Image taken from the website www.geavite.it that exemplifies the method for calculating the scores in terms of management efficiency and product quality (EQ) and those relating to biodiversity, landscape, environment, sustainability and social equity (BIOPASS).
in Valtènesi for the “Quality of the Grapes and the Vineyard” and “Cellar” chapters, where the differences between companies reach as high as 50% (Figure 5).
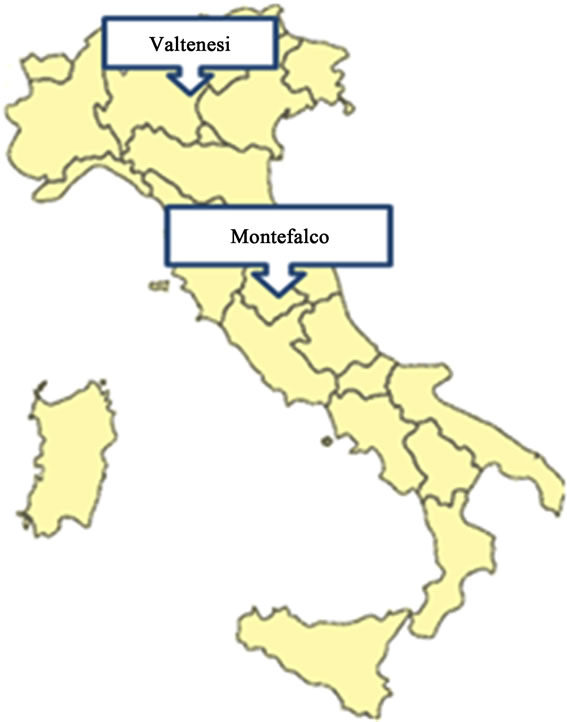
Figure 2. Location of the two monitored areas.
For this wine area, it can also highlight how companies G1, G6, and G3 have recorded, especially in the first year of evaluation, higher scores with regard to the assessment of the environment and sustainability in the management of the cellar rather than in the operations of the vineyard; companies such as G4, G5, and, in particular, G2 have instead the opposite situation. This fact shows that, in most cases, companies can be virtuous in one way (e.g., vineyard) while presenting very wide margins for improvement in other areas (e.g., cellar).
In the area of Montefalco, the scores obtained by the BIOPASS coefficients differ between companies by 44% and 59%, respectively, for the “Managing the Vineyard” and “Training and Communication” chapters (Figure 5). In this case, there are companies (M1 and M5) that recorded good percentage of assessment for the management of the vineyard and have room for improvement in staff training; in particular, the training can be improved regarding aspects of sustainability (e.g., the “Sustainability and Communication” question that provides a score of “0” if “any information plan about business initiatives in relation to aspects of sustainability is provided”, while the maximum score of “4” is assigned if “an information plan about business initiatives in relation to aspects of sustainability is provided”).
3.2. Evaluation of Two Consecutive Years
The application of the questionnaire in consecutive years
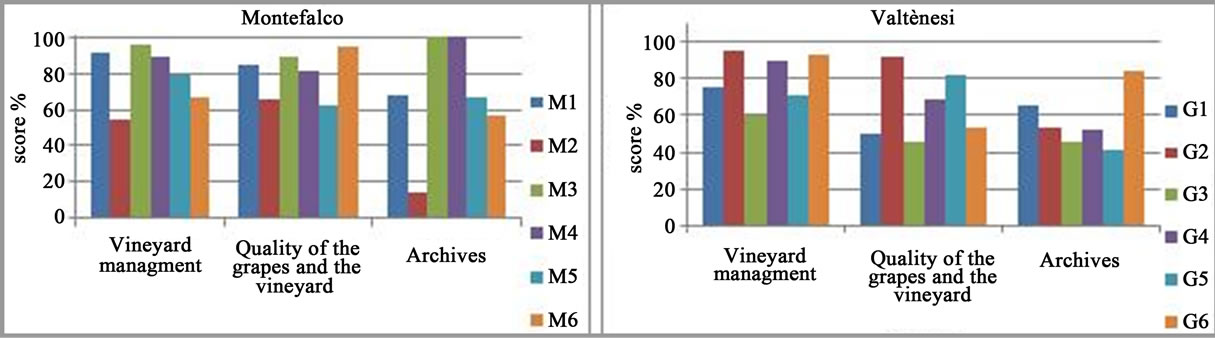
Figure 3. Scores obtained in the two monitored areas for the first year of monitoring (2010 or 2011) for the EQ parameter.
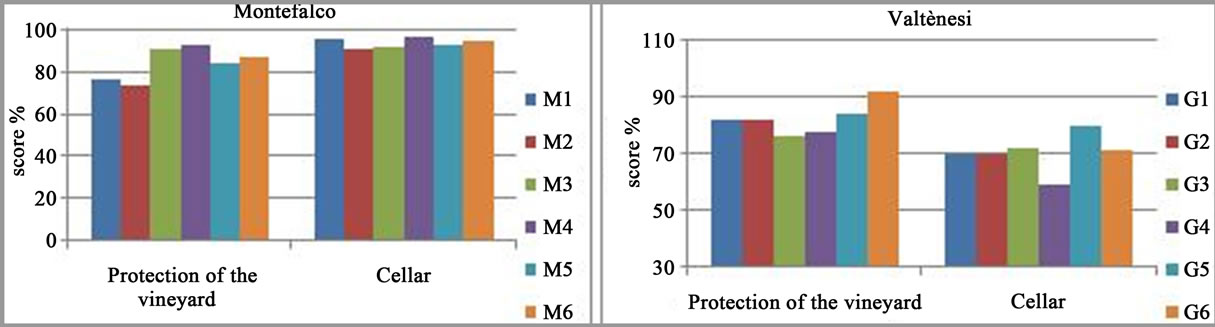
Figure 4. Scores obtained in the two monitored areas for the first year of monitoring (2010 or 2011) for the EQ parameter.
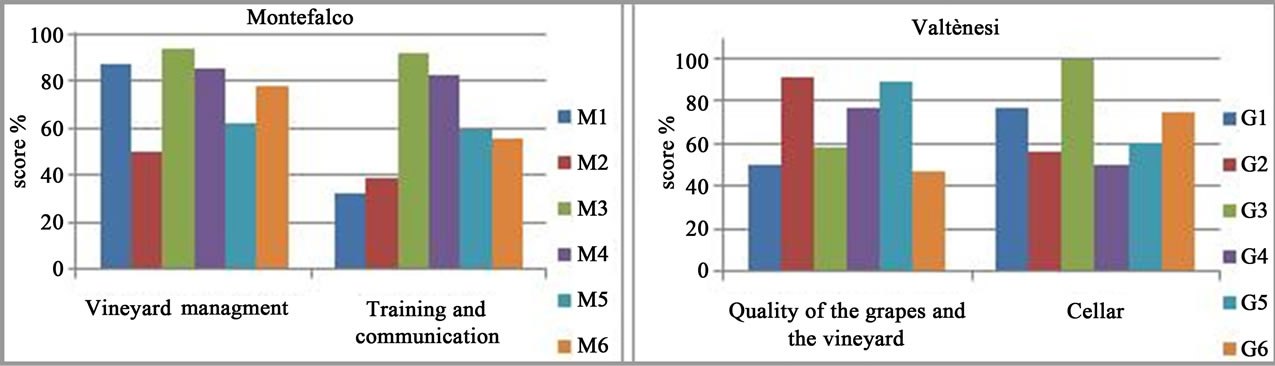
Figure 5. Scores obtained in the two monitored areas for the first year of monitoring (2010 or 2011) for the BIOPASS parameter.
allows an objective assessment of the actual improvement achieved through the implementation of ameliorative measures or, conversely, to identify the situations where it is necessary to implement additional measures.
As an example, a scoreboard was proposed in two consecutive years (2011-2012) for two companies located in Montefalco.
The first company (M1) showed, for the second year of monitoring an improvement for the EQ parameter in the evaluation of the “Environmental and Work Safety”, “Environment, Landscape and Biodiversity”, and “Training and Information” chapters (Figure 6). It therefore seems that efforts to make improvements have been mainly dedicated to factors aimed at improving the efficiency of the protection and, consequently, the information of the staff, as well as factors associated with corporate sustainability. This improvement, in particular regarding the first of the three chapters, is generated by the question on the “management of plant protection products no longer usable or expired”, while in the first year, the company had received score of “0” because “products no longer usable or expired or were stored along with all the others and were not marked clearly”; in the second year, the improvements implemented by the company made it possible to increase this score.
For the “Environment Landscape and Biodiversity” chapter, the improvement is mainly given by the “maintenance of structures of the vineyard” through the follow-up and review of the good state of piling systems and scaffolding of the vineyards, improving the efficiency of realization of the operations of the vineyard and, indirectly, also the quality of the product.
Finally, with regard to what concerns “Training and Communication”, the company is committed to creating operator training on the “recognition of the major diseases and insect pests”, which permitted improvement in the timeliness of action in the most critical phases.
Regarding the BIOPASS coefficient, the improvement for this company is evident in the “Cellar”, “Training and Communication”, and “Archives” chapters (Figure 7).
In the first case, the improvement is the result of the application of various improvement actions including, for example, the improvement of techniques for sanitization of the tanks and barrels through the use of products with less impact and the reduction of the waste of water for operating the cellar.
For the “Training and Communication” chapter, the improvement is due to the same aspect discussed above for the EQ coefficient: the implementation of actions for the “education of operator recognition of the major diseases and insect pests”. In fact, this point has implications in environmental areas, such as the possibility of reducing interventions in the vineyard thanks to more timely intervention if necessary.
In “Archives”, the improved score in the second year is a result of better management of the HACCP system with positive sanitary effects in terms of. In this context it is important to point up that GEA.vite provides a level of greater detail than the obligations defined by law.
The second company analyzed (M2) shows, for the aspects of EQ, an evident increase in the score in the “Soil Management”, “Quality of Grapes and Vineyard”, “Training and Communication”, and “Archives” Chapters. Positive but to a lesser extent are the scores for the “New Installation” and “Vineyard Management” chapters (Figure 8).
This second company, however, recorded scores for aspects relating to BIOPASS improvements with respect to seven scopes: “environmental and work safety”, “vineyard management”, “protection of the vineyard”, “soil management”, “environment, landscape and biodiversity”, “training and communication”, and “archives” (Figure 9).
However, for both companies, observation of the graphs comparing consecutive years shows some areas for which the value indicates a stationary outcome, if not a lower one. It is necessary to remember that the process of adjustment to the protocol may not be immediate for
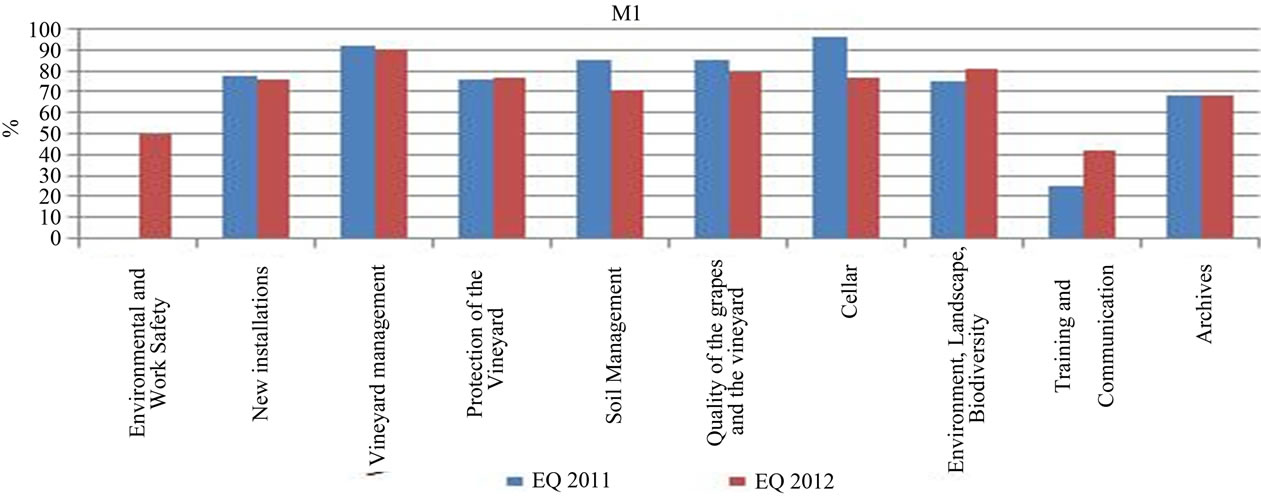
Figure 6. Comparative evaluation of two years (2011-2012) for the M1 company monitored in Montefalco-EQ coefficient (Efficiency & Quality).

Figure 7. Comparative evaluation of two years (2011-2012) for the company M1 monitored in Montefalco-BIOPASS coefficient (biodiversity, landscape, environment, sustainability, social equity).
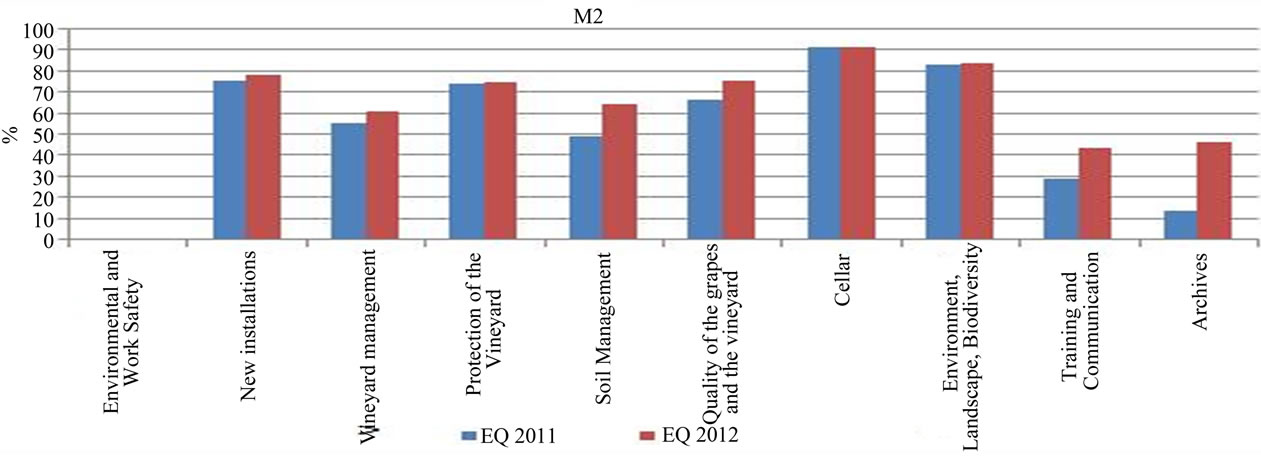
Figure 8. Comparative evaluation of two years (2011-2012) for the company M2 monitored in Montefalco-EQ coefficient (efficiency of management and quality of the product).
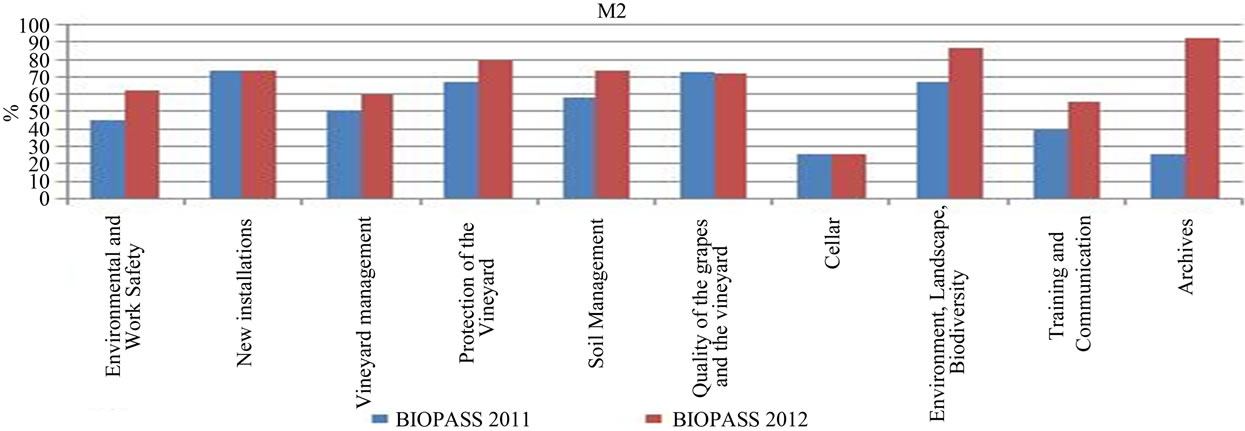
Figure 9. Comparative evaluation of two years (2011-2012) for the company M2 monitored in Montefalco-BIOPASS coefficient (biodiversity, landscape, environment, sustainability, social equity).
all aspects and that it is good to work each year on different scopes to achieve the optimal level of management.
4. Conclusions
The annual or biennial experience of application of the GEA.vite protocol in two national wine areas shows the actual usefulness of the application of this protocol thanks to its traceable and objective method of evaluation. Different situations are recorded within the same territories, particularly in areas subjected to relatively little regulation, where companies present diverse management frameworks.
The comparison between consecutive years has highlighted the usefulness in terms of improvement for companies that, on the basis of information obtained from the first year of the application of the questionnaire, implemented improvement measures. This increase in scores is not, as expected, homogeneous for all areas assessed, but the process is gradual and requires more time to be completed.
5. Acknowledgements
We thank all the Companies that have collaborated in the first phase of the project and in particular the leading companies of the projects: Az. Agrcola San Giovanni e Arnaldo Caprai Soc. Agricola. We also thank Dr. Michele Bravo and Dr. Daniele Bono for their support during the data collection.
REFERENCES
- P. Hayes and T. Battaglene, “Regulatory Response to Climate Change. Le Bulletin de L’OIV,” Organisation Internationale de La Vigne et du Vigne, Vol. 79, No. 909- 910, 2006, pp. 697-708.
- EURISKO, “Indagine ‘Per una Filiera Sostenibile, Il Punto di Vista di Imprese e Consumatori,’ I Risultati di Un’indagine Condotta da GfK Eurisko per il Laboratorio PMI Filiera Sostenibile Promosso da Fondazione Sodalitas,” 2011. http://www.living24.it/whitepaper_library/ricerca_filiera.pdf
- Commissione Mondiale Sull’ambiente e lo Sviluppo (WCED), “Our Common Future: Report of the World Commission on Environment and Development,” 1987. http://conspect.nl/pdf/Our_Common_Future-Brundtland_Report_1987.pdf
- Lodi Wingrape Commission (LWC), “Lodi Rules for Sustainable Winegrowing Standards,” 2013. http://www.lodiwine.com
- Association Viticole Champenoise (AVC), “Viticulture Raisonnée et Environment,” Le Vigneron Champenois. Guide Pratique, 2003.
- R. Bassi, A. Bernard, F. Berta, M. Calliera, E. Capri, T. Galassi, F. Mazzini, R. Rossi and P. Meriggi, “Linee Guida per un Uso Sostenibile dei Prodotti Fitosanitari,” 2011. http:// www.agricoltura-responsabile.it
- AA.VV., “Magis,” 2013. http://www.magisvino.com
- P. Ricotti, “Sostenibilità e Green Economy: Quarto Settore,” Franco Angeli, 2010.
- Groupe de Travail, “Viticulture Raisonnée des Charentes, Référentiel Viticulture Raisonnée des Charentes,” Chambre d’Agriculture de la Charentes, 2003.
- Central Coast Vineyard Team, “Positive Points System. Self-Assessment Tool for Evaluating Sustainable Management Practices Used in Vineyards,” 2006. http://www.vineyardteam.org
- Institut Technique de la Vigne et du Vin (ITV), “Référentiel National pour la Production Intégrée de Raisins. Viticulture Durable les Outils Supports à une Mise en Pratique,” 2002.
- AA.VV., “LEAF (Linking Environment and Farming) Global Standard,” 2012. http://www.leafmarque.com
- Wine Institute, “Comprehensive Guide to Sustainable Management of Winery Water and Associated Energy,” 2008. http://www.wineinstitute.org/files/AVF-Guide.pdf
- P. Balsari, P. Marucco and G. Oggero, “Progetto TOPPS: Train Operators to Prevent Pollution from Point Sources. Le buone Pratiche Agricole per una Migliore Protezione Delle Acque Dalla Contaminazione da Agro Farmaci,” DEIAFA Università di Torino, 2007.
- FAO (Food and Agriculture Organization of the United Nations), “Visual Soil Assessment (VSA) Field Guide,” 2008.
- M. Tonni, P. Donna and L. Valenti, “Ita.Ca®, il Calcolatore Italiano di Emissioni di Gas Serra,” Supplemento a L’Informatore Agrario, No. 13, 2010, pp. 21-26.