Natural Resources
Vol.4 No.1A(2013), Article ID:29443,8 pages DOI:10.4236/nr.2013.41A019
Site Ranking and Potential Assessment for Concentrating Solar Power in West Africa
![]()
1Solar Energy and Energy Savings Laboratory, International Institute for Water and Environmental Engineering, Ouagadougou, Burkina Faso; 2Department of Mechanical Engineering, Kwame Nkrumah University of Science and Technology, Kumasi, Ghana.
Email: *emmanuel.ramde@2ie-edu.org, eramde@gmail.com
Received January 16th, 2013; revised February 15th, 2013; accepted February 24th, 2013
Keywords: Concentrating Solar Power; Potential; West Africa
ABSTRACT
Access to electricity is poor in the Economic Community of West African States (ECOWAS). Concentrating Solar Power (CSP) presents better opportunities for increasing access to electricity and for diversifying sources of energy in the ECOWAS region; however, to date, except for Burkina Faso, no site evaluation pertaining to the region has ever been performed for CSP. This study provides potential assessment and site ranking for large-scale CSP projects in the ECOWAS region. It computes the nominal potential power and gives the corresponding energy yield with many scenarios. By considering only 1% of the suitable land area with daily DNI greater or equal to 5 kWh/m2, a land slope less or equal to 5% and distance to transmission line not more than 100 km, the study showed, for example, that West Africa has a potential nominal capacity of 21.3 GW for parabolic trough technology.
1. Introduction
The Economic Community of West African States (ECOWAS) is a regional group of fifteen countries. Its mission is to promote economic integration in all fields of economic activity, particularly industry, transport, telecommunications, energy, agriculture, natural resources, commerce, monetary and financial questions, social and cultural matters.
The region has some of the lowest modern energy consumption rates in the world with average electricity consumption of 120 kWh/capita compared to the continental and global averages of 529 and 2570 kWh/capita respectively [1]. Household access to electricity across the region is about 20% but wide differences exist between the access rates in urban areas that average 43% while rates in rural areas range between 6% and 8% [2].
Although the share of oil products in ECOWAS’ energy balance remains modest, commercial energy consumption (electricity, oil products and gas) is highly oildependent. Power generation depends on 65% of fossil fuel [3]. Biomass represents one of the main energy resources of the member States.
For the purpose of our study, the region has been divided into three main climatic zones: the humid tropical southern coastal zone, the Sahel and the Sahara desert. The Sahel and the Sahara desert are characterized by low population density, scarce water resources and lack of transmission lines. They however receive abundant solar energy all year round; their mean daily solar radiation exceeds 5.5 kWh/m2 [4]. Direct Normal Irradiation (DNI) which is the “fuel” for Concentrating Solar Power (CSP), is relatively high in the Sahara and the Sahel zone. Hence CSP presents better opportunities for increasing access to electricity and for diversifying sources of energy in the ECOWAS region. However, to date, no CSP plant has been installed in the region and none is under construction. Moreover, except for Burkina Faso, no site evaluation pertaining to the ECOWAS region has ever been performed for CSP. This study aims at filling that gap by evaluating and ranking suitable sites for large-scale CSP projects. It further computes the nominal potential power and gives the corresponding energy yield with many scenarios.
2. Literature Review on Site Selection for CSP
Selecting an appropriate site for concentrating power plant has been the subject of many studies. Azoumah et al. [4] provided technical guidelines for selecting a suitable site for CSP projects in the Sahel. The guidelines were applied in selecting a candidate site in Burkina Faso. Broesamle et al. [5] made use of satellite data and Geographic Information System (GIS) to rank potential sites for CSP in North Africa. Bravo et al. [6] in considering parabolic trough plants with 6 hours thermal storage, used GIS and found a generation ceiling of 9897 TWh/y for Spain. After taking just 1% of the whole wasteland in China as potential site for solar thermal power plant and assuming a land area requirement of 20.2 km2/GW of installed capacity for power tower technology, Hang et al. [7] showed that 1300 GW of electricity generation capacity could be installed. Fluri [8] also used GIS to identify potential areas for the implementation of large scale CSP plant in South Africa; assuming parabolic trough technology with an average capacity factor of 38.8%, he found that the identified areas could yield a total nominal capacity of 547.6 GW corresponding to a net annual energy generation of 1861 TWh. Charabi and Gastli [9] used GIS tools to first evaluate the solar resource and to select a candidate site for large CSP plants for Duqum in the Sultanate of Oman; they also calculated the electricity generation potential for different CSP technologies and for concentrated PV (CPV). The same methodology was used by Clifton and Boruff [10] in order to classify potential CSP sites in the Wheatbelt region of Western Australia. Similar assessments were also performed in the United States and for some renewable energy technologies [11-16]. But none has ever been performed in the ECOWAS region for CSP technology. This study discusses the potential for large-scale CSP projects in West Africa. Table 1 summarizes the criteria used in previous CSP potential assessment studies and compares with criteria in the present study.
DNI and land slope were considered in all the studies while no study included water availability. The lack of detailed data in GIS format was pointed out by some of the authors as the main reason why the availability of water was not applied as a criterion.
3. Methodology
3.1. Overlaying in GIS
Overlaying is the method used in this study. It is an important procedure in GIS analysis. It involves superimposing two or more map layers to produce a new map layer by combining diverse data sets; Overlay analysis is used to investigate geographic patterns and to determine locations that meet specific criteria. Criteria used in this study were sufficient DNI, proximity to transmission lines, low slope value. This approach was previously used by Charabi and Gastli [9], by Fluri [8] and by Hang et al. [7]. Three maps of ECOWAS were developed illustrating spatial distribution of solar radiation resources (DNI), land slope and transmissions lines respectively; these maps are illustrated in Figures 1-3. The maps were subsequently laid over each other with given criteria. The intersected area was assumed to be suitable for CSP implementation.
Table 1. Criteria used in previous CSP potential assessment studies.
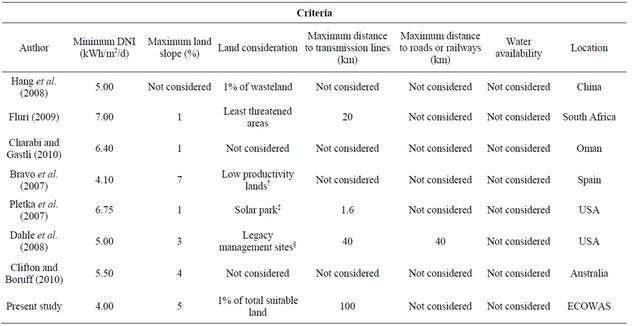
†Low productivity lands include Moorlands and bushes, big formations of dense bushes, scarce bushes, Subdesert Xerosteppe, high altitude spaces with scarce vegetation, burnt areas. ‡“Solar park” is designated land for solar plants in the Southwest, with a lease fee of $200/acre/year. §Legacy of World War II and the Cold War which includes radioactive and chemical waste, environmental contamination, and hazardous material at over 100 sites across USA.
The DNI map in Figure 1 was obtained using data from the Climatological Solar Radiation (CSR) Model from the National Renewable Energy Laboratory (NREL, USA); the model according to [17] is approximately 5% accurate.
ECOWAS has a total land area of 5,110,914 km2. This study reveals that 17% of that land area is endowed with an average daily DNI of 5.6 kWh/m2 while 38% enjoys an average daily DNI of 4.4 kWh/m2. 23% has an average daily DNI of 37 kWh/m2 and the remaining 22% records an average daily DNI value below 3 kWh/m2.
Figure 2 illustrates the land slope in the ECOWAS region while Figure 3 shows the transmission map for the same region. Both existing and future transmission lines were taken into account.
Land slope was derived from the Shuttle Radar Topography Mission (SRTM) 90 m digital elevation model [18] whereas transmission map was drawn with data obtained from the West African Power Pool (WAPP) and from the World Bank.
DNI, land slope and proximity to transmission lines are crucial factors in selecting candidate site for a CSP
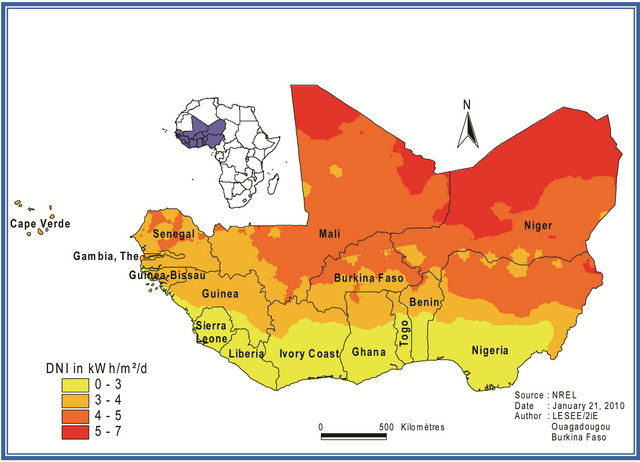
Figure 1. Annual average daily of Direct Normal Irradiation (DNI) for West Africa.
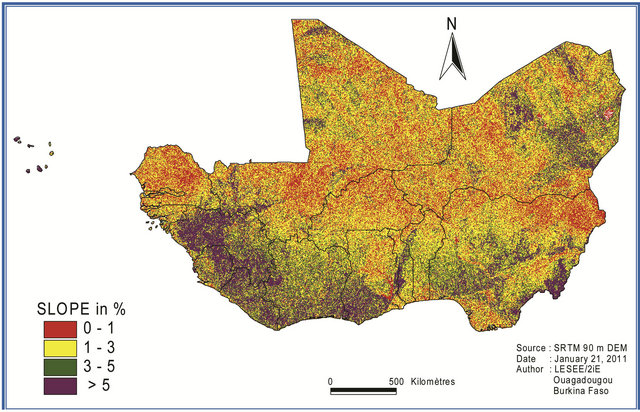
Figure 2. Land slope map for West Africa.

Figure 3. Existing and future transmission lines of the ECOWAS region.
project. These three factors strongly influence the cost of the project. Electricity production by a CSP plant is approximately proportional to the DNI of the site, hence inversely proportional to the cost of electricity. For the land slope, a small gradient is desirable since it reduces cost associated with the civil work. Furthermore, the closeness of the site to a high voltage line will reduce not only power losses but also transmission cost.
3.2. Potential Capacities and Energy Yield Estimations
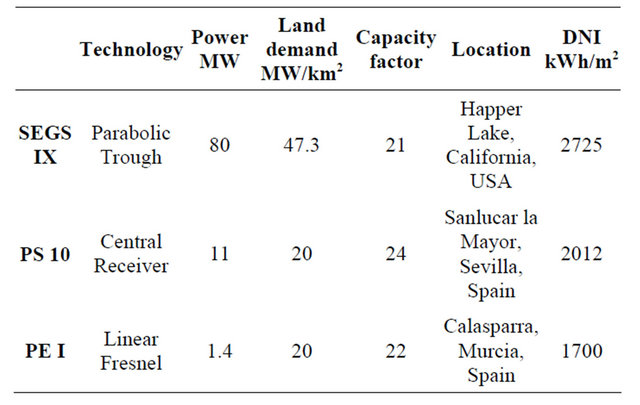
Based on the obtained land area and using performance characteristics of some reference plants such as SEGS IX, PS 10 and PE I, the nominal capacity and the energy yield were then estimated.
Many studies (see Table 2) assumed the land demand per Gigawatt of electric capacity as constant irrespective of DNI value or DNI value was just assumed to be higher than or equal to 5 kWh/m2/d; it is worth noting that this value of DNI is widely considered in the literature to be the minimum for a CSP plant to be economically viable [4]. Land demand however, strongly depends on DNI level. In the present study, land demand was assumed to be proportional to DNI and Equation (1) was deduced.
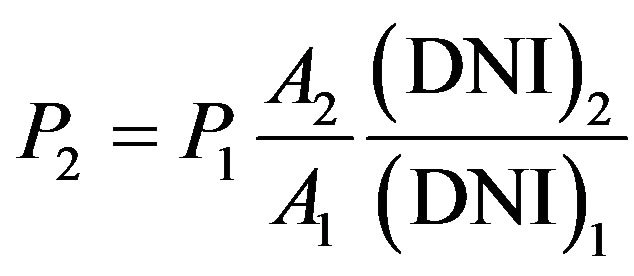 (1)
(1)
P1, A1 and  represents respectively, the installed capacity of the reference plant, the land cover in which it was built and the DNI of the area where it is located.
Once potential power was known, the energy yield could then be computed through Equation (2) using the capacity factor of the reference plant.
 (2)
(2)
3.3. Description of the Reference Plants: SEGS IX, PS 10 and PE I
SEGS IX, PS 10 and PE I were selected because of their commercial maturity.
SEGS IX is one of the nine Solar Electric Generating Station (SEGS) plants in the Mojave Desert in California. The combined electric generating capacity of these plants, which use parabolic trough technology, is more than 350 megawatts. SEGS IX which started operation in 1991, is the largest individual trough plant (along with SEGS VIII); it has an auxiliary natural gas heater which provides backup capability during low and non-solar hours [19].
PS10 (Planta Solar 10) is the first solar central-receiver system producing grid-connected electricity in a commercial basis. The plant started operation in March 2007. It is based on Direct Steam Generation (DSG) and makes use of well proven technologies, like glass-metal heliostats, a pressurized water thermal storage system, and a saturated steam receiver and turbine. The plant’s thermal storage system has a 50-minute capacity at 50% load to handle cloud transients. PS10 is located in Seville, Spain [20].
PE I (Puerto Errado 1) is a solar thermal power plant located in southern Spain. It is based on linear Fresnel collector technology and has an electrical capacity of 1.4 MW. Since March 2009, it has been connected to the local grid and selling electricity to the local network provider. It is also based on Direct Steam generation (DSG) and produces saturated steam at temperatures of up to 300˚C [21,22].
Table 2. CSP land demand in km2/GW from literature.

Table 3. Characteristics of selected reference plants.
4. Results and Discussion
In Tables 4 and 5, the first three columns contain conditions on DNI, land slope and distance to transmission lines respectively. Column 4 computes the land area that satisfies the conditions in the previous columns in square kilometers while column 6 gives same in percentage of ECOWAS total land area. Column 7 gives the corresponding average DNI in the area.
Parabolic Trough (PT), Central Receiver (CR) and Linear Fresnel (LF).
Figures 4 and 5 provide the potential capacity and the corresponding energy yield for the three reference CSP technologies. Many cases were envisaged. The high and medium DNI areas are mainly located in the Sahara and the Sahel zone of West Africa. Land use pattern in these zones can be extrapolated from the results of the study conducted by Azoumah et al. [4] for Burkina Faso, since there is a strong similarity in climate. From their study, only 36% of the land in the Sahel is occupied by housing, forest, rivers and agricultural farms with housing accounting for 0.04%. There is therefore no competition in land use in the high and medium DNI zones. However to make room for possible land occupation by surface water, forests, settlements, and arable land, only 1% of the total suitable land has been assumed in order to compute the potential capacity and the energy yield.
Considering only 1% of lands with daily DNI greater or equal to 5 kWh/m2 (about 0.17% of ECOWAS total land area), Figure 4 shows for example that the lowest potential capacity is about 0.6 GW using Central Receiver and the highest capacity is 21.3 GW with Parabolic trough. Likewise, the lowest capacity in the medium DNI zone is 10.4 GW using Central Receiver and the highest capacity is 212.4 GW with Parabolic trough (refer to Figure 5).
It is to be noted that in 2009, the total installed electricity generating capacity in ECOWAS amounted to 11.4 GW (57.8% from thermal power stations and 42.2% from hydroelectric plants) [1,23]. The projected demand by 2023 will require an installed capacity of some 17 GW [3]. For the region, there is therefore a very high potential to generate sufficient electricity from CSP. The average production cost per kWh in some countries of the region (about US$ 32 cents/kWh in Burkina Faso) is so high that even in medium potential areas, CSP may still compete with diesel plants, especially with the relentless rise in oil prices. This can only be ascertained through financial analysis, which is the subject of our
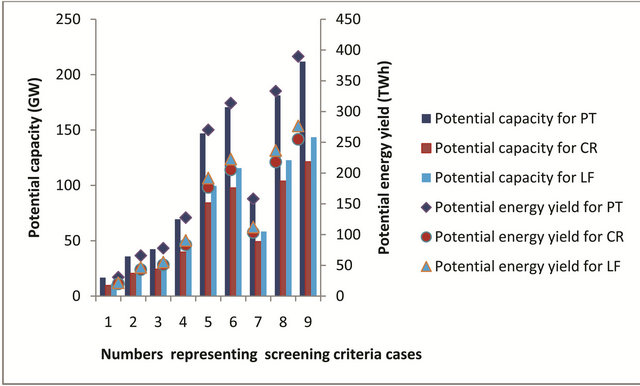
Figure 4. Potential capacity and energy yield in the high DNI zones.

Figure 5. Potential capacity and energy yield in the medium DNI zones.
next study.
Figures 6 and 7 are sample maps showing results from overlaying the three maps which illustrate the DNI, the land slope and the transmission lines in the ECOWAS region. The sample maps serve as illustration; therefore, the maximum slope and the maximum distance to transmission lines were set to their lowest values of 1% and 20 km respectively (Figure 6) and to their highest values of 5% and 100 km (Figure 7). In these Figures, sites are then ranked as high, medium and low potential zones depending on DNI level. These values are based on some studies in the literature [7,8]. As stated earlier, only sites with average daily DNI higher than 5 kWh/m2 are assumed economically suitable in the literature. However, some studies considered lower DNI values [4,6]. For the land slope, 1% gradient was taken by [8,9,11,24,25] as most economical slope for CSP plant. Hang et al. [7] suggested 3% while Broesamle et al. [5] considered even higher slope of up to 5% for parabolic trough.
In both maps, the high potential zone lies between Agadez and Arlit in northern Niger. It is located in the Sahara desert and is the host of an important uranium mining industry. There is an existing 132 kV voltage line in the region.
Northern Mali has good DNI but no transmission line is in existence or has been planned (refer to Figures 1 and 3). Building new transmission line as part of a CSP project is capital intensive. In order to illustrate the cost of transmission lines in West Africa, the 225-kV line connecting Bobo-dioulasso to Ouagadougou with a load carrying capacity of 120 MW has cost about US$290,000 per kilometre [26].
The high potential zone falls in the Sahara desert which is characterized by an important sand and dust deposit, lack of water and lack of transmission lines. Dustresistant, Waterless, dry cooling and small-scale CSP technology could be envisaged in this zone. The medium potential zone coincides with the Sahel which is a transition between the Sahara desert and the humid tropical southern coastal zone. The low potential zone corresponds to the humid tropical southern coastal zone which, unlike the first two zones has better water resources, less dust deposit and a better transmission network. Dust and sand deposit affect optical efficiency of the mirrors thus
Table 4. Potential land area in high DNI zones.
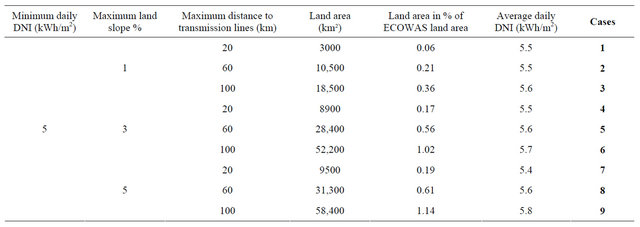
Table 5. Potential land area in medium DNI zones.
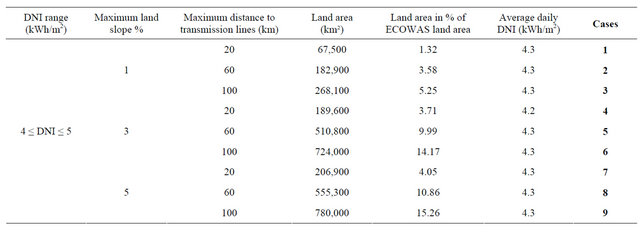
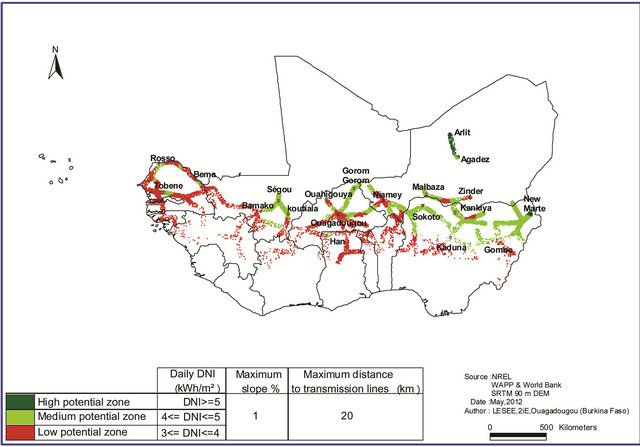
Figure 6. First sample map illustrating site ranking for large-scale CSP plants.
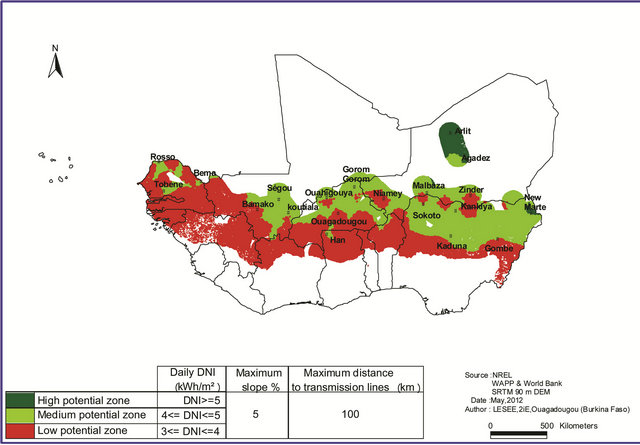
Figure 7. Second sample map illustrating site ranking for large-scale CSP plants.
causing overall output drop of the plant whilst high DNI implies better output. It must be interesting to conduct studies and to see whether the loss in overall plant performance due to deposition of dust in the high potential zone is not compensated with better optical efficiency in low-DNI but dust-free zone. This will be investigated in future work.
5. Conclusion
Concentrating Solar Power (CSP) Plants appear to be good candidate for increasing access to electricity in Africa and to improve people’s living conditions; however, with the exception of Northern Africa where extensive work is being conducted, potential assessment of CSP Plants in West Africa was yet to be done. This paper presented results of the potential assessment of Concentrating Solar Power for electricity generation in West Africa. The study considered only 1% of the suitable land area which met certain criteria and found that West Africa has a potential nominal capacity of 22.16 GW for Parabolic trough technology. This greatly exceeds the projected electricity demand of 17 GW by 2023 for the region. Of course, the study is worth within the accuracy limits of the data used. Further studies need to be conducted in order to ascertain the economic viability of such plants in the region.
6. Acknowledgements
The authors would like to express their gratitude to the African Studies Center of the University of Michigan and to the African Union through the CSP4Africa Project for their support in carrying out this work.
REFERENCES
- U.S. Energy Information Administration (EIA), “International Energy Statistics,” 2009. http://www.eia.gov/countries/.
- A. D. Quansah and E. W. Ramdé, “Potentials, Opportunities and Barriers for the Deployment and Usage of Solar Energy Technologies and Services in West Africa,” ECREEE, 2010.
- ECOWAS/UEMOA, “White Paper for a Regional Policy on Energy Access,” Abuja, 2005.
- Y. Azoumah, E. W. Ramdé, G. Tapsoba and S. Thiam, “Siting Guidelines for Concentrating Solar Power Plants in the Sahel: Case Study of Burkina Faso,” Solar Energy, Vol. 84, No. 8, 2010, pp. 1545-1553. doi:10.1016/j.solener.2010.05.019
- H. Broesamle, H. Mannstein, C. Schillings and F. Trieb, “Assessment of Solar Electricity Potentials in North Africa Based on Satellite Data and a Geographic Information System,” Solar Energy, Vol. 70, No. 1, 2001, pp. 1- 12. doi:10.1016/S0038-092X(00)00126-2
- J. D. Bravo, X. G. Casals and I. P. Pascua, “GIS Approach to the Definition of Capacity and Generation Ceilings of Renewable Energy Technologies,” Energy Policy, Vol. 35, No. 10, 2007, pp. 4879-4892. doi:10.1016/j.enpol.2007.04.025
- Q. Hang, Z. Jun, Y. Xiao and C. Junkui, “Prospect of Concentrating Solar Power in China—The Sustainable Future,” Renewable and Sustainable Energy Reviews, Vol. 12, No. 9, 2008, pp. 2505-2514. doi:10.1016/j.rser.2007.06.002
- T. P. Fluri, “The Potential of Concentrating Solar Power in South Africa,” Energy Policy, Vol. 37, No. 12, 2009, pp. 5075-5080. doi:10.1016/j.enpol.2009.07.017
- Y. Charabi and A. Gastli, “GIS Assessment of Large CSP Plant in Duqum, Oman,” Renewable and Sustainable Energy Reviews, Vol. 14, No. 2, 2010, pp. 835-841. doi:10.1016/j.rser.2009.08.019
- J. Clifton and B. J. Boruff, “Assessing the Potential for Concentrated Solar Power Development in Rural Australia,” Energy Policy, Vol. 38, No. 9, 2010, pp. 5272-5280. doi:10.1016/j.enpol.2010.05.036
- D. Dahle, D. Elliott, D. Heimiller, M. Mehos, R. Robichaud, M. Schwartz, B. Stafford and A. Walker, “Assessing the Potential for Renewable Energy Developmenton DOE Legacy Management Lands,” 2008. www.nrel.gov/docs/fy08osti/41673.pdf
- J. R. Janke, “Multicriteria GIS Modeling of Wind and Solar Farms in Colorado,” Renewable Energy, Vol. 35, No. 10, 2010, pp. 2228-2234. doi:10.1016/j.renene.2010.03.014
- R. Karsteadt, D. Dahle, D. Heimiller and T. Nealon, “Assessing the Potential for Renewable Energy on National Forest System Lands,” 2005.
- M. Kirby, D. Dahle, D. Heimiller and B. Owens, “Assessing the Potential for Renewable Energy on Public Lands,” US Department of the Interior and US Department of Energy, 2003.
- R. Pletka, S. Block, K. Cummer, K. Gilton, R. O’Connell, B. Roush, L. Stoddard, S. Tilley, D. Woodward and M. Hunsaker, “Arizona Renewable Energy Assessment, Arizona Public Service Company; Salt River Project; Tucson Electric Power Corporation,” 2007.
- R. Pletka and J. Finn, “Western Renewable Energy Zones, Phase 1: QRA Identification Technical Report,” National Renewable Energy Laboratory (NREL), Golden, CO., 2009. doi:10.2172/968196
- E. L. Maxwell, R. L. George and S. M. Wilcox, “A Climatological Solar Radiation Model,” Annual Conference, American Solar Energy Society Albuquerque NM, 1998.
- CGIAR-CSI, “SRTM 90m Digital Elevation Database v4.1,” 2003. http://www.cgiar-csi.org
- NREL, “Solar Electric Generating Station IX,” 2012. http://www.nrel.gov/csp/solarpaces/project_detail.cfm/projectID=36
- Solúcar, “10 MW Solar Thermal Power Plant for Southern Spain,” 2006.
- M. Selig, “PE1: First Fresnel Solar Power Plant in Operation Experiences and Outlook,” 2009. http://www.fundaciongasnatural.org
- Novatec-Biosol, “PE 1: World’s First Fresnel Solar Power Plant in Commercial Operation,” 2011. http://www.novatecsolar.com/files/mne0911_pe1_broschure_english.pdf
- E. Gnansounou, H. Bayem, D. Bednyagin and J. Dong, “Strategies for Regional Integration of Electricity Supply in West Africa,” Energy Policy, Vol. 35, No. 8, 2007, pp. 4142-4153. doi:10.1016/j.enpol.2007.02.023
- R. Pletka, S. Block, K. Cummer, K. Gilton, R. O’Connell, Bill Roush, L. Stoddard, S. Tilley, D. Woodward and M. Hunsaker, “Arizona Renewable Energy Assessment, Arizona Public Service Company; Salt River Project; Tucson Electric Power Corporation,” 2007.
- S. M. Cohen, R. Cable, F. Morse, et al., “Solar Thermal Parabolic Trough Electric Power Plants for Electric Utilities in California,” Solargenix Energy, California, 2005.
- WAPP, “West African Power Pool Priority Projects,” 2011. http://www.ecowapp.org/priority_project.html.
NOTES
*Corresponding author.