Natural Resources
Vol. 4 No. 2 (2013) , Article ID: 32952 , 14 pages DOI:10.4236/nr.2013.42026
Long-Term Projections of Global Food Requirements: Why Were We Wrong?
![]()
Department of Economics and Finance, Montclair State University, Upper Montclair, USA.
Email: ims20b@cs.com
Copyright © 2013 Ira Sohn. This is an open access article distributed under the Creative Commons Attribution License, which permits unrestricted use, distribution, and reproduction in any medium, provided the original work is properly cited.
Received December 21st, 2012; revised March 9th, 2013; accepted March 28th, 2013
Keywords: Long-Term Economic Models; Global Food Projections; Assessment of Long-Term Agricultural Projections
ABSTRACT
This article reports on and analyzes long-term projections of world food requirements compared with observed 2000 data reported by the United Nations’ Food and Agriculture Organization. The importance of this “post-mortem” is to strengthen the case for carrying out long-term projections of essential resources—food, energy, and non-fuel minerals— because of the long-lead times needed to insure that adequate global output levels of these basic ingredients of living standards will be met. This study should prove useful to those preparing today’s long-term projections, with world population projected to rise to over 9bn by mid-century.
1. Introduction: Global Agriculture in the 21st Century and Long-Term Projections
The run-up of global food prices since 2004 that reversed a three-decade old pattern of declining or stable prices is causing concerns in developed and developing countries alike, as well as in international organizations such as the World Bank and the United Nations’ Food and Agriculture Organization (FAO). Higher prices for food and energy—the two principal components of economic wellbeing—are putting at risk the accessibility, availability, and affordability of these two critical resources for millions of the world’s most vulnerable people. Some of the gains made over the last decade or two in reducing the number of people living in poverty worldwide have been lost due to the sharp increases in food and energy prices. Even though the FAO’s global food price index at the end of 2012 has receded modestly from its peak in 2010- 11, currently, it is still 100% higher than it was in 2000 [1]. As a consequence, since the 2007-08 civil unrest in some 30 food-short developing countries [2], the issue of “food security” is becoming as important as the issue of “energy security” in the international public policy debate.
Increasing geo-political tensions among the leading economic powers who are trying to lock-in their resource supplies, along with mounting scientific evidence of climate change due to the emissions of greenhouse gases, is making it clear to political leaders and policy-makers that transformational changes in the global energy, transport, manufacturing, and agricultural systems will be required if living standards are to increase over the next 40 years, when the world’s population is projected to reach more than 9bn people [3]. Consequently, there is a critical need for long-term projections of these resources—because of the long lead-times to develop additional food and energy capacities—if rising geo-political stress and domestic civil unrest are to be contained.
Before turning to the subject of this article, it is important to provide the context for writing it. In September 1981, a symposium sponsored by the Norwegian Nobel Institute was convened to “explore the long-term perspectives of world demographic and economic growth with particular emphasis on international differentials in demographic and economic characteristics, on resources and supplies, and on implications for emerging patterns of cooperation and conflict” [4].
This article reviews long-term global projections made more than 30 years ago of four agricultural sectors: livestock products (including meat, eggs, and milk products); oil crops (which include oilseeds, peanuts, and soybean products, among other crops); grains (which include maize (corn), rice, wheat, barley, and oats, among others); and root crops (which include potatoes, sweet potatoes, cassava, and yams, but not sugar crops), with the observed data from FAO’s detailed Food Balance Sheets [5].
2. Long-Term Studies on Agriculture, Food, and Nutrition
Two studies published within a year of each other that focused on long-term trends provide the facts to support the view that without a successful global agricultural sector that incorporates production, transportation, distribution, and changing consumption patterns, improved material well-being in the future—characterized by higher life expectancy, improved nutrition, higher incomes, and lower poverty rates—will not be possible.
Robert Fogel [6] used statistical data—with particular emphasis on Europe and America—to highlight the remarkable extension of life expectancy in the 20th century and the decline in mortality and morbidity rates which he attributed largely to increasing (and nutritionally-improved) food supplies that provided the higher energy levels needed for a growing and increasingly healthy work force to fend off a long list of, often fatal, infectious diseases. In turn, these improvements in human nutrition contributed to economic growth and development and technological change, and vice versa. Without this synergy, it is doubtful that mortality and morbidity rates would have declined sufficiently to achieve the remarkable average life expectancy levels that we are enjoying today.
Giovanni Federico [7] reviewed the success of agriculture over the last two centuries. Federico argued that the world agricultural system has successfully fed an ever-growing population with an increasing variety of products at falling prices, and, simultaneously over the 200 hundred years since Malthus’s hypothesis [8], it did this while releasing a growing number of workers from agricultural work to the rest of the economy. According to Federico, the world was able to feed 6.5bn (in 2005), up from 1bn in 1800, because of steady progress in the “primary forces”—scientific advance, technological and institutional change, and globalization.
However, Federico questioned whether the still growing population in the developing countries can be provided with the nutritional standards of the developed countries that reflects a much higher proportion of meat and dairy products that are much more land-intensive than a diet comprised primarily of cereals.
Another important issue that Federico raised is the front burner issue of the “sustainability of modern agriculture”, that is, how do we mitigate the environmental damage caused by the excessive use of fertilizers and pesticides, diminishing bio-diversity, increasing scarcities of water and land, and increasing levels of greenhouse gas emissions, with the continuing improvement in the nutritional value of food in particular, and material wellbeing in general, in Asia and Africa in the 21st century?
The US Department of Agriculture (USDA) publishes 10-year projections every year of commodities, trade, and prices based on projected US and world economic and population growth, agricultural policies, and other assumptions that affect the demand and supply conditions in the global agricultural sectors. The United Nations’ Rome-based Food and Agriculture Organization recently published long-term projections of global food and nutrition levels for 2050 [9].
Two other organizations that develop long-term projections of global food and agriculture requirements are the Washington-based International Food Policy Research Institute (IFPRI) that is supported by the Consultative Group on International Agricultural Research (CGIAR), and the International Institute for Applied Systems Analysis (IIASA), in Laxenburg, Austria, that conducts policy-oriented research on problems that are both global and inter-disciplinary in nature. Their recent work on long-term projections of global agricultural requirements to 2050 appears in the FAO report, “Looking Ahead in World Food and Agriculture: Perspectives to 2050” [9].
In addition, a number of recent policy papers by government and academic experts [10,11] and review articles in the international press have appeared [3,12,13] on the challenges and opportunities for farming and food to the middle of the 21st century.
3. The United Nations World Input-Output Model
In the early 1970s with the recognition of the increasingly adverse environmental effects caused by worldwide industrialization and the first major oil crisis in the decade, the United Nations voiced its concerns regarding the growing gap in per capita incomes between the less-developed countries of the world and the highly industrialized ones.
As a result, in 1973 the United Nations commissioned the construction of a general-purpose model of the world economy. In hindsight, writing in mid-2012, this modeling effort should still be recognized as an intellectual “tour de force”. As far as the resource sectors were concerned, the model—which was developed by Professor Wassily Leontief, who was awarded the 1973 Nobel Memorial Prize in Economic Science—tracked three fossil-fuels, six metallic minerals, and four agricultural resources. Other agriculturaland food-related variables included in the model were irrigation investment, land development, cultivated land area, calories and proteins per day, and fish catch. The model also included 30 manufacturing and service sectors, as well as eight types of major pollutants, and five pollution abatement activities [14].
Economic activity was regionalized—the countries of the world were originally aggregated into 15 regional blocks—but were unified by export and import flows of goods and services, capital flows, aid transfers, and “cross border” payments of interest on borrowed capital. An upgrade of the model around 1980 separated the two countries—Canada and the United States—included in the “North America” region, making a total of sixteen regions.
Once assembled, the model was designed to provide quantitative projections of regional and global resource requirements, pollution levels, cumulative resource use, and required inter-regional financial flows, etc., under varying assumptions regarding future income growth in the developed and developing countries with a view towards narrowing the income gap between the two groups of countries from 12:1 (in 1970) to 7:1 (by the year 2000). Curiously, according to the observed per capita GDP for the year 2000 used in the tables in this article, the income gap between the two groups of countries declined from 12:1 in 1970 to 6.6:1 in 2000.
4. Projected and Observed Population and Income Growth: The Main Drivers of Global Food Requirements
This section presents the principal long-term determinants of food consumption—population and income growth. The population projections made in the mid-1970s for the year 2000 by the United Nations Population Division [15] were insignificantly different from the observed global rate for 2000 (Table 1).
This table presents the projected and observed annualized regional population, Gross Domestic Product (GDP), and GDP per capita growth rates for the projection interval. (Please see Tables A1 and A2 in the Appendix for the country and region aggregation schemes). The lower observed population growth rates for most of the regions (with the exception of Africa, Asia, one European region, and the United States) as compared to the projections are consistent with long-term demographic trends. The demographic changes in two of the European regions WEH (western Europe, high income) and EEM (eastern Europe, medium income) are the result of the re-unification of Germany in the early 1990s and the migration of many eastern-Europeans to western Europe, in part, as a result of the economic stress in the eastern countries in the wake of the collapse of the Soviet Empire in the late 1980s. As for the US, the higher observed population growth rate compared with the projected rate for the projection interval is most likely the result of increased immigration during the last two decades. The observed growth rate for (non-Japan) Asia exceeded the projected rate by less than 10%, and the only substantial “error” appears to be Africa (AF), where the observed rate exceeded the projected rate by 0.5% per year.
Observed world GDP growth was less than the rate projected by the World Model, despite the formidable growth rates achieved by China (ASC), and India and other Asian countries (ASL), from 1980 to the terminal year, 2000. The observed lower growth rates in GDP relative to the projected rates over this interval in the middle-eastern oil-producing countries (OIL), Central and South America and the Caribbean (LA), South Africa (SAF), the Soviet Union (SU), and Eastern-Europe (EEM), and the lower observed growth in Japan and Western Europe (WEH), can be attributed to an array of well-known political, social, economic and financial problems that these regions confronted during the 1980- 2000 interval. These problems also explain, in part, the lower observed world GDP growth rate relative to the projected rate despite the successes in Asia.
The last two columns of Table 1 present projected and observed annual growth in GDP per capita. For economists, per capita GDP represents an imperfect, though adequate, metric to measure relative “living standards” and their growth (or decline) over time.
In addition to population and GDP growth, regional and global food requirements are also impacted by other important variables such as urbanization rates, which along with higher living standards, result in changing diets such as a movement away from root crops to grains, and finally, to increased livestock products, characterized by more meat, eggs and cheese, in daily diets.
Despite not having access to the documentation regarding the technical relationships governing these regional changes in food diets from decade to decade over the projection interval when preparing this article, it is my understanding that because the World Model tracked both the changing regional urbanization rates and per capita GDP levels from decade to decade, the projections of the regional food requirements were, in part, determined by these factors that were modified region-byregion and decade-by-decade.
5. Global Agriculture, 1970-2000: The Projections and the Observed Data
5.1. Production and Domestic Supply
This section provides an overview of the projections and observed data for the 30-year projection interval. Please see Appendix B1 for some caveats about the data, and Appendix B2 for a comment about “consumption” in the World Model. Tables 2 and 3, respectively, present the projected and observed annual growth rates in production and domestic supply (and, in the case of the observed data, food consumption) for the four agricultural sectors.
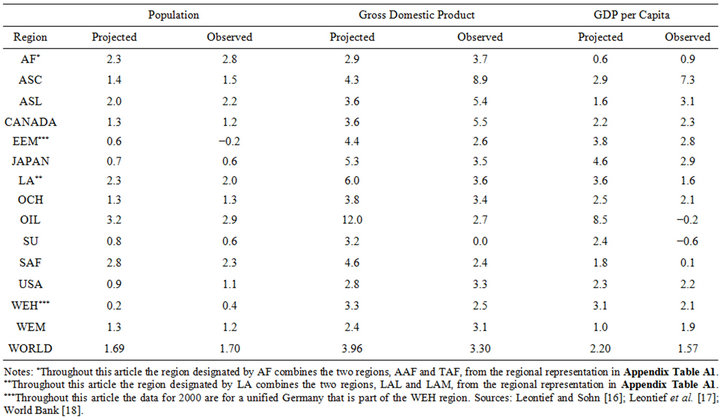
Table 1. Projected and observed growth in population, gross domestic product, and gross domestic product per capita, 1970-2000 (annual percentage change).
At the global level the projected annual growth rates are remarkably close to the observed rates, save oil crops, where the observed growth rate is almost four times higher than the projected rate. I comment on this discrepancy in Section 6, below. It would be reasonable to expect greater divergence at the regional level, not only between the projected and observed production values, but also between the values for regional domestic supply because of import, export (and, in the case of the observed data, inventory adjustment) activities. This is indeed the case. Section 6 examines the differences at the regional level between the projected and the observed growth rates employing the central explanatory variables— population, GDP, and GDP per capita growth—as the “primary suspects”. At the global level, the observed growth rates of livestock products, oil crops and grains all exceeded the rate of growth in population and per capita GDP, with only the rate of growth in production of root crops lagging population and per capita GDP growth.
5.2. Regional (or Country) Dependence on Food Imports
“Food security” has become an issue for countries who rely on food imports to bridge their shortfall between domestic production and food consumption. The World Model also tracked regional import and export activities. Therefore, it would be of interest to examine the changing position of these regions over the 30-year period with respect to their dependence on imports to supplement their domestic food production. It is important to remind readers that the degree of import dependency of a region—or more specifically of a country—on energy or food is only one factor among others that comprise the more complex terms “energy security” or “food security”. Some of these other factors include the sources of those imports, the availability of substitutes, the ease or difficulty of increasing efficiency in their use, etc.
The changing rates of projected and observed dependency on agricultural imports are presented in Table 4. While there are relatively large differences between the projected and observed data regarding the degree, i.e., the percent, of import dependency in 2000, generally speaking there is broad agreement between the projected and observed data regarding the regions that are most dependent on imports to supplement their domestic production.
5.3. Per Capita “Consumption” of Livestock Products and Grains: The Projections and the Observed Values in 1970 and 2000
Table 5 presents the projected and observed annual per capita domestic supply (in kilograms) of two of the four
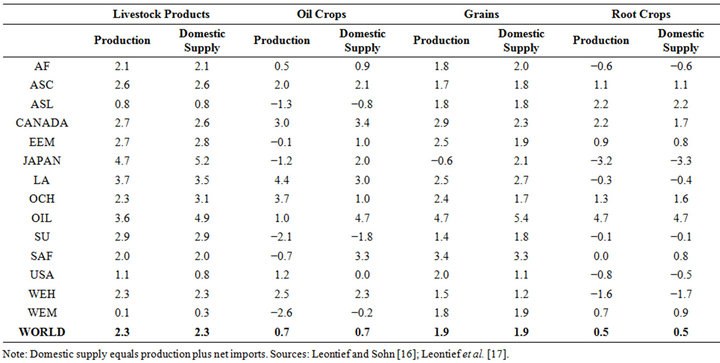
Table 2. Projected growth rates in production and domestic supply in four agricultural sectors, 1970-2000 (annual percentage change).
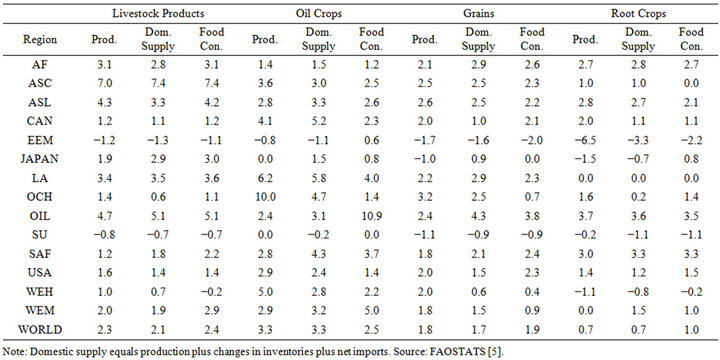
Table 3. Observed growth rates in production and domestic supply in four agricultural sectors, 1970-2000 (annual percentage change).
agricultural sectors in this study: livestock products and grains. Grains were selected because it was (by far) the largest of the commodity groups in tonnage, and livestock products were selected because increased per capita consumption of livestock products is closely associated with higher living standards. (Readers are reminded that “domestic supply” (see Appendix B2)—domestic production and inventory changes plus net imports—is distributed to uses such as food, feed, seed, processing, etc).
At the global level the 2000 projection of per capita domestic supply was 17% above the observed FAO level, though most of the difference, 11%, is due to the higher base year value. For livestock products, the projected global level agrees well with the 2000 observed level, even though FAO’s base year value was 5% above the World Model 1970 level.

Table 4. Import dependence in agriculture, 1970 and 2000: projected (WM) and observed (FAO) ratios (in percent).

Table 5. Projected (WM) and observed (FAO) annual per capita domestic supply of livestock products and grains, 1970 and 2000 (in kilograms).
With a few exceptions, per capita domestic supply of livestock products and grains increased in those regions where living standards advanced and declined in those regions where living standards stagnated or fell. (Please see Section 6). These trends are more sharply discerned in Table 6, which presents only the observed changes in annual per capita consumption of livestock products and grains as food consumption.

Table 6. Observed (FAO) changes in annual per capita food consumption of livestock products and grains, 1970 and 2000 (in kilograms).
5.4. Calories and Protein: The “Stuff” of Life
The global increase in daily calorie and protein levels and the decline in poverty rates, particularly in East Asia over the last two decades and more recently in Sub-Saharan Africa, is well documented in Perry [19]. According to Fogel [6], two critical “ingredients”—the total daily calorie level and the amount of daily protein intake—play a crucial role in improving labor productivity, both physical and mental, which, for economists, is the single most important factor responsible for rising living standards.
Table 7 presents the projections and the observed levels of daily per capita calorie and protein levels for 1970 and 2000. For the world, the World Model projected (or targeted) only a very modest increase in daily calories, from 2400 in 1970 to 2500 in 2000, an increase of only 4.2%, along with an increase of 12% in daily per capita protein levels over their 1970 levels. On the other hand, globally, the observed data indicate more impressive gains in both calorie and protein levels over the 30-year interval: a 13.6% increase in global daily per capita calories, along with a 15% increase in daily per capita protein levels.
It is of interest to note the observed changes recorded over the projection interval in three key regions: ASC, which is dominated by China; North America, incorporates both Canada and the United States; and the former Soviet Union. The observed changes in the first region attest to the well-documented improvement in material wellbeing in China over the projection interval, the result of the reform program that began in the late 1970s, including China’s re-engagement with the world economy. The changes in the second region provide some additional proof of the ongoing “obesity crisis” in North America with the large observed—though arguably unnecessary—increase in daily calorie levels in both Canada and the US from an already relatively elevated 1970 base year level. The changes in the former Soviet Union portray a region in crisis, with both daily per capita calorie and protein levels falling over the projection interval. In particular, readers will recall that the 1990s was a decade of enormous economic and political stress in the former Soviet Union, accompanied by falling living standards that is borne out in these data and the data on population and income growth (Table 1).
6. Analyzing the Differences
This section addresses the source of the differences in the projected and observed growth rates in domestic supply of livestock products and grains at the regional level. The one sector where there is significant divergence between the projected and observed growth in consumption over the 30-year interval is in oil crops. Pending a follow-up study, part of the discrepancy is likely to be definitional. In addition, part of the difference might be explained by the very large observed increase in global soybean production and consumption over the 30-year projection interval that was unanticipated when the projections were
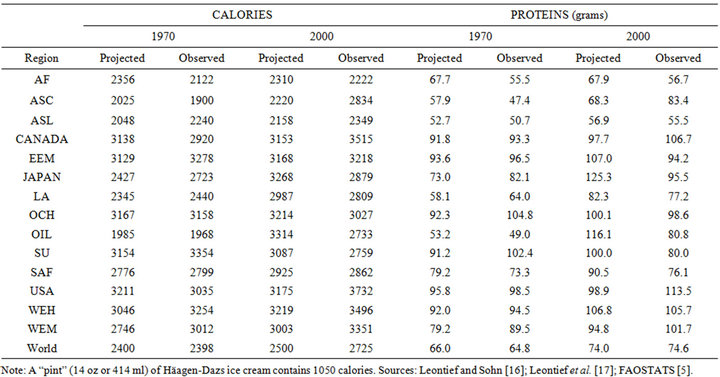
Table 7. Projected (WM) and observed (FAO) levels of daily per capita calories and proteins, 1970 and 2000.
made in the late 1970s [5].
Figures 1 and 2, below, provide an overview of the cumulative changes in projected and observed domestic supplies of livestock products and grains, respectively. Differences in projected and observed regional population, GDP, and per capita GDP growth rates over the 30-year projection interval (please see Table 1), not unexpectedly, serve as good explanatory variables in accounting for these differences in consumption rates in these two food sectors.
The most obvious differences are in the region that incorporates China—Asia Centrally Planned (ASC). The very large difference in consumption of livestock products is most likely explained by the difference between the projected and observed growth in the region’s per capita GDP (Table 1). As living standards improve, higher per capita meat and dairy products consumption and increased daily per capita protein levels follow. This is confirmed in the data for China (the ASC region) in Tables 5-7, above. In the ASC region, according to the FAO, annual per capita consumption of livestock products increased from 11.1 kg to 60.7 kg, and annual per capita consumption of grains increased from 133 kg to 167 kg from 1970-2000 (Table 6). This improvement in living standards is also confirmed by a 50% increase in daily per capita calorie levels, and a 75% increase in daily per capita protein levels (Table 7).
Japan is another region where there is a large discrepancy between the projected and observed changes in the consumption of livestock products and grains (Figures 1 and 2). These discrepancies can be explained by the much slower GDP growth rate that was observed relative to Japan’s projected GDP growth over the interval (please see Table 1).
Another large regional difference between the projected and observed cumulative change in the consumption of both livestock products and grains over the period was in the region SU, incorporating Russia. According to the two figures, the cumulative difference between the World Model and the FAO data is approximately 120% for livestock products and about 70% for grains.
These differences can be explained by a combination of slower observed population growth and the very poor performance of the regional economy that resulted in a decline in the observed standard of living in the region over the projection period (Table 1). The break-up of the Soviet Union and the painful restructuring in its wake exacted a heavy price on the region’s standard of living. The region experienced a decline of 27% in per capita consumption of livestock products and a 36% reduction in per capita grain consumption (please see Table 6, above). The decline in regional living standards as a result of the momentous political and economic events that culminated in the dissolution of the Soviet Union in 1991 and the major restructuring program that followed are also manifested by 20% reductions in the levels of daily per capita calories and proteins (please see Table 7).
Finally, the eastern European countries (EEM) registered large differences between the projected and observed growth rates in food consumption over the 30-year projection interval (Tables 2 and 3). The reasons are similar to those in the case of the Soviet Union.
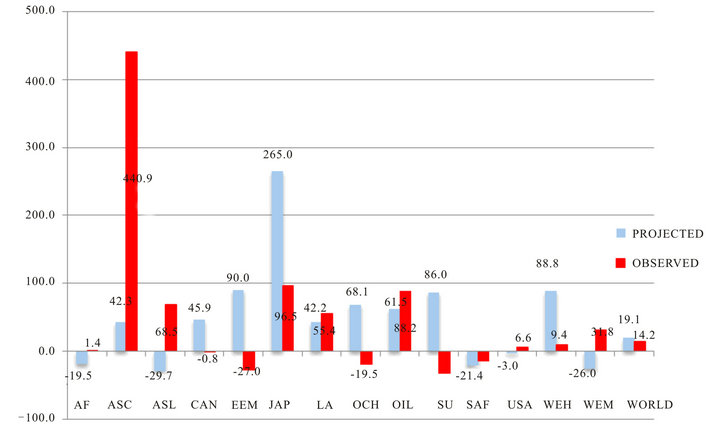
Figure 1. Projected and observed cumulative change in domestic supply of livestock products, 1970-2000 (in percent). Sources: Leontief and Sohn [16]; Leontief et al. [17]; FAOSTATS [5].
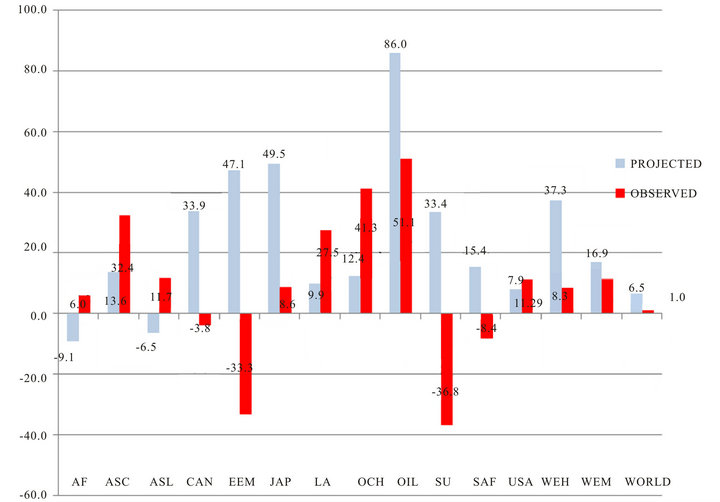
Figure 2. Projected and observed cumulative change in domestic supply of grains, 1970-2000 (in percent). Source: Leontief and Sohn [16]; Leontief et al. [17]; FAOSTATS [5].
When the projections were made population growth was assumed to be positive (though modest) and GDP growth was projected at 4.4% p.a., with the growth in food consumption ranging from 0.8% - 2.8% p.a. in the four food categories tracked by the World Model. With the collapse of the Soviet Union—and the Warsaw Pact—eastern Europe was thrown into political turmoil that had profound demographic and economic implications.
Observed annual growth in GDP averaged little more than half the projected rate, and the region’s population actually declined over the period (Table 1). As a result, living standards fell in the region, including sharply lower observed food consumption in 2000 than projected for that year (Tables 2 and 3), and lower observed consumption in all four food categories in 2000 than observed in 1970 (Table 3)! According to the FAO, per capita consumption of livestock products declined by 24%, and per capita consumption of grains declined by 45% over the 1970-2000 interval (Table 6). In addition, eastern Europe (EEM) recorded lower levels of daily calories and proteins per capita in 2000 than in 1970 (Table 7).
Root Crops
Global production and consumption of root crops were projected to increase by only 0.5% p.a. over the 1970- 2000 interval, considerably below projected global population growth, not to mention income growth. According to the FAO, the observed growth rate in production and domestic supply of root crops during this 30-year period was only 0.7% p.a., the slowest growing food category in this study (please see Table 3).
A closer examination of the observed regional data on root crops in Table 3 suggests that this food category exhibits the characteristics of an “inferior good”, that is, as income increases, demand increases very modestly (and in some cases declines absolutely). This appears to be the case for most of the high-income developed regions such as Canada, Japan, Oceania, Western Europe, and the United States.
The relatively large decline in root crops consumption in Eastern Europe (EEM) and the Soviet Union (SU) can be attributed to the poor economic performance of these regions during the projection period, as was discussed above. The growth in demand for root crops appears to be highest in the regions experiencing low or negative growth in per capita income over the projection interval—Africa (AF), the Middle-East oil producing countries (OIL), and South Africa (SAF)—or in countries with very low per capita incomes, many of whom are embedded in ASL, the Asia low income region (please see Table A1 in the Appendix).
7. Conclusions
The “conventional wisdom” regarding minimum required daily calorie levels suggests levels at approximately 2100 calories per capita [3]. According to the observed data reported in Table 7, above, at the global level this was easily met even in 1970, not to mention the 14% increase by 2000. It is important to note, that over the 30-year projection interval of this study, the world’s population also increased by 65% over its 1970 level.
With a view towards the future, and, in particular, to those engaged in today’s long-term modeling efforts, i.e., to 2050 and beyond, there is an indispensable need to look ahead 30 - 40 years using plausible assumptions regarding the forces that will drive future global food requirements. They include the following: a projected 30% increase in the world’s current population by 2050; continued economic growth, especially in Asia and Africa; a growing scarcity of agricultural inputs (land and water) and outputs (maize and sugar cane) due to their diversion to the production of bio-fuels and driven by higher population levels and living standards, along with increased urbanization rates, particularly in Asia and Africa; the expected environmental impacts from global warming on agricultural output on the one hand, and, on the other, the projected elevated levels of methane and nitrous oxide emissions as livestock output and fertilizer use increase along with population levels and living standards, particularly in China, and other high-growth countries in Asia and Africa.
On the production side, increasing food output by a projected 70% by 2050 [3] will require the development and adoption of new technologies such as improved irrigation methods, more widespread planting of genetically modified crops that are resistant to herbicides and pesticides, and the introduction of plants that are drought, saline, and/or flood tolerant, reducing the “yield gap” between the “best”, “worst”, and “average” yielding land, and reducing the amount of food in both developed and developing countries that is lost to waste, currently estimated to be 30% - 40% of the total [11]. The introduction of aquaculture four decades ago, and its increasing share of the world’s supply of consumed fish, serves as a shining example of the ability of the global food system to find solutions to critical global challenges. It will be interesting to follow the progress of the development of “cultured meat”, that is, meat grown from stem cells, over the next quarter century.
Finally, even though current daily calorie levels on a per capita basis in all 15 regions in this study are above the minimum required 2100 calories (Table 7), according to the FAO, 925 m people were classified as “hungry” [20], and, according to Save the Children, the international NGO that promotes children’s rights, one in four children in the world is malnourished [21]. Therefore, one of the major challenges in the 21st century is the implementation of food “safety nets” for these vulnerable people through policy and institutional initiatives to the end of reducing, if not eliminating, the daily struggle for food of more than 13% of the world’s population.
8. Acknowledgements
I am grateful for the Sabbatical leave provided to me by Montclair State University that enabled me to carry out this study. I am indebted to Claudia Binaghi for building the neat tables and bar graphs that makes the paper more readable. I thank Paul Westcott, at the USDA’s Economic Research Service, for taking the time to read through an earlier version of the manuscript, and for bringing to my attention some errors that have been corrected.
REFERENCES
- L. Lucas and J. Fontanella-Khan, “Food Security: Dampened Prospects,” Financial Times, 2012.
- Financial Times, “Feeding the 9 bn,” Editorial, Financial Times, 2012.
- J. Parker, “The 9 Billion-People Question: A Special Report on Feeding the World,” The Economist, 2011.
- J. Faaland, “Population and the World Economy in the 21st Century,” Basil Blackwell, Oxford, 1982, p. vii.
- FAOSTATS, Food and Agriculture Organization, United Nations, Rome, 2012. http://www.faostat.fao.org/site/354/default.aspx#ancor
- R. Fogel, “The Escape from Hunger and Premature Death, 1700-2100,” Cambridge University Press, Cambridge, 2004. doi:10.1017/CBO9780511817649
- G. Federico, “Feeding the World: An Economic History of Agriculture, 1800-2000,” Princeton University Press, Princeton, 2005.
- T. Malthus, “An Essay the Principle of Population,” 1798. http://www.econlib.org/library/Malthus/malPop3.html
- P. Conforti, “Looking Ahead in World Food and Agriculture: Perspectives to 2050,” Food and Agriculture Organization, Rome, 2011.
- United Kingdom Government Office for Science, “Foresight: The Future of Food and Farming,” (Executive Summary), The Government Office for Science, London, 2011.
- H. C. Godfray, et al., “Food Security: The Challenge of Feeding 9 Billion People,” Science, Vol. 327, No. 5967, 2010, pp. 797-834. doi:10.1126/science.1185383
- Financial Times, “World Food: A Special Report,” Financial Times, 2011.
- J. Foley, “Can We Feed the World and Sustain the Planet?” Scientific American, Vol. 305, No. 5, 2011, pp. 60-65. doi:10.1038/scientificamerican1111-60
- W. Leontief, A. Carter and P. Petri, “The Future of the World Economy,” Oxford University Press, Oxford, 1977.
- United Nations, “United Nations Population Projections,” UN Population Division, United Nations, New York, 2003. http://www.un.org/esa/population/unpop
- W. Leontief and I. Sohn, “Population Food and Energy and the Prospects for Worldwide Economic Growth to the Year 2030,” In: J. Faaland, Ed., Population and the World Economy in the 21st Century, Basil Blackwell, Oxford, 1982, pp. 96-127.
- W. Leontief, J. Mariscal and I. Sohn, “Prospects for the Soviet Economy to the Year 2000,” The Journal of Policy Modeling, Vol. 5, No. 1, 1983, pp. 1-18. doi:10.1016/0161-8938(83)90019-4
- World Bank, “World Development Report, 2002,” Oxford University Press, New York, 2002.
- G. Perry, “Poverty Reduction and Growth: Virtuous and Vicious Circles,” The World Bank, Washington DC, 2006. doi:10.1596/978-0-8213-6511-3
- World Hunger, 2012. http://www.worldhunger.org/articles/Learn/world%20hunger%20facts%202002.htm
- Associated Press, 2012. http://hosted2.ap.org/COGRA/APWorldNews/Article_2012-02-15-AF-Africa-Child-Hunger/id-0b95f90587674c1187f3b8b933bb7452
Appendices
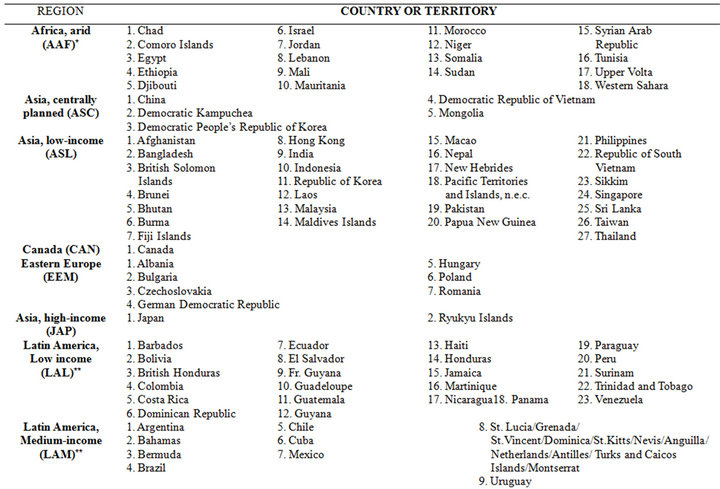

Table A1. Country and regional classification for the world model.
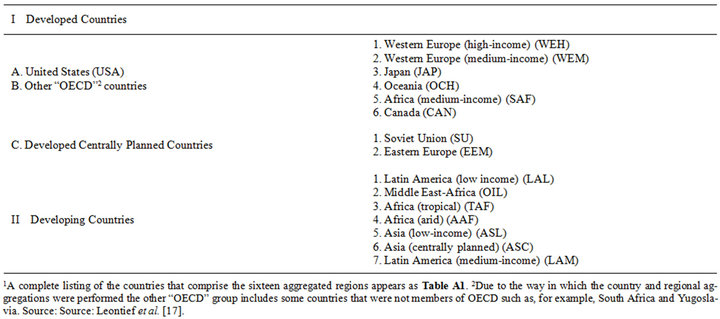
Table A2. Aggregated regional classification1.
Appendix B1.
Some Caveats about the Data A few warnings are in order regarding some data problems I encountered in order to make the World Model data and regional classification system compatible with FAO’s database. Many, though not all, of the inconsistencies and anomalies have been mitigated (if not eliminated) by using annual or total growth rates in place of levels of agricultural output and consumption for the projections and the observed data.
For example, in the 1970s the region EEM in the World Model represented all the central European countries in the then-Soviet Union’s orbit (with the exception of Tito’s Yugoslavia). By the early 1990s and the unification of Germany, national accounts data (population and GDP growth statistics), as well as food production and consumption data, were no longer represented separately for East and West Germany, and, as a result, a “unified” Germany, for the observed, i.e., FAO, data in both 1970 and 2000, was included in the western Europe (high income) region.
Similarly in the case of the former Soviet Union, while the model’s projections for 2000 are for the (intact) Soviet Union, I was forced to reconstruct the “old” Soviet Union for the observed 2000 data since FAO’s database does not report data for the Soviet Union after 1991, following its dissolution. Some of the data problems I encountered could have been resolved in a more satisfactory way, but FAO staff was unwilling to respond to repeated requests to provide answers to these questions.
Other political changes since 1970 proved more challenging in reconciling World Model regions with the FAO database. For example, in the closing years of the “Cold War”, circa 1974-76, when the World Model was constructed, South and North Vietnam were assigned to different regions; the former to Asia Low Income (ASL), and the latter to Asia Centrally Planned (ASC). Since FAO’s database for 1970 does not track data for a divided Vietnam, therefore, the “unified” Vietnam was assigned to the Asia Centrally Planned region (ASC).
And then there is always the intractable problem of Taiwan. FAO, a United Nations organization, no longer recognizes Taiwan with country status, and therefore does not have a separate listing for it in its agricultural database. The World Model, constructed in the mid- 1970s, included Taiwan in the ASL region, and Mainland China in the ASC region. Presumably, FAO’s data for China, both in 1970 and 2000, include both. But again, without more cooperation from FAO staff on these questions, I am unable to provide any further clarification on this issue.
In the original regional breakdown in the World Model, Latin America (including Mexico and the Caribbean) was divided into two regions (Latin America, low income and Latin America, medium income). In order to accommodate FAO’s regional classification—Central America (which includes Mexico), the Caribbean, and South America—these three FAO regions were aggregated into one, and the two World Model regions were combined into one, so there is now one “super” region in both sets of data for Latin America (LA). For Africa, a similar aggregation was performed: the World Model represented Africa with three regions—Arid Africa, South Africa, and Tropical Africa. The major oil-producing and exporting countries in Africa, such as Algeria, Libya, and Nigeria, were consigned to the region designated by OIL that included countries such as Iran, Iraq, and Saudi Arabia. I aggregated the regions Arid Africa and Tropical Africa into one separate region, Africa (AF), while retaining South Africa as a “stand alone” region. This was done to facilitate the assembly of data from FAO’s database for 55 African countries that are represented in the World Model.
Other problems resulted from missing or incomplete documentation of technical information on the composition of the four broad-based groups of agricultural products tracked by the World Model. While the Model’s base-year is 1970, it is quite possible that the agricultural data may have been from an earlier year, and/or it is likely that revisions in subsequent years were made to the “1970” data by FAO as part of their normal data management procedures. As a result, the base-year 1970 World Model data can vary substantially from the 1970 observed data in the current FAO database. Fortunately, utilizing annual and total growth rates over the 30-year interval in place of levels, as mentioned above, can address this problem.
Appendix B2.
A Comment on “Consumption”
While the “production” of agricultural output is well defined in both the World Model and the FAO database, regional “consumption” in the World Model is derived as a residual to regional production minus exports plus imports, and, as a result, I use the term “domestic supply” instead of “consumption”, a term that better aligns with the term used for this “equation” in FAO’s Food Balance Sheets. Needless to say, in the World Model projections, there are no increases or reductions in regional inventories or other “frictions” such as crops being used for feed or seed purposes. On the other hand, FAO’s Food Balance Sheets provide statistics for these “frictions”, and also provide a category for each crop that was used as “food”, which appears in some of the tables, in addition to “domestic supply”. Finally, while the “production” and “domestic supply” growth rates, both annual and total, will be equal for the world in 1970 and 2000 in the World Model projections (“rounding errors” notwithstanding), they need not be equal in the individual regions because of importing and exporting activities. On the other hand, FAO data may not balance even at the world level for 1970 and 2000 because of the other “frictions” mentioned above and/or errors on my part in recording the data flows as I reconstructed some of the “discontinued” regions.