Open Journal of Civil Engineering
Vol. 3 No. 2A (2013) , Article ID: 33216 , 15 pages DOI:10.4236/ojce.2013.32A007
Mechanical Properties of Cement Mortar Containing Fine-Grained Fraction of Fly Ashes
Department of Building Materials Technology, Faculty of Materials Science & Ceramics, AGH University of Science and Technology, Krakow, Poland
Email: tkaczews@agh.edu.pl
Copyright © 2013 Ewelina Tkaczewska. This is an open access article distributed under the Creative Commons Attribution License, which permits unrestricted use, distribution, and reproduction in any medium, provided the original work is properly cited.
Received April 28, 2013; revised May 30, 2013; accepted June 6, 2013
Keywords: Hydration (A); Cement (D); Fly Ash (D); Finer Fraction (B)
ABSTRACT
This paper presents the effect of fly ash grain-size fractions on Portland-fly ash cement hydration and its properties. Siliceous fly ashes of size fraction of 0 - 16 and 16 - 32 µm, separated from initial fly ash samples from 1st, 2nd and 3rd hopper in ESP system, were analysed. Cement hydration was investigated by determination of hydration heat and content of Ca(OH)2 and C3S in cement samples. Water to cement ratio and initial setting time of cement pastes as well as compressive strength and microstructure of cement mortars were also analyzed. Results showed that the same amount of the same size ash fraction can give cement of lower or higher early strength and its lower or higher increase with time. Incorporation of 20 wt% of ash fraction of 0 - 16 µm can produce Portland-fly ash cement CEM II/A-V of strength class 42.5R (from 2nd hopper) or 52.5N (from 3rd hopper). Cement containing 40 wt% of ash fraction of 0 - 16 µm from 2nd and 3rd hopper can be classified as pozzolanic cements CEM IV/A-V of strength class 42.5 and normal or rapid early strength, respectively. Different development of strength of cement with addition of the same size ash fraction separated from the initial ash sample from the next hopper in ESP system is connected with higher depolymerization degree of SiO4 units in ash glass, resulting from the greater amount of AlO4 units replacing SiO4 units. Ash fraction of 16 - 32 µm shows lower depolymerisation of glass network and as a consequence lower hydration degree of C3S to portlandite and calcium silicate hydrates (C-S-H).
1. Introduction
Siliceous fly ash, named as class F according to ASTM C618-12, has been used as component of blended Portland cement and as mineral additive in the concrete. Wide use of fly ashes in cement and concrete is determined by their pozzolanic activity, defined as ability to react with calcium hydroxide, a by-product of Portland cement hydration process, to form additional calcium silicate hydrates (C-S-H) and other cementitious compounds, that is, calcium aluminate hydrates (C2AH8 and C4AH13) and calcium aluminosilicate hydrates (C2ASH8 and C3AS3-C3AH) [1]. Scientific literature shows that rate of pozzolanic reaction is attributed to many factors such as particle size distribution, specific surface area, chemical and mineral composition of the fly ashes [2-7], which should be taken into account for predicting contribution of these materials in cement. Work [8] shows that fineness of ashes is more important factor and gives much effect on pozzolanic properties of them. Finer fly ashes reveal greater amount of glassy component than their coarse fractions, which result from higher amount of grains below 45 μm, especially below 10 µm [1-4]. Ash fraction of 0 - 45 μm is characterized by the greatest amount of active components, that is, SiO2 and Al2O3, whoes total content is approximately 15% - 20% according to ASTM C379-65T. The coarse ash fraction lowers content of active silica and aluminum oxide in it, which generally does not exceed 10% in case of fraction above 100 μm. Works [4,8-10] presented that fly ashes separated from different hoppers, attached to an electrostatic precipitator system after coal combustion, have variable physical and chemical properties. Ashes collected from 3rd hopper have improved fineness and particle size distribution in form of a normal distribution curve. Also, they show lower amount of SiO2, but greater amount of Al2O3 and alkalies (Na2O and K2O) [2,6,7]. Consequence of that is increase in content of active chemical components in ash from 3rd hopper, especially the largest increase is observed for active Al2O3 [4]. According to Tkaczewska [2], summarized amount of active chemical components in ash of 0 - 16 µm is higher than that in traditional siliceous fly ashes and difference could be as much as 1.5 times. Of course, this is due to greater fineness fly ash of 0 - 16 µm, but also can be resulted from different chemical composition and structure of glassy component. Glass former oxides in siliceous fly ash, independent on their fineness, are SiO2 and Al2O3. Glass network is mostly composed of SiO4 tetrahedra and each is linked with bridging oxygens Si-O-Si. The Al ions also occupy middle of some of tetrahedra. Negative charge created by substitution of AlO4 tetrahedra for SiO4 units is balanced by exchangeable cations, for example Na+ and K+. Consequence of that is increase in depolymerization of Si-OSi network [11]. Works [2,9,12] indicate that the same fly ash fraction, but selected from 3rd hopper, reveals higher depolymerization degree of glass as a result of higher content of Na and K ions in it [13]. In conclusion, ash of 0 - 16 μm from 3rd hopper reveales the highest pozzolanic activity, resulting not only from great fineness of it, but also from the highest depolymerization degree of SiO4 tetrahedra in glass network [14,15]. Due to amphoteric properties, the Al ions in glass structure can be both as network formers (coordination 4) and as network modifiers (coordination 6). According to Bumrongjaroen et al. [13], function of aluminum ions in glass depends on its chemical composition, in particular, on value of aluminum saturation index (parameter ASI), defined as the charge ratio of Al2O3/(Na2O + K2O + 2CaO). In glass with ASI value less than 1, the Al ion is only network former (AlO4 units). However, amount of tetrahedral Al ions in fly ash glass is limited by content of Na and K ions [16,17]. Results [7] indicate that in glass with ASI value greater than 1, the Al ion is network former and network modifier (AlO6 units). Increase in content of active Al2O3 in fine grains of ashes is directly connected with greater amount of AlO4 units in their glass structure, which in turn results in greater amount of alkali metal ions [12]. It can be assumed that if ashes contain much more Al2O3 in relative to content of Na2O and K2O, the residual Al ions can be acting in the form of AlO6 octahedra. Results [15] indicate that pozzolanic activity of siliceous fly ashes increases with content of AlO6 units in glass structure (octahedral Al ions easily go into solution than tetrahedral Al ions).
Introduction of fly ashes to cement modifies its hydration process and its properties, that is, setting time and compressive strength. It is known that siliceous fly ashes are inert addition not showing hydraulic properties as cementitious materials. Introduction of ashes to cement reduces content of Portland clinker in mixture and consequently reduces amount of alite (C3S) (dilution effect). Cement containing fly ashes has lower hydraulic activity in comparison to that of Portland cement, that is, hydration process of fly ash cement is a relatively slower. Lower heat evolution rate of fly ash-Portland clinker mixture is confirmed by longer induction period and lower intensity of main peak on microcalorimetric curve [1,3-6,18-22]. Fly ashes delay initial and final setting times of cement pastes [1,23,24] and decrease early strength of cement mortars, mainly due to dilution effect as well as slower rate of pozzolanic reaction at initial stage, to about 28 days. With time of hydration, after about several weeks, progress of pozzolanic reaction is significant, what improves properties of fly ash cement, especially its compressive strength, which is comparable to or even higher than that of Portland cement [1,20,25]. Formation of hydration product and, consequently, development of hardened matrix in cementitious system with ashes is generally slower than in reference paste, but after 90 or 180 days microstructure of fly ash cement shows better compactness due to presence of higher content of C-S-H, both from hydration of Portland cement and from pozzolanic reaction. As a result, content of Ca(OH)2 is reduced, although hydration process of fly ash cement is still progressing [24]. Of course, the greater reduction in Ca(OH)2 content the greater increase in C3S hydration degree in cement [23]. Results [9,18,21] show that cement containing fine-grained fly ashes, especially fraction below 45 μm of them, reveals much better mechanical properties in comparison to those of cement containing unsorted ashes. Ash fraction less than 20 μm is the most desirable from point of view of application as cement component. Addition of 20 wt% of ash fraction of 0 - 20 μm can give cement of strength class 42.5R or even strength class 52.5N [2,21].
2. Materials and Testing Procedures
2.1. Characterization of Raw Materials
Fly ashes used in experiment were from the bituminous coal-fired power plant in Poland. Fly ash samples were collected from three different hoppers attached to electrostatic precipitator (ESP) system after coal combustion. Ashes generated from 1st hopper, situated closest to the inlet, are named as F1 sample. Ashes collected from 2nd hopper are named as F2 sample, whereas ashes from 3rd hopper located at outlet are named as F3 sample. Fly ash samples were separated in two particle size fractions in range of 0 - 15 μm (fraction A) and 15 - 30 μm (fraction B). These fly ashes are not typically used in cement production, but they show very good pozzolanic properties, resulting from their finer grain-size distribution [4,18].
Particle size distributions of ashes, measured using a Malvern Mastersizer 2000 laser diffraction particle size analyzer (Malvern Instruments Ltd., Malvern, UK), are shown in Figure 1. Table 1 shows volume content of selected particle size fraction of fly ashes and their

Figure 1. Particle size distribution curves of fly ashes of F1, F2 and F3.
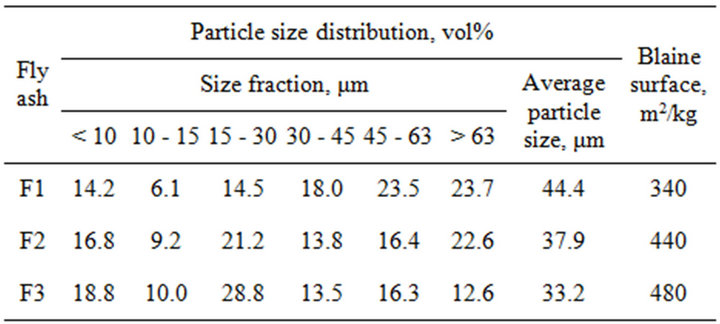
Table 1. Particle size distribution and Blaine surface area of fly ashes F1, F2 and F3.
Blaine surface area. As it is shown, the 52.8, 61.0 and 71.1 vol% of ash particles that were obtained respectively in 1st, 2nd and 3rd hopper are passing through a 45 μm mesh sieve by wet sieving in accordance with Polish Standard PN-EN 451-2:1998. This means that F2 and F3 are classified as fly ashes of fineness Category N according to Polish Standard PN-EN 450-1:2012. It can be noticed that maximum particle size of ashes becomes smaller and range of their particle size distribution gets narrower, as distance from boiler increases (Figure 1). The F1 ash gives particle size distribution curve with two maximum frequency diameters, at 5 and 45 μm, whereas the F3 ash shows a normal particle size distribution. Blaine surface of ashes increases from 1st hopper towards 3rd one, with a value of more than 480 m2/kg for F3 ash.
Table 2 shows chemical composition of fly ashes. Main compounds of ashes are SiO2, Al2O3 and Fe2O3, which summarized content is over 85 wt%, so meets requires minimum of 75 wt%. Loss on ignition content is much lower than 5 wt%, so these ashes can be classified as Category A according to Polish Standard PN-EN 450- 1:2012. The F3 ash shows lower silica content and higher aluminum content than F1 ash and difference is respectively 9.7% and 13.4%. Total amount of Na2O and K2O is changed from the 3.3 wt% (F1 ash) to 4.7 wt% (F3 ash). Significant increase in content of alkalies, by 42% for F3, may suggest a change in chemical composition and structure of glassy phase. Consequence of that may be grater pozzolanic activity of F3 due to presence in its glass structure not only units of SiO4 and AlO4, but also units of AlO6 [13]. The SO3 content is comparable for all ashes.
The X-ray patterns of ashes, carried out using Philips X’Pert Pro MD diffractometer, are presented in Figure 2. Glassy and two crystalline phases—quartz b and mullite —are presented in ashes. Intensity of crystalline phases, expressed as counts per second, changes from 1st hopper towards 3rd one. Intensity of quartz line (at 2q = 26.5˚) decreases from 128 to 70 cps, whereas intensity of mullite peak (at 2q = 26.5˚) changes from 31 to 16 cps. Finer ashes have more glass, which is confirmed by an increase in board diffraction effect in range of 18˚ - 28˚ 2q.
Table 3 shows Blaine surface area and chemical composition of fractions of 0 - 16 and 16 - 32 μm of F1, F2 and F3 ashes. Blaine surface area of ash of 0 - 16 µm is generally two times higher than that of 16 - 32 µm, what is primarily associated with greater amount of grains below 10 µm in ashes of 0 - 16 µm or with presence of dehydrated clay minerals fromcoal gangue (with a highly developed surface area). The same ash fraction, but separated from initial ash sample from 3rd hopper, is characterized by much higher content of alkalies, whereas content of SiO2 and Al2O3 varies slightly. For F3-A and F3-B content of alkalies increases by up to
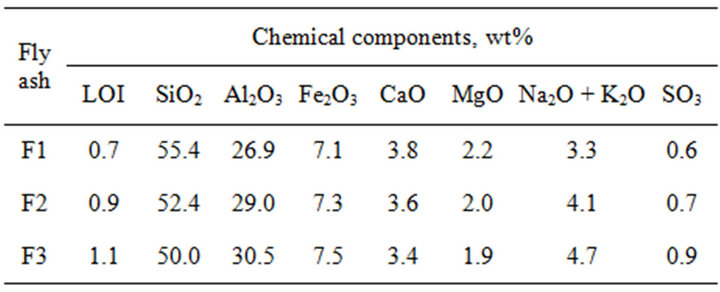
Table 2. Chemical composition of fly ashes F1, F2 and F3.
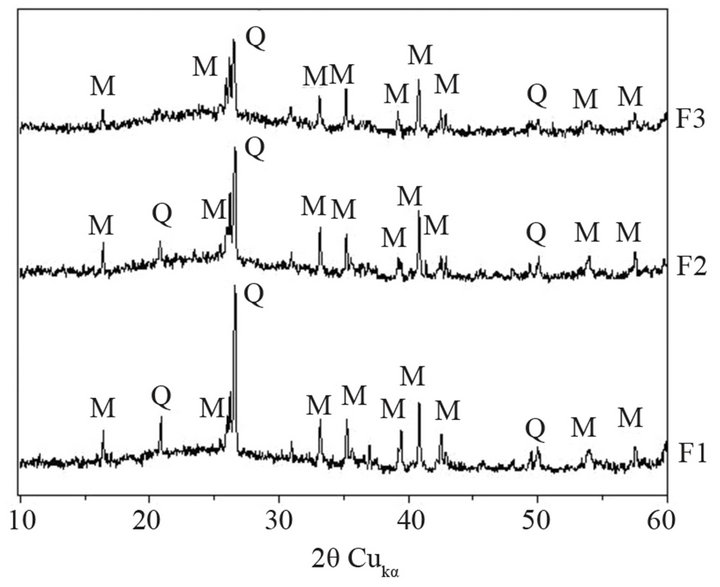
Figure 2. XRD patterns of fly ashes F1, F2 and F3 (Q— quartz b, M—mullite).

Table 3. Chemical composition of selected fractions of fly ashes F1, F2 and F3.
34%, but content of SiO2 is 5% lower and content of Al2O3 is 3% higher. Amount of other chemical components is comparable.
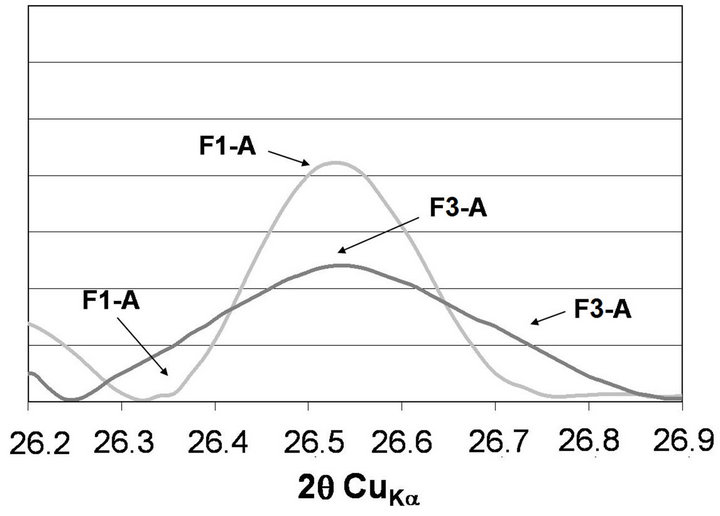
The XRD patterns of fractions of 0 - 16 and 16 - 32 µm of ashes are presented in Figure 3. The F3-A and F3- B show the lowest intensity of quartz b peak, what confirms the lowest content of it. Change in intensity of quartz line, expressed as its area, is presented in Figure 4. For F3-A ash, intensity of quartz peak is by 11% lower than that for F1-A. For F3-B, increase in intensity of quartz line is 17% in comparison to the F1-B ash.
Decrease of quartz line means a decrease of its crystals’ sizes in ash (Figure 5). With a decrease of quartz peak intensity, a broad diffraction effect, observed in range 18˚ - 28˚ 2q, also increases, which can be attributed to increase in amount of glass in ash. The highest broad diffraction effect area is observed in case of F3-A, whereas the lowest one is found for F1-B (Figure 6). Differences in alkalies content as well as in proportions between crystalline and amorphous SiO2 are supposed to change fly ash glass structure.
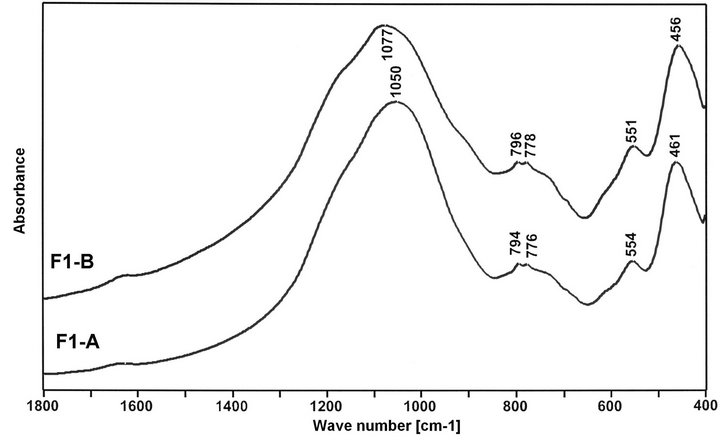
Mid-Infrared (MIR) spectroscopic measurements of the selected fractions of fly ashes were made with a BioRad FTS 60V spectrometer MIR. Spectra were collected after 256 scans at 4 cm−1 resolution. As we know, on MIR spectra of vitreous glass (v-SiO2), there are three absorption bands: at 1100 cm−1—associated with asymmetric stretching vibration of Si-O-Si, in 800 - 600 cm−1 region—due to symmetric stretching vibrations of Si-OSi and at 460 cm−1—corresponding to bending vibrations of Si-O-Si [26]. In contrast to vitreous SiO2, on MIR spectra of ashes (Figure 7) the same groups of absorption bands are appearing. However, main band is located at lower waves number, what confirms presence of AlO4 units replacing SiO4 units in fly ahs glass structure [15,27]. Finer fly ash fraction give greater shift of Si-O-Si asymmetric stretching band, due to presence of then higher number of Al-O-Si bonds in it. Moreover, position of Si-O-Si band is changed with position of hopper in ESP system. The same fraction of ash, but separated from next hopper, gives the Si-O-Si band at
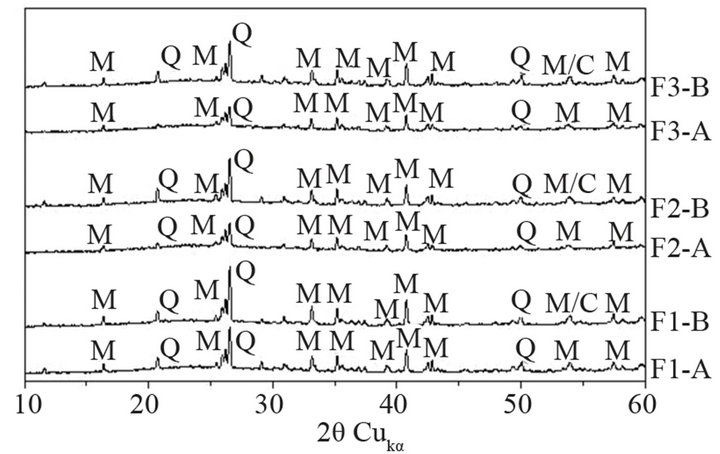
Figure 3. XRD patterns of selected fractions of fly ashes F1, F2 and F3 (Q—quartz b, M—mullite).

Figure 4. Intensity of quartz b peak on the XRD patterns of selected fractions of fly ashes F1 and F3.
different wavenumbers, which at comparable amount of Al2O3, should be associated with varying amount of AlO6 units in ashes. For the F1-A and F3-A, position of Si-OSi band is respectively at 1050 cm−1 and 1067 cm−1. It suggests that there are less AlO4 tetrahedra and more AlO6 octahedra in F3-A. For the F1-B and F3-B, position of Si-O-Si band is varied from 1077 cm−1 to 1069 cm−1, meaning lower amount of tetrahedral Al ions than respectively in F1-A and F3-A, especially in F1-B ash. Maximum at 730 cm−1 is linked with symmetric vibration of Si-O-Al. Doublet of bands at 780 - 800 cm−1 indicates presence of quartz β in ashes. Maximum at 550 cm−1 is linked with existing of AlO6 unites in ashes [28,29]. Band at 465 cm−1 corresponds to bending vibrations of Si-O-Si.
 (a)
(a)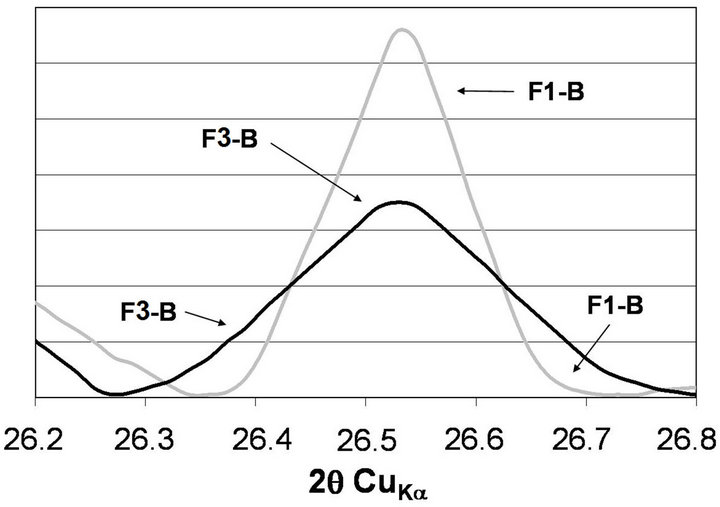 (b)
(b)
Figure 5. Quartz b peak on the XRD patterns of selected fractions of fly ashes F1 and F3.
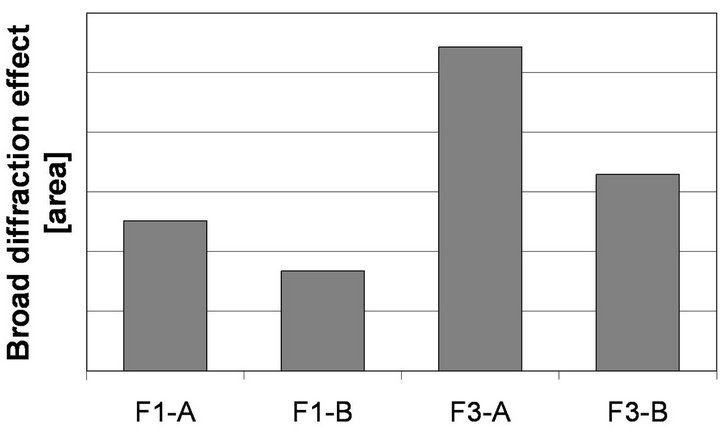
Figure 6. Broad diffraction effect area (18˚ - 28˚ 2θ) on the XRD patterns of selected fractions of fly ashes F1 and F3.
In order to precisely determine coordination of aluminium ions in fly ash samples, the 27Al MAS-NMR studies were performed. In the 27Al spectra of all ashes, one main band at about 60 ppm is presented (Figure 8). This band is linked with the Al ions in tetrahedral coordination, which play a role of glass forming ions [30]. For the same ash fraction, intensity of band at 60 ppm is varied, confirming different contents of tetrahedral aluminum ions forming Al-O-Si bonds in ash. The F3-A reveals the highest intensity of this band, what can indicate the highest content of AlO4 units in it, while the least intensity of this band is indicated for F1-B. In the 27Al MAS-NMR spectra of all ashes, a small peak at 0 ppm is also observed, suggesting presence of octahedral Al ions in them. Coarse ash samples give a more intense band at 0 ppm. The most AlO6 units are found in F3B. As it is known, in siliceous fly ashes, the AlO4 and AlO6 units coexist in structure of glass and mullite. Because of analyzed fly ashes are characterized by comparable amount of Al2O3,
 (a)
(a)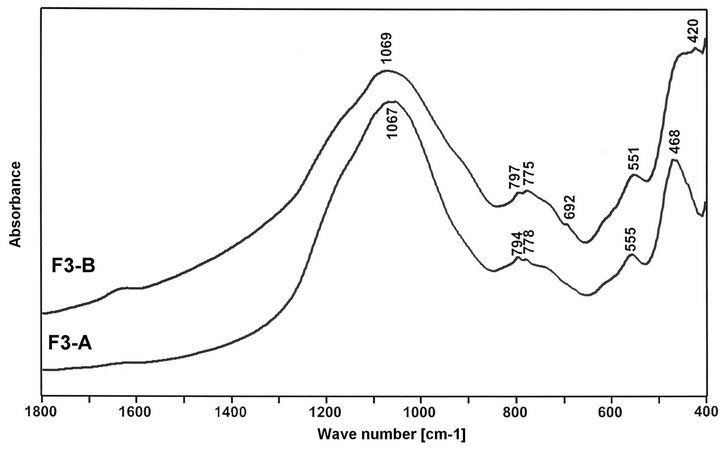 (b)
(b)
Figure 7. MIR spectra of selected fractions of fly ashes F1 and F3.
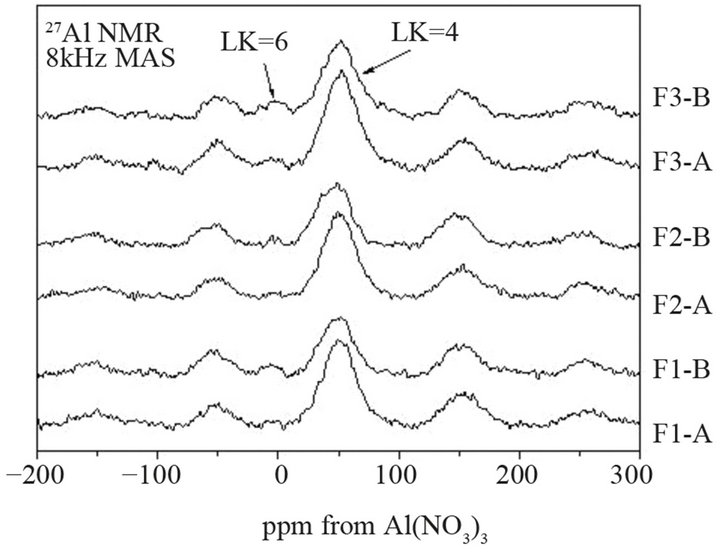
Figure 8. 27Al MAS-NMR spectra of selected fractions of fly ashes F1, F2 and F3.
more glassy component and simultaneously less mullite in ashes from 3rd hopper, confirmed by XRD measurements, may be related to increase in octahedral Al-O bonds in fly ash glass structure.
Increase in content of AlO4 tetrahedra in fly ash glass causes an increase in depolymerization degree of SiO4 tetrahedra, what is confirmed by analysis of the 29Si MAS-NMR spectra of ashes (Figure 9). In the 29Si spectra of ashes, high intensity band, observed in region from
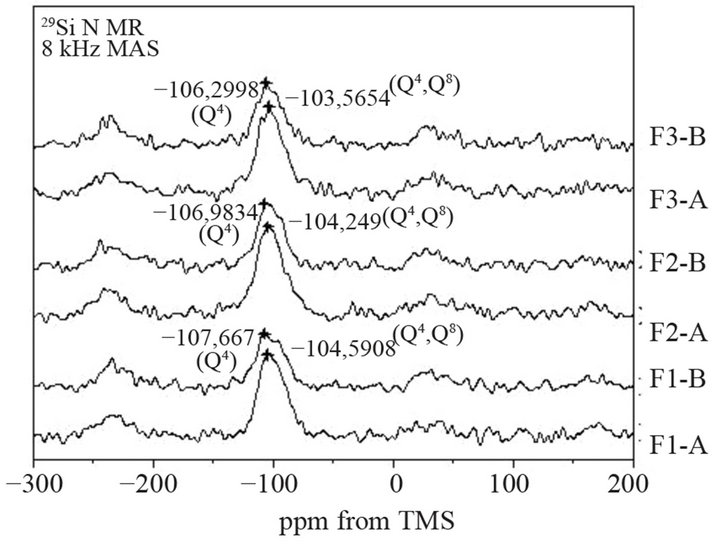
Figure 9. 29Si MAS-NMR spectra of selected fractions of fly ashes F1, F2 and F3.
−108 to −103 ppm, indicates presence of elements of three-dimensional glass network (Q4 structure) and bridging tetrahedra in silicate ribbon (Q3 structure). For F3-A and F3B, this band is shifted to higher value of ppm than for F1-A and F1-B, respectively. It means that finer fraction of ash has lower polymerization degree of SiO4 units in glass. It can be explained greater amount of Na+ and K+ ions, which compensate negative charge created by substitution of AlO4 in place of SiO4 units in glass. Because of ionic radius of cations of Na+ and K+ is large, bridging oxygen are breaking and consequently bands of types Si-O-Na or Si-O-K are forming. The highest depolymerization degree of SiO4 in glass is found in F3-A ash.
Table 4 shows pozzolanic properties of selected fractions of ashes in accordance with American Standard ASTM C379-65T. The same ash fraction, but with higher depolymerization degree of SiO4 anions in glass, reveals better pozzolanic reactivity. The best higher total content of active components is presented by F3-A and drop of content of them is 40% in comparison to that in F1-A. The same phenomena are also observed for ashes of F1-B and F3-B. Note, however, the best pozzolanic properties of fly ashes from 3rd hopper is determined mainly by greater content of particles of diameter below 10 μm and further enhanced by higher activity of fly ash glassy phase.
2.2. Preparation of Test Specimens
In this work, ordinary Portland cement CEM I 42.5R according to Polish Standard PN-EN 197-1:2002 was used as control specimen prepared by milling of Portland cement clinker with 5 wt% of natural gypsum (SO3 of 41.7 wt%) to Blaine surface area of 350 m2/kg. Table 5 shows chemical and mineral composition (according to Bogue calculation) of Portland cement clinker. It can be supposed that high content of C3S (alite), which is the most reactive cement mineral will have greatly influence

Table 4. Pozzolanic activity of selected fractions of fly ashes F1, F2, and F3 according to ASTM C379-65T.
on compressive strength of cement mortar. It will provide rapid increase in initial strength and gradual increase in strength with time.
Laboratory fly ash cements were obtained by mixing reference Portland cement (named as OPC) with selected grain-size fractions of 0 - 16 and 16 - 32 μm of fly ashes of F1, F2 and F3 in replacement ranges of 20 and 40 wt%. Table 6 shows cement mixture proportions used in experiment.
2.3. Experimental Methods
Cement hydration was investigated by examination of hydration heat, content of Ca(OH)2 and hydration degree of C3S. Hydration heat of cement was determined by calorimetric measurements, using a microcalorimeter BMR (differential microcalorimeter, Institute of Physical Chemistry, Polish Academy of Science). Samples were hydrated in calorimeter at temperature of 25˚C. The Ca(OH)2 content was calculated based on results of DTA/TG analysis performed on a MOM-OD 102 Paulik Erday Thermoanalyser (temperature up to 1000˚C in an air atmosphere, with a heating rate of 10˚C/min). Hydration degree of C3S was measured by XRD method.
Properties of cements were characterized by determination of setting times according to Polish Standard PNEN 196-3:2006 and compressive strength by method in Polish Standard PN-EN 196-1:2006. Microstructure was observed by FEI’s Nova200 Nano Scanning Electron Microscope (SEM) equipped with energy dispersive spectrometer (EDS). Pore size distribution was evaluated by mercury intrusion porosimetry (MIP), using a mercury porosimeter Serie 2000 Carlo Erba Strumentazione. Pressure range was 0.1 - 200 MPa, which corresponded to equilibrium penetration into pores of Kelvin radius 7.5 - 0.00375 µm.
3. Results and Discussion
3.1. Calorimetric Measurements
Sets of calorimetric curves of cements, where w(t) is the

Table 5. Chemical and mineral composition of Portland cement clinker.
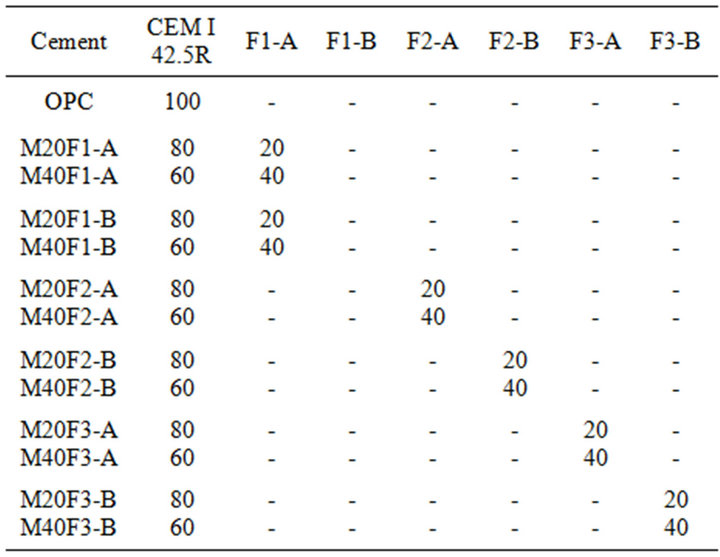
Table 6. Mixture proportions (wt%).
thermal power, that is, heat evolved per time unit, are shown in Figures 10-12.
Cement containing the same ash fraction, but from 3rd hopper, gives a shorter induction period for alite hydration. Induction period of M20F1-A is up to 1 h longer than that of OPC, while in case of M20F2-A and M20F3- A induction period is shortened up to 2 h and 3 h, respectively, although these are fairly inert materials at these very early stages. The most active ash fraction of 0 - 16 µm, especially F3-A, provide additional surfaces for precipitation of hydration products which are typically formed on surfaces of C3S. In case of addition of the same amount of coarse ash fraction, that is, 16 - 32 µm, dormant period lengthens or remains unchanged. For F1-B, cement hydration is the most delayed, as a very little amount of calcium ions is released to solution, increasing time when supersaturated state can be reached. Induction period of M20F1-B lengthens up to 2 h in comparison to that of OPC. Initiation of pozzolanic reaction in case of M20F1-B cement takes place after initiation of cement hydration, and later than that found for other Portland-fly ash cements. Of course, at the end of dormant period, cement hydration process is accelerated. The M20F3-A begins its acceleration period at 3.5 h and ends at 8 h, but hydration of M20F1-B is accelerated at 9.5 h and ends not before at 14 h.
Table 7 shows hydration heat evolved values of cements. Hydration heat is proportionally lowered with content of OPC in samples. Drop of hydration heat during initial stages is attributed to substitution of Portland

Figure 10. Calorimetric curves of cements with selected fractions of fly ash F1.
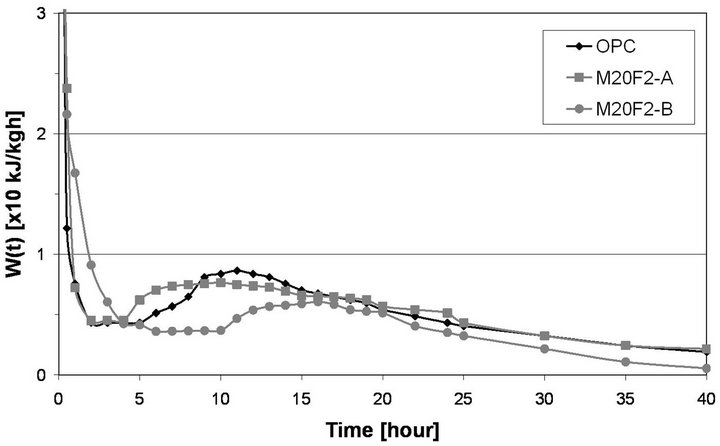
Figure 11. Calorimetric curves of cements with selected fraction of fly ash F2.
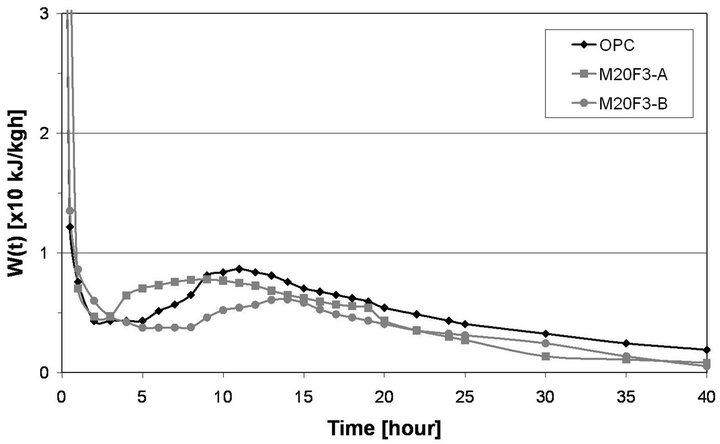
Figure 12. Calorimetric curves of cements with selected fraction of fly ash F3.
cement by fly ashes and consequently decrease in C3S content. At 24 h hydration heat of M20F3-A is 4% lower than that of OPC, while in case of M20F1-B difference is up to 34%. With time, amount of hydration heat is in-
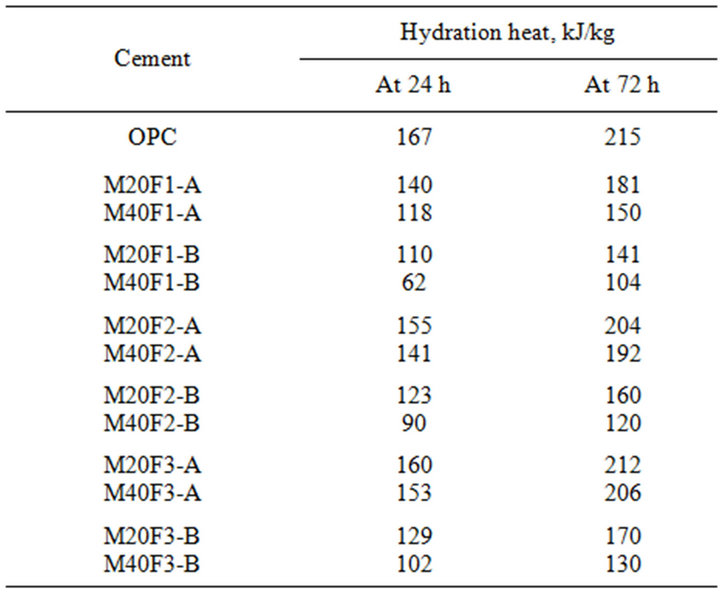
Table 7. Hydration heat of cements with selected fractions of fly ashes F1, F2 and F3.
creased. At 72 h heat evolved by M20F3-A is comparable with that of OPC, whereas heat evolved by M20F1-B exhibits a 30% decrease. Shortening of induction period and increase in hydration heat of cement with the same amount of the same ash fraction, but selected from initial ash sample from 3rd hopper, is connected with better pozzolanic properties determined by different chemical composition and structure of glass. Increase in volume of ashes decreases initial hydration of cement. The highest retardation of hydration is observed for M40F1-B. At 24 h and 72 h heat evolved for M40F1-B is much lower in comparison to that of OPC and differences reach about 62% and 52%, respectively. This very significant reducetion in amount and rate of hydration heat of M40F1-B may be interpreted by low C3S content in this fly ash cement as well as by very low pozzolanic reactivity of F1-B ash, the lowest among all the ashes.
3.2. DTA/TG Analysis
Thermal analysis (DTA/TG) was used to estimate Ca(OH)2 content in the hardened cement pastes. The Ca(OH)2 content was determined based on mass loss (TG curve) in range of calcium hydroxide decomposition at about 450˚C - 550˚C.
Table 8 shows that content of Ca(OH)2 in fly ash cements decreases in comparison to that in OPC, which is a consequence of reducing content of calcium silicates (C3S and C2S) in them. It can be seen that up to 28 days the portlandite content in fly ash cements increases, what may suggests delaying pozzolanic reaction. Because of coarse ash fractions reveal weaker ability of pozzolanic reaction with calcium hydroxide, cements with addition of ash fraction of 16 - 32 µm are characterized by higher Ca(OH)2 content. At 2 days decreases in Ca(OH)2 content in M20F1-A, M20F2-A and M20F3-A is respectively 33%, 39% and 47%, whereas in M20F1-B, M20F3-B and M20F3-B—respectively 21%, 25% and 28%. With time, decrease in Ca(OH)2 content in fly ash cements becomes higher relative to that of OPC as a result of the pozzolanic reactions occurring. The Ca(OH)2 content in M20F1-A and M20F3A starts to decrease at 28 days, but in M20F1-B not before 90 days. At 180 days the M20F3-A has three times less Ca(OH)2, while in case of M20F1-B drop of Ca(OH)2 content is only about 1.5 times. With increase in amount of fly ashes in binder portlandite content is decreased.
As mentioned, reduction in amount of Ca(OH)2 in fly ash cement is partly due to “dilution” of Portland cement clinker in binder, but also a consequence of pozzolanic reaction occurring. Table 9 shows calculated content of portlandite consumed in pozzolanic reaction by reactive silica and aluminum oxides of fly ashes.
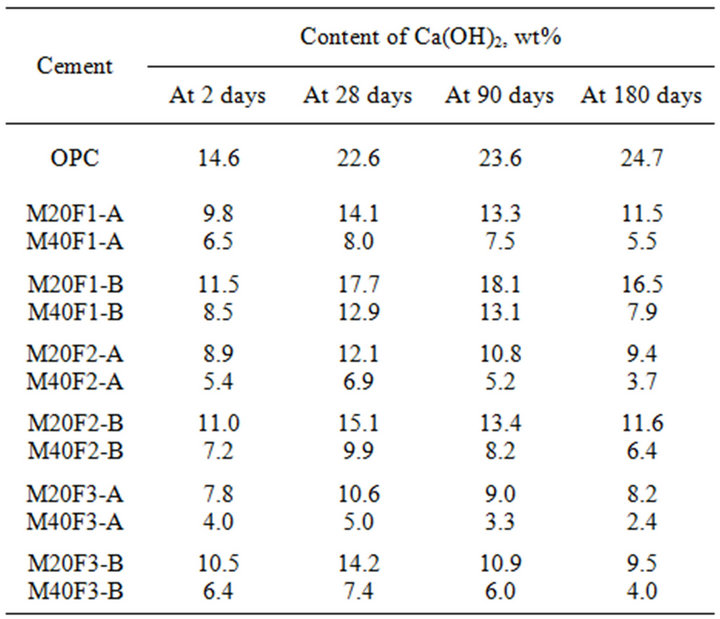
Table 8. Content of Ca(OH)2 during hydration of the cements with selected fractions of fly ashes F1, F2 and F3.
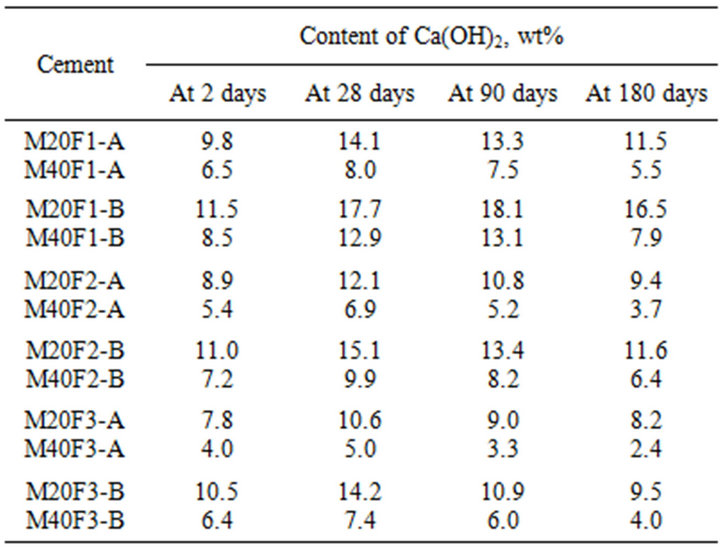
Table 9. Amount of Ca(OH)2 consumed during pozzolanic reaction of selected fractions of fly ashes F1, F2 and F3.
Content of Ca(OH)2 involved in pozzolanic reaction is difference between content of it in OPC and fly ash cement. Results indicate that the finer ash fraction the greater consumption of Ca(OH)2. As might be expected, the highest ability of reaction with calcium hydroxide is shown by fractions of F3 ash. For M40F3-A amount of Ca(OH)2 consumed is 4.9% at 2 days and 12.4% at 180 days, whereas for M40F1-B—is respectively 0.3% and 6.9%. Variable amount of Ca(OH)2 relating to pozzolanic reaction in cement with the same amount of the same ash fraction confirms influence of glass properties on reactivity of ashes. In ash of high depolymerization degree of SiO4 units in glass the ions of Si4+ and Al3+ have ability to pass from glass to liquid phase of cement paste. In solution, the Si4+ and Al3+ ions react with Ca2+ ions to form additional calcium silicate hydrates and other cementitious compounds, that is, calcium aluminate and calcium aluminosilicate hydrates, on surface of ash particles and in spaces between grains of cement and ashes.
3.3. X-Ray Diffraction Analysis
The XRD analysis allowed to estimate hydration degree of cement on the basic of content of unreacted C3S. The XRD patterns of cement are shown in Figures 13-17.
Qualitative results of XRD studies show that cement with ashes gives lower intensity of C3S peak at 34.4˚ 2q (dhkl = 0.2604 nm), what confirms higher hydration degree of alite. As we know, due to pozzolanic reaction amount of Ca(OH)2 in decreased with time of cement
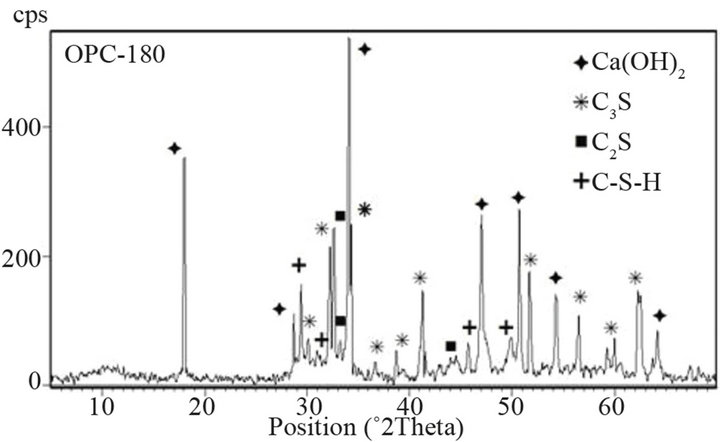

Figure 13. XRD patterns of OPC at 28 and 180 days.
hydration, which in turn requires increase in conversion of C3S. Table 10 shows intensity of C3S peak on XRD patterns of cements. It is clear that intensity of C3S line for blended cements is lower than for OPC. At 28 days drop in intensity of C3S peak increases by 20%, 36% and
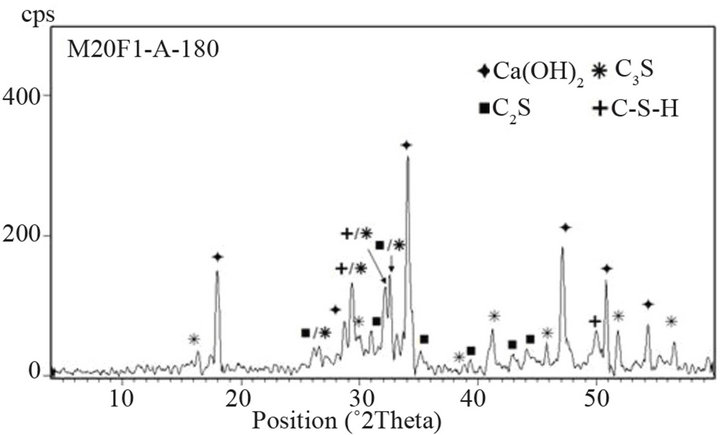
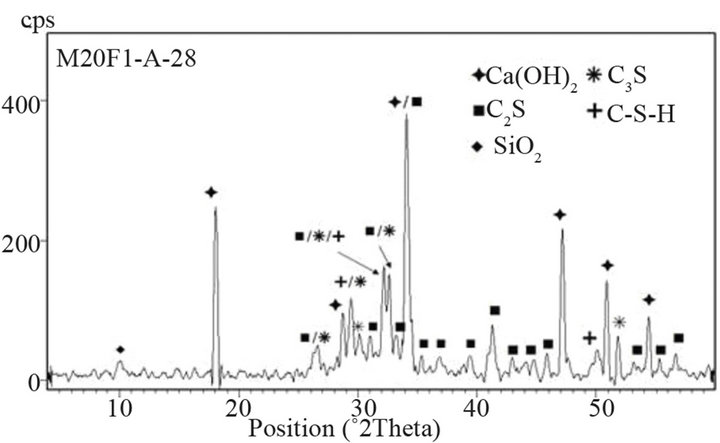
Figure 14. XRD patterns of M20F1-A at 28 and 180 days.

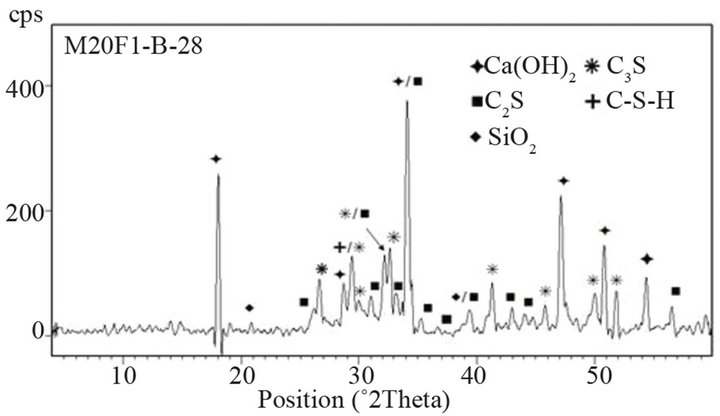
Figure 15. XRD patterns of M20F1-B at 28 and 180 days.
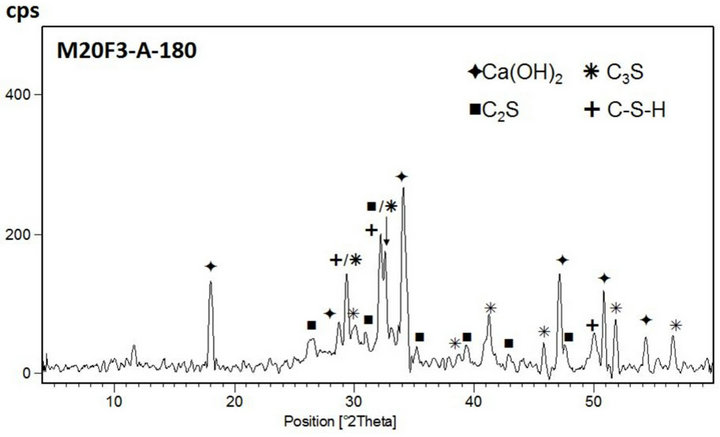
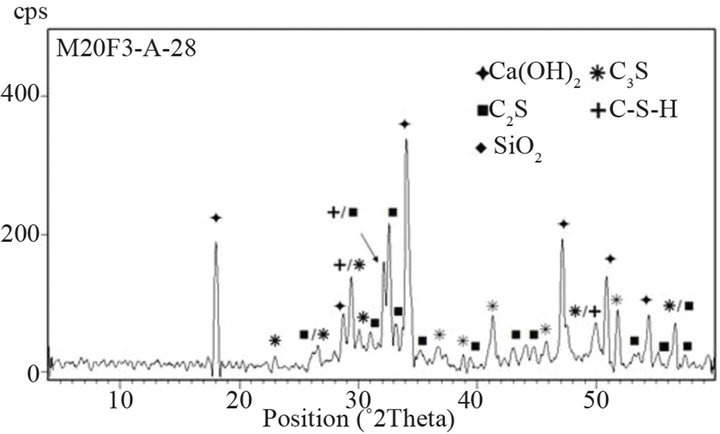
Figure 16. XRD patterns of M20F3-A at 28 and 180 days.

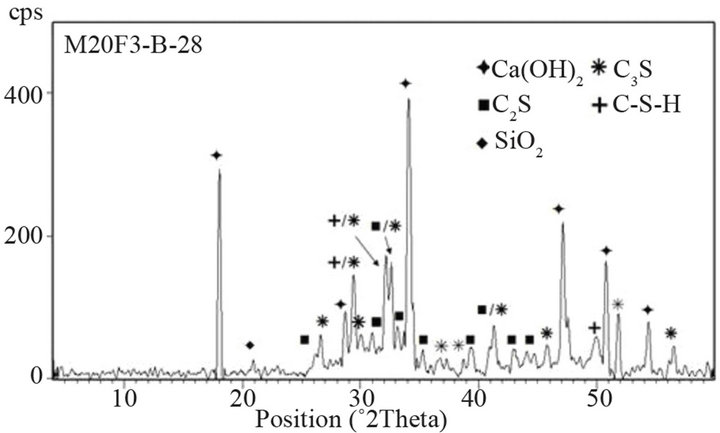
Figure 17. XRD patterns of M20F3-A at 28 and 180 days.
44% respectively for M20F1-A, M20F2-A and M20F3-A. For M20F1-B, M20F2-B and M20F3-B, differences are smaller and are 12%, 26% and 33%, respectively. With time, increase in hydration degree of alite in fly ash cement becomes significant higher than that in OPC, which
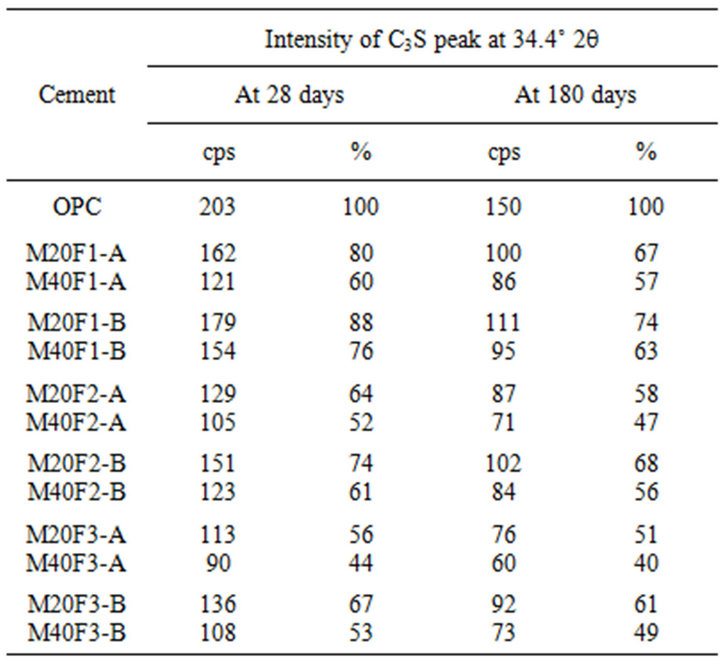
Table 10. Intensity of C3S peak at 34.4˚ 2q on the XRD patterns of cements with selected fractions of fly ashes F1, F2 and F3.
is related to increasing intensity of pozzolanic reaction. In consequence, it leads to great reducing amount of portlandite and deficiency can be completed only by increase in degree of conversion of alite. At 180 days intensity of C3S line for M20F1-A, M20F2-A and M20F3- A is respectively 33%, 42% and 49%, while for M20F1- B, M20F2-B and M20F3-B—respectively 26%, 32% and 39%. The XRD analysis is consistent with DTA/TG measurements.
The lowest content of unreacted C3S is measured for cement with F3-A ash, due to very high pozzolanic reactivity of this ash, resulting from higher depolymerization degree of SiO4 anions in glass network. However, the lowest hydration degree of alite is presented by cement with the same amount of F1-B ash, because of glass phase of F1-B ash is characterized by the lowest reactiviity resulting directly from the lowest depolymerization degree of the SiO4 tetrahedra in glass (the lowest content of tetrahedral Al ions) as well as the lowest content of AlO6 units in glass network.
3.4. SEM/EDS Observations
The SEM/EDS observations of microstructure of M20F3- A cement after 180 days are presented in Figures 18-21. The F3-A ash is the most active material of all analysed fly ashes. In M20F3-A, the C-S-H of type II (so-called honeycomb structure) according to Diamond’s classification [31] are observed. It should be noted the C-A-S-H phases, that is, silica-rich hydrogarnets in fly ash cement at 180 days. The SEM observation confirms presence of C-S-H of type IV (dense areas) in M20F3-A. As we seen, introduction of ash of 0 - 16 µm from 3rd hopper gives
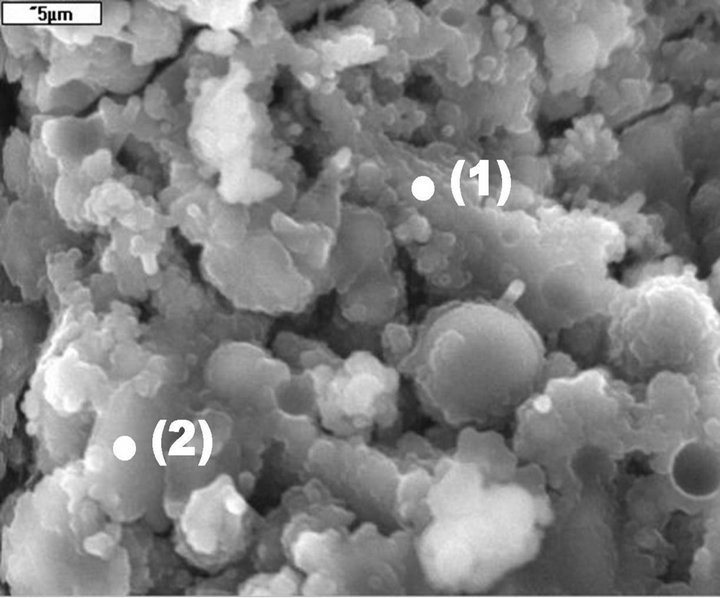
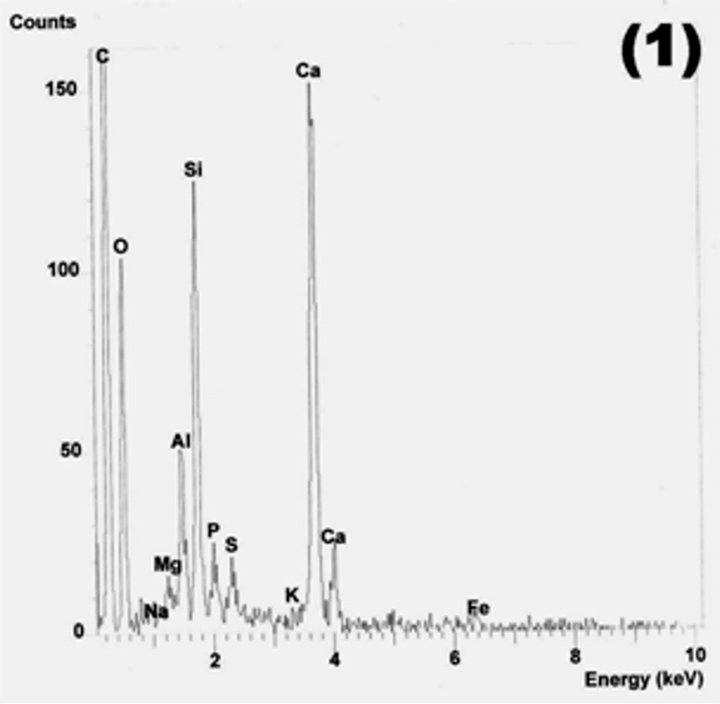
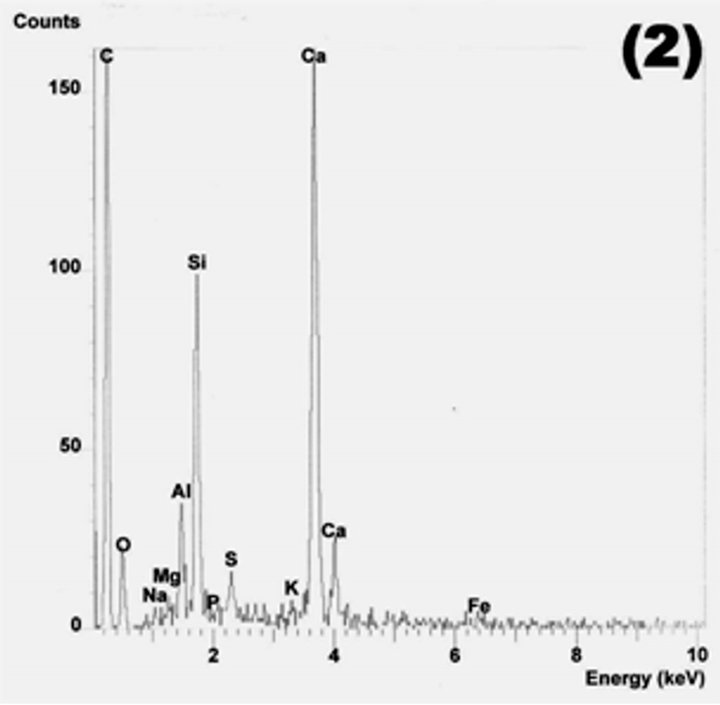
Figure 18. Diamond type II of C-S-H in M20F3-A at 180 days. SEM.

Figure 19. C-S-H gel (points 1 and 2) and reacted fly ash grains in M20F3-A at 180 days. SEM/EDS.
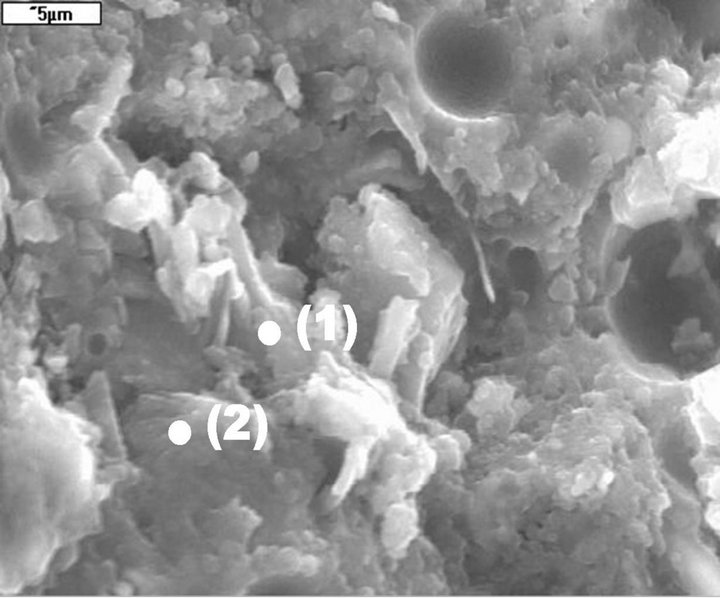

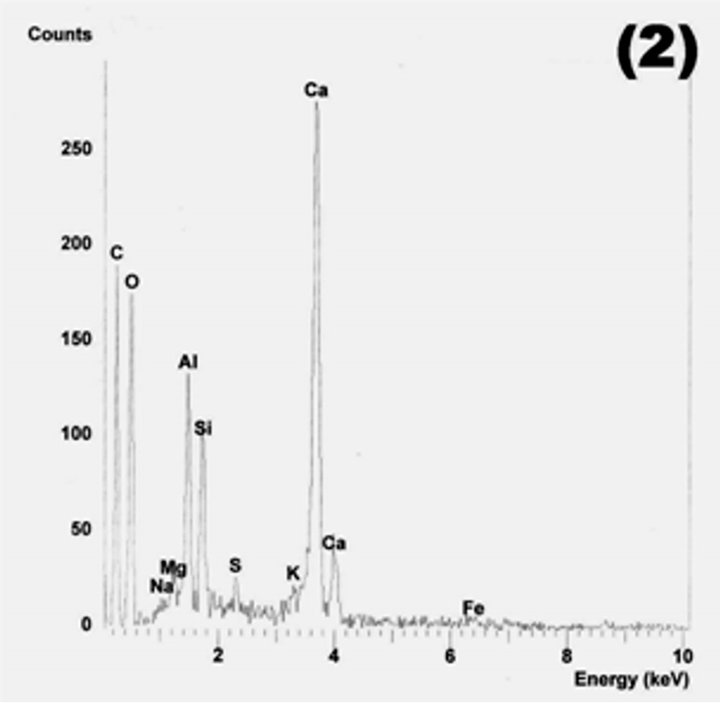
Figure 20. Diamond type IV of C-S-H in M20F3-A at 180 days. SEM.
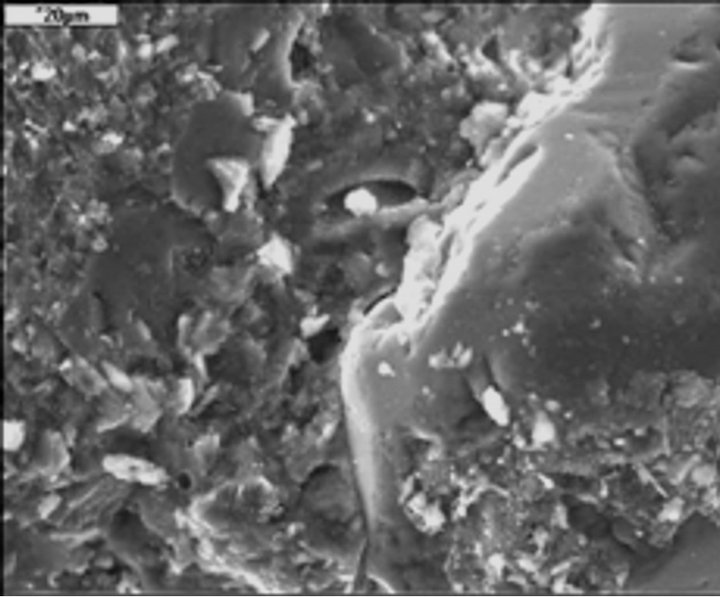
Figure 21. C-S-H gel (points 1 and 2) and reacted fly ash grains in M20F3-A at 180 days. SEM/EDS.
the additional amount of C-S-H from pozzolanic reaction with a lower C/S ratio than that of OPC.
3.5. MIP Analysis
Tables 11 and 12 show the MIP measurements of porosity in cement pastes at 28 and 180 days, respectively. Microstructure of fly ash cements containing finer ash fraction contains the smallest and most disconnected pores in comparison to that of OPC. Decrease in average pore diameter is a consequence of filling of cement matrix by finer grains of ashes as well as by additional amount of C-S-H gel from the pozzolanic reactions. Microstructure of cement containing fly ash fractions from 3rd hopper has the least porosity, because of improved pozzolanic properties of these ashes give them a superior ability to react with Ca(OH)2 to form the most hydration products.
At 28 days microporosity of cements is consisted mainly of capillary pores, especially capillaries of 10 nm to 100 nm. The MIP analysis indicates that in all fly ash cements, content of gel pores (below 10 nm) does not exceed 50 vol%. Content of gel pores in M20F1-A is less by 6% than that of OPC, while in case of M20F2-A and M20F3-A, increase in content of gel pores is respectively 8 and 15%. Ash of 16 - 32 µm gives much lower content of gel pores and drop in relative to OPC is 38%, 25% and 15% respectively for M20F1-B, M20F2-B and M20F3-B. At 28 days, content of macropores (above 1000 nm) in fly ash cements is less than 2 vol%. For M20F3-A, volume of macropores is ten times lower than that in OPC.
The 180-day microporosity of all blended cements is dominated by gel pores and volume of these pores is much higher than that in OPC. Content of gel pores in M20F1-A, M20F2-A and M20F3-A increases respectively by 32%, 57% and 73% in relative to that of OPC. For M20F1-B, M20F2-B and M20F3-B, decrease in content of gel pores is much lower, respectively by 16%, 33% and 45%. At 180 days, decrease in volume of macropores in M20F3-A is 2-fold.
Generally, MIP analysis shows that in cement containing equal amounts of the same ash fraction, but collected from 3rd hopper, total porosity of cement matrix is much lower, content of macropores decreases and content of gel pores increases, which results from higher pozzolanic activity of ashes determined different properties of glassy phase.
3.6. Testing of Setting Time
Table 13 shows results of setting time of cement pastes according to Polish Standard PN-EN 196-3:2006.
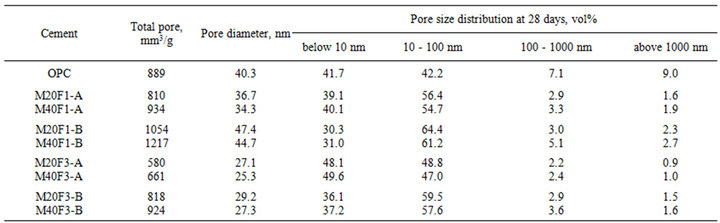
Table 11. Total mikroporosity of cements with selected fractions of fly ashes F1, F2 and F3 at 28 days.
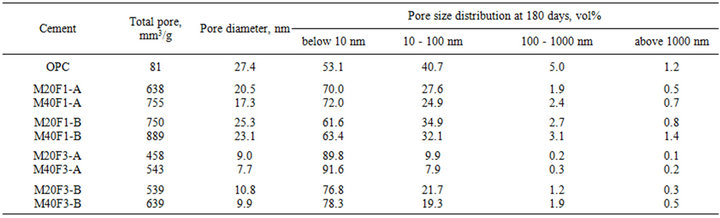
Table 12. Total mikroporosity of cements with selected fractions of fly ashes F1, F2 and F3 at 180 days.
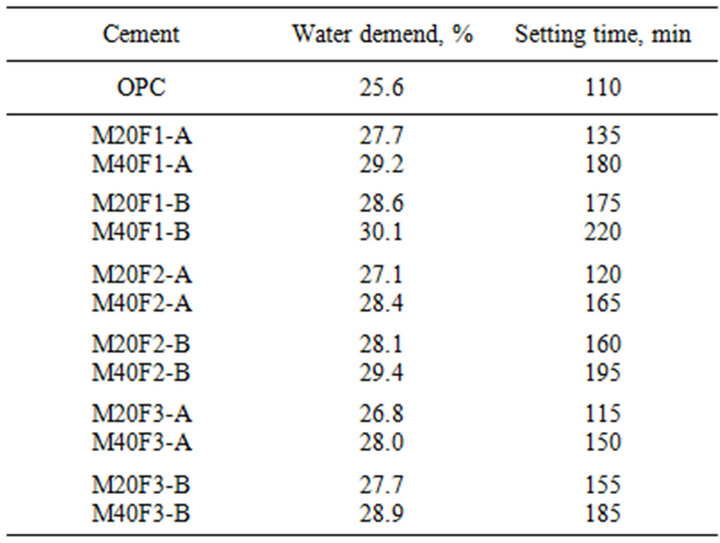
Table 13. Setting time of cements with selected fractions of fly ashes F1, F2 and F3.
Introduction of ashes to cement causes an increase in water requirement. Higher water consumption of fly ash cement is connected with porous nature of some particles in disposed fly ashes and consequently their high Blaine surface area. Water demand of M20F1-A, M20F2-A and M20F3-A are higher than that of OPC by 8%, 6% and 5%, respectively. Water demand of M20F1-B, M20F2-B and M20F3-B increases respectively by 12%, 10% and 8%. The higher content of ashes in cement the higher water demand.
Cements containing fly ash fractions from 2nd and 3rd hopper have comparable elongations of setting time, much less than that of cements with the same amount of the same ash fraction from 1st hopper. Initial setting time of M20F1-A, M20F2-A and M20F3-A is longer than that of OPC respectively by 23%, 9% and 4%, whereas setting times of M20F1-B, M20F2-B and M20F3-B increase respectively by 59%, 46% and 40%. Of course, with increasing amount of ashes in cement initial setting time is even more extended, taking twice as long for M40F1-B. Significant differences in setting time of fly ash cements is a consequence of dilution effect of replacing cement with less hydraulic fly ashes and consequently various hydration degree of these cements, which is confirmed by calorimetric measurement, DTA/TG analysis and XRD analysis.
3.7. Testing of Compressive Strength
Table 14 shows results of compressive strength of cement mortars according to Polish Standard PN-EN 196- 1:2006. Grain-size distribution and pozzolanic activity of fly ashes play an important role in strength development of fly ash cement. Fine-grained ashes can achieve better (more rapid) strength development of cement, especially ashes from 3rd hopper. At 2 days compressive strength of M20F3-A is close to that of OPC, while that of M20F1-A
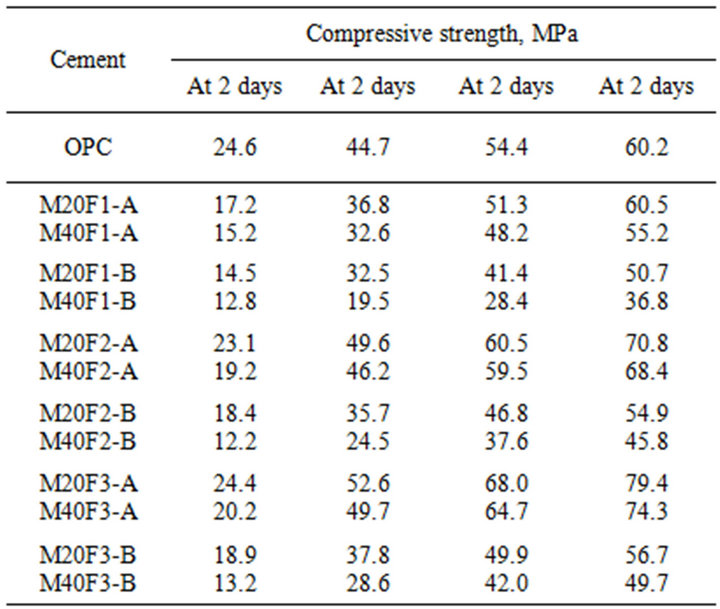
Table 14. Compressive strength of cements with selected fractions of ly ashes F1, F2 and F3.
and M20F2-A is lower by respectively 31% and 6%. At 28 days strength of M20F2-A and M20F3-A is higher in comparison to ordinary Portland cement, respectively by 11% and 17%, while in case of M20F1-A it remains lower. At 180 days increase in strength of M20F3-A is up to 32%. Mortars containing ash of 0 - 16 µm have worse mechanical properties. Compressive strength of M20F1-B mortar is lower than that of OPC by 41% at 2 days, 27% at 28 days and 16% at 180 days.
According to Polish Standard PN-EN 197-1:2002, addition of 20 wt% of F2-A ash give Portland-fly ash cement CEM II/A-V 42.5R, whereas the same amount of F3-A ash-cement CEM II/A-V 52.5N. Addition of 20 wt% of other fly ashes gives Portland-fly ash cement CEM II/A-V 32.5R. Mixtures of M40F2-A and M40F3- A give pozzolanic cements CEM IV/A-V 42.5N and CEM IV/A-V 42.5R, respectively. Compressive strength of mixtures with 40 wt% of ashes F1-B, F2-B and F3-B not exceed 10 MPa at 2 days and 32.5 MPa at 28 days. Different development of compressive strength of cement with the same amount of the same ash fraction, but collected from the next hopper in electro-filter, is attributed to change in properties of fly ash glass. Ashes with a higher depolymerization degree of SiO4 anions in glass cause increase in hydration degree of cement and have positive effect on its mechanical properties. Ash of F1-A ash causes less decrease in cement strength than that due to “dilution effect”, whereas ashes of F2-A and F3-A give cement of higher strength.
4. Conclusions
1) Pozzolanic activity of fly ashes is determined by many factors, especially by fineness, chemical and mineral composition and structure of glassy phase.
2) Finer fraction of fly ashes reveals improved pozzolanic properties, which are connected with its high Blaine surface and greater content of glassy phase.
3) Pozzolanic activity of the same fraction of fly ashes is affected by properties of their glassy phase.
4) Introduction to cement of finer fly ashes with a higher depolymerization degree of SiO4 anions in glass network causes an increase in hydration degree of fly ash cement.
5) Fly ash fraction of 0 - 16 μm selected from 3rd hopper in electrostatic precipitator (ESP) system can give Portland-fly ash cement CEM II/A-V 52.5N and pozzolanic cements CEM IV/A-V 42.5R.
5. Acknowledgements
The paper is financed by the Polish State Committee for Scientific Research, project No. N N506 299139.
REFERENCES
- F. Massazza, “Pozzolana and Pozzolanic Cements,” In: P. Hewlett, Ed., Lea’s Chemistry of Cement and Concrete, Arnold, London, 1998, pp. 471-631.
- E. Tkaczewska, “Influence of Physical and Chemical Properties of Siliceous Fly Ashes on Cement Hydration Process,” Ph.D. Thesis, AGH University of Science and Technology, Krakow, 2007.
- F. H. Hubbard, R. K. Dhir and M. S. Ellis, “PulverizedFuel Ash for Concrete: Compositional Characterisation of United Kingdom PFA,” Cement and Concrete Research, Vol. 15, No. 1, 1985, pp. 185-198. doi:10.1016/0008-8846(85)90025-0
- J. Małolepszy and E. Tkaczewska, “Effect of Size Fraction of Fly Ashes on Their Pozzolanic Properties,” Proceedings of the 5th Conference of Polish Ceramic Society, Vol. 91, No. 2, 2005, pp. 1143-1150.
- E. Tkaczewska and J. Małolepszy, “Hydration of CoalBiomass Fly Ash Cement,” Construction and Building Materials, Vol. 23, No. 7, 2009, pp. 2694-2700. doi:10.1016/j.conbuildmat.2008.12.018
- S. Antiohos and S. Tsimas, “Incestigating the Role of Active Silica on the Hydration Mechanisms of HighCalcium Fly Ash/Cement Systems,” Cement and Concrete Composites, Vol. 27, No. 2, 2005, pp. 171-181. doi:10.1016/j.cemconcomp.2004.02.004
- S. H. Lee, E. Sakai, M. Diamon and W. K. Bang, “Characterization of Fly Ash Directly Collected from Electrostatic Precipitator,” Cement and Concrete Research, Vol. 29, No. 11, 1999, pp. 1791-1797. doi:10.1016/S0008-8846(99)00169-6
- Ch. Jaturapitakkul, K. Kiattikomol and S. Songpiriyakij, “A Study of Strength Activity Index of Ground Coarse Fly Ash with Portland Cement,” Science Asia, Vol. 25, 1999, pp. 223-229. doi:10.2306/scienceasia1513-1874.1999.25.223
- J. Małolepszy and E. Tkaczewska, “Effect of Fly Ash Fineness on the Fly Ash Cement Hydration and Properties,” Cement Lime Concrete, Vol. XII/LXXIV, No. 6, 2007, pp. 296-302.
- S. H. Lee, H. J. Kim, E. Sakai and M. Daimon, “Effect of Particle Size Distribution of Fly Ash-Cement System on the Fluidity of Cement Pastes,” Cement and Concrete Research, Vol. 33, No. 5, 2003, pp. 763-768. doi:10.1016/S0008-8846(02)01054-2
- M. C. Mills, “The Influence of Structure on the PhysicoChemical Properties of Slags,” ISIJ International, Vol. 33, No. 1, 1993, pp. 148-155. doi:10.2355/isijinternational.33.148
- E. Tkaczewska and J. Małolepszy, “The Properties of Glass in Siliceous Fly Ash,” Cement Lime Concrete, Vol. XIV/LXXVI, No. 3, 2009, pp. 148-153.
- W. Bumrongjaroen, S. Swatekititham, R. A. Livingston and J. Schweitzer, “Synthetic Glass Models for Investigating Fly Ash Reactivity,” Proceedings of the 3rd International Conference on the Use of Fly Ash, Silica Fume, Slag, and Natural Pozzolans in Concrete, Warsaw, 2007, pp. 227-242.
- E. Tkaczewska and M. Sitarz, “Effect of Chemical Composition and Structure of Glass in Siliceous Fly Ashes on Their Pozzolanic Activity,” Proceedings of the 6th Conference on Material Problems in Civil Engineering MATBUD’2011, Krakow, 2011, pp. 411-418.
- E. Tkaczewska and M. Sitarz, “The Effect of Glass Structure on the Pozzolanic Activity of Siliceous Fly Ashes,” Physics and Chemistry of Glasses—European Journal of Glass Science and Technology Part B, Vol. 54, No. 2, 2013, pp. 89-94.
- J. Dereń, J. Haber and R. Pampuch, “Solid State Chemistry,” Polish Scientific Publishers PWN, Warsaw, 1979.
- E. Görlich, “Chemistry of Silicates,” Polish Geological Institute, Warsaw, 1957.
- J. Małolepszy and E. Tkaczewska, “Effect of Fraction Size of Siliceous Fly Ashes on Hydration and Properties of Cement,” Proceedings of the 5th Conference on Material Problems in Civil Engineering MATBUD’2007, Krakow, 2007, pp. 331-339.
- W. Nocuń-Wczelik, “Heat Evolution in Hydrated Cementitious Systems Admixtured with Fly Ash,” Journal of Thermal Analysis and Calorimetry, Vol. 65, No. 2, 2001, pp. 613-619. doi:10.1023/A:1017970228316
- K. Ogawa, H. Uchikawa, K. Takemoto and I. Yasui, “The Mechanism of the Hydration in the System C3S—Pozzolana,” Cement and Concrete Research, Vol. 10, No. 5, 1980, pp. 683-696. doi:10.1016/0008-8846(80)90032-0
- E. Tkaczewska, “Properties of Cement Containing Various Size Fractions of Siliceous Fly Ashes,” Roads and Bridges, Vol. 4, No. 4, 2008, pp. 47-80.
- E. Tkaczewska and J. Małolepszy, “Studies on the Mineralogical Composition and Structure of Glass of Siliceous Fly Ashes,” Proceedings of the 54th Conference “The Scientific Research Problems of Building”, Vol. 5, 2008, pp. 411-418.
- E. Sakai, S. Miyahara, S. Ohsawa, S. H. Lee and M. Daimon, “Hydration of Fly Ash Cement,” Cement and Concrete Research, Vol. 35, No. 6, 2005, pp. 1135-1140. doi:10.1016/j.cemconres.2004.09.008
- M. P. De Luxán, M. I. Sánchez de Rojas and M. Frías, “Investigation on the Fly Ash—Calcium Hydroxide Reactions,” Cement and Concrete Research, Vol. 19, No. 1, 1989, pp. 69-80. doi:10.1016/0008-8846(89)90067-7
- K. Takemoto and H. Uchikawa, “Hydration of Pozzolanic Cement,” Proceedings of the 7th International Congress on the Chemistry of Cement, Vol. 1, Sub-Theme IV-2 1980.
- M. Sitarz, “The Structure of Simple Silicate Glasses in the Light of Middle Infrared Spectroscopy Studies,” Journal of Non-Crystalline Solids, Vol. 357, No. 6, 2011, pp. 1603-1608. doi:10.1016/j.jnoncrysol.2011.01.007
- M. Sitarz, M. Handke and W. Mozgawa, “Identification of Silicooxygen Rings in SiO2 Based on IR Spectra,” Spectrochimica Acta Part A, Vol. 56, No. 9, 2000, pp. 1819-1826. doi:10.1016/S1386-1425(00)00241-9
- P. Tarte, “Infrared Spectra of Inorganic Aluminates and Characteristic Vibrational Frequencies of AlO4 Tetrahedra and Also Octahedral,” Spectrochimica Acta A, Vol. 23, No. 7, 1967, pp. 2127-2143. doi:10.1016/0584-8539(67)80100-4
- M. Taylor and G. E. Brown, “Structure of Mineral Glasses. II. The SiO2-NaAlSiO4 Join,” Geochimica et Cosmochimica Acta, Vol. 43, No. 9, 1979, pp. 1467-1473. doi:10.1016/0016-7037(79)90141-8
- B.O. Mysen, D. Virgo and I. Kushiro, “The Structural Role of Aluminum in Silicate Melts—A Raman-Spectroscopic Study at 1-Atmosphere,” American Mineralogist, Vol. 66, No. 7-8, 1981, pp. 678-701.
- S. Diamond, “The Microstructures of Cement Paste in Concrete,” Proceedings of the 8th International Congress on the Chemistry of Cement, Rio de Janeiro, 1986, pp. 122-147.