Open Journal of Polymer Chemistry
Vol.2 No.2(2012), Article ID:19548,5 pages DOI:10.4236/ojpchem.2012.22011
Characterization of the Burning Behaviour of Plastics by a New Method
Leibniz Institute of Polymer Research Dresden, Dresden, Germany
Email: *taeger-frank@ipfdd.de
Received April 12, 2012; revised May 11, 2012; accepted May 20, 2012
Keywords: Plastics; Burning Behaviour; Fire Protection; Flammability
ABSTRACT
A method is described, that allows a quick and simple testing of the burning behaviour of plastics. It takes into account ignition time as well as afterflame time; properties that are characteristic for the burning behaviour of a particular plastic material. The procedure is easy to perform, it does neither require injection-moulded samples nor expensive equipment. The method provides a classification of the burning behaviour. It is especially suitable for a screening of plastic materials complementing established methods like UL-94, GWFI and LOI, and may find application in the development of flame retardants.
1. Introduction
The characterization of the behaviour of plastics while being on fire is of great importance for the practical use of plastic materials. A phenomenological nomenclature is often used, e.g. a material is called “flammable”, if it continues to burn after the energy source causing the ignition is removed. If however the flame goes out after the energy source has been removed, the material is classified as “not easily ignited”. Sometimes the term “selfextinguishing” is used for the latter case. Materials that resist ignition are called “non-flammable”. Such a phenomenological differentiation is applicable in many cases. A more elaborate treatment of the burning behaviour however requires more than these three terms. Most plastics are described as being flammable. This is a conesquence of an overall similar chemical composition. On the other hand the burning behaviour may depend on the particular fire conditions, e.g. the actual temperature the material is exposed to. A certain material may prove to be not easily ignited at lower temperatures, while it burns easily when exposed to higher temperatures. This may lead to misinterpretation and errors by implying a reduced risk.
In the past, several methods for the characterization of the burning behaviour of plastics have been developed, which allow a more accurate treatment, namely the Limiting-Oxygen-Index test (LOI) [1], the test after the Underwriter Laboratories’ procedure UL-94 [2] and the filament test [3]. With these methods it is possible to test the influence of particular material compositions, e.g. the content of flame retardants in injection-moulded samples. This contribution presents a new method for the characterization of the burning behaviour of plastics. Measurements are discussed and compared to the methods mentioned above.
2. Experimental
With the new method samples are tested for their flammability and maintaining a full blown fire—i.e. after a flash over. Samples must not be injection-moulded. With this method powdered, granular or compact as well as liquid material can be tested. The method is fast, it does not require expensive equipment, and variations in experimental set-up and procedure are possible [4].
With the procedure described here plastics were treated with a flame in order to obtain data for the characterization of the burning behaviour.
2.1. Sample Preparation
For treating a sample with a flame, 200 mg of the polymer were weighed into a sample holder and melted carefully to a compact mass by using a hot-air dryer or a heat gun. The samples thus obtained were placed in a sample holder in a defined position in the upper flame zone of a still not lighted Bunsen burner with preset and fixed settings (gas and air flow). The settings were kept constant during the measurements. The flame was adjusted to allow a gradual heating of the sample and an instant ignition of flammable pyrolysis gas.
2.2. Procedure
• Treatment of the first sample with the flame and time recording:
• The burner is lighted, and the time is measured until the sample visibly burns on its own (ignition time tign).
• Further treatment with the flame: After ignition, the flame treatment was continued for 6 sec with constant intensity, then the burner’s flame was immediately stopped.
• Recording of the afterflame time: After removal of the ignition source by stopping the burner flame, the period of time is measured, for which the sample keeps on burning on its own (afterflame time taf).
• For every material 10 runs were performed. From every material samples were prepared by injecttionmoulding, and subjected to tests according to the UL- 94 as well as the filament test procedure.
3. Results and Discussion
Table 1 lists the ignition time (tign) as well as the afterflame time (taf) for the plastics tested after the procedure described above. The materials tested here strongly differ with respect to these values.
Generally a material should be less flammable, the longer its ignition time and the shorter the afterflame time.However it becomes apparent, that a high or low tign does not mean a low resp. high taf in every case. A more careful interpretation of the values is thus necessary.
3.1. Ignition Time
PTFE and PC are commonly considered as being flame resistant, and as expected show no ignition (PTFE) or require the longest period of time for ignition (PC). Polyamides 6.6 and PA 6 as well as a glass fibre reinforced PA 6 show a medium range tign of 44 to 48 sec. A significantly shorter ignition time is found for ABS, PS and PMMA. Contrary to this expected order, high density PE (PE HD, 46.6 sec) and PVC-U (32.1 sec) showed ignition times outside the expected range; compare with results after the Underwriter Laboratories’ test UL-94, the Glow-Wire Flammability Index (GWFI) and the Limiting-Oxygen-Index (LOI).
The ignition time is mainly determined by the point, were a sufficient amount of flammable gas has been set free through pyrolysis. For this process a certain extent of thermal decomposition is necessary as well as the diffusion of volatile products into the adjacent oxygen-rich atmospheric layer, reflecting the chemical bond strength and the viscosity of the molten phase.
As can be seen from Table 2, the decomposition temperature Tdec of the tested materials correlates well with the order of ignition time from Table 1. Bearing in mind, that minor divergences also result from decomposition temperature ranges of various widths, it can be concluded, that the tign of a certain material is longer, the higher its decomposition temperature.
Differences in constitution of the plastics matrix are less important for the tign since the strong burner flame will ignite the different products from pyrolysis thus overriding inflammation limits.
The close relationship between tign and Tdec is also evident for PA 6 and PA 6 GF 30. While the glass fibre filled material has a lower rating (or even no rating) then the non-filled counterpart, the tign of the two types of poly
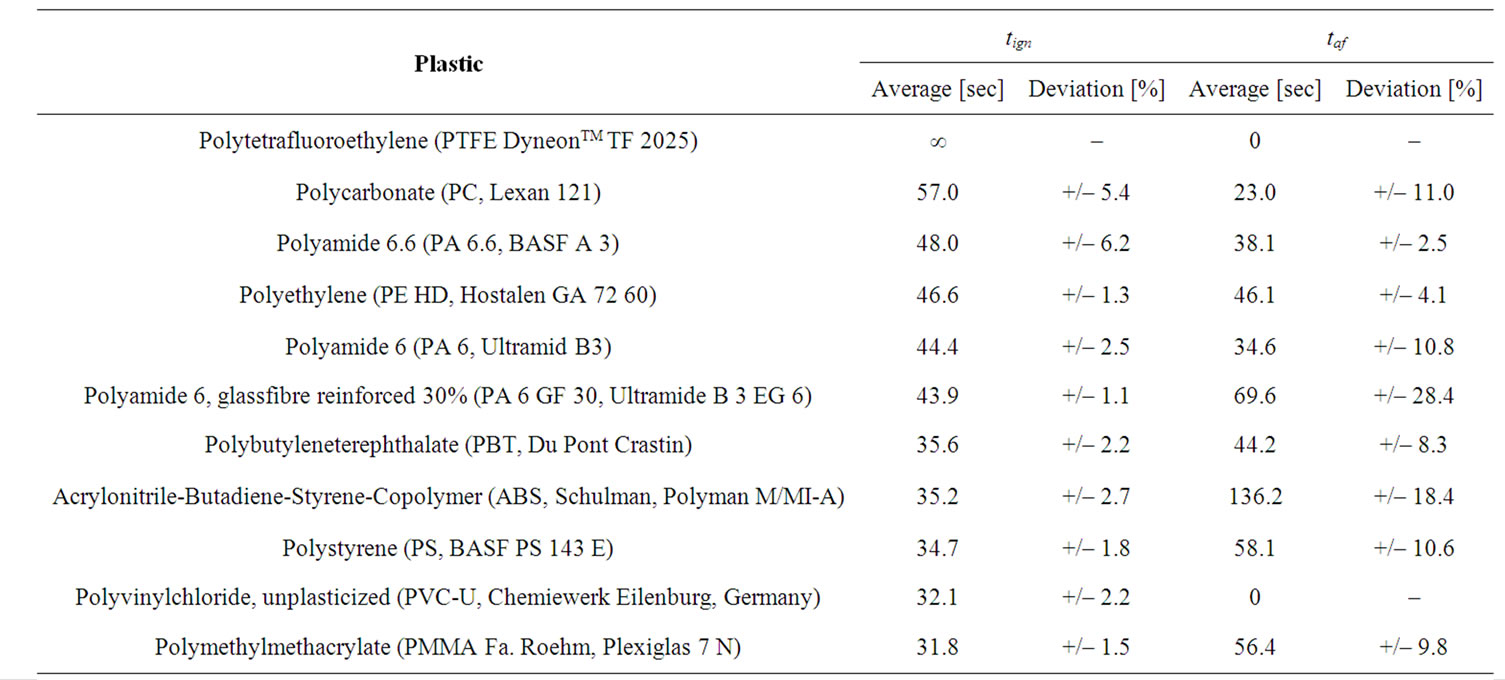
Table 1. Ignition time tign and afterflame time taf of selected plastics, in the order of decreasing tign.
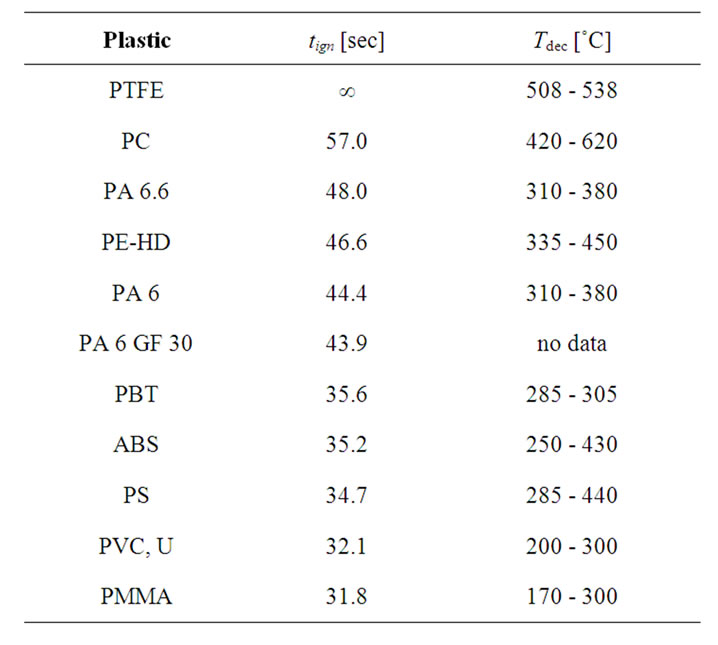
Table 2. tign and range of Tdec [5-7] of selected plastics.
amides show no significant difference. The glass fibre filling obviously does not change the thermal decomposition process of the organic phase. In case of a UL-94 test however the wick feeding effect causes a less favourable burning behaviour which leads to a negative rating.
3.2. Afterflame Time
As mentioned above the ignition time tign does not reflect the actual burning behaviour sufficiently enough, since the measured afterflame time values (taf) show an opposite trend in several cases. The afterflame time describes first of all to what extent a material can continue on its own the pyrolysis of the polymer matrix after a defined energy input exceeding the point of ignition (“thermal feedback”). The obvious assumption, that the taf is mainly determined by the heat of combustion (DHC) of the plastic, which can be set free during burning, is not correct. This becomes already evident by the fact that no test sample burnt down completely. Yet there is a relation between these two variables for plastics of low calorific value (see Table 3). PTFE and PVC-U having the lowest DHC of the tested materials showed the shortest taf.
However the conclusion that a high DHC will result in a long taf is not supported by the experimental findings; compare for example the values for PE and PBT. While the calorific values are strongly different (PE 46.7 kJ/g, PBT 24.8 kJ/g), the taf are very similar (46.1 and 44.2 sec) and in a medium range when compared to the other tested plastics. It is thus more likely that the taf reflects the burning intensity, which in turn is determined by factors like melt viscosity, swelling and the formation of isolating layers on the surface. The influence of such
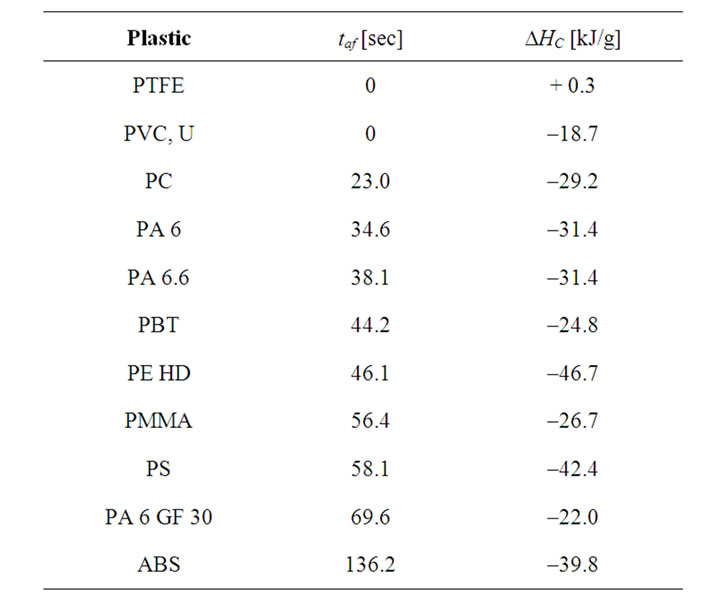
Table 3. taf and DHC [6,7] of selected plastics.
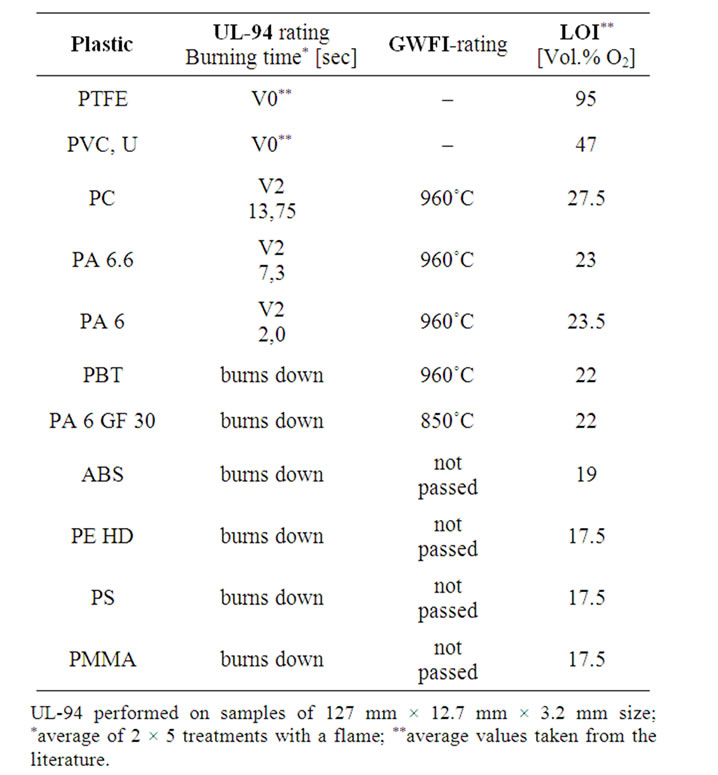
Table 4. Results from tests according to UL-94, the GWFI procedure and LOI [6,8,9].
kinetic factors on the taf becomes evident with PA 6 and PA 6 GF 30. The effect of the glass fiber leads to a twice as long taf although this plastic contains 30% less of combustible material.
The tign and taf values reflect to a certain extent the complex burning process with ist various thermodynamic and kinetic parameters and phenomena. For comparison with other methods, which characterize the burning behaviour by measured values from real burning samples, we fell back on the above mentioned test methods.
Table 4 lists the results from tests performed on injection-moulded samples of the respective plastics using the the UL-94 and GWFI procedures. The LOI values were taken from the literature.
By assuming that PTFE and PVC get the best ratings also with the UL-94 and GWFI-test, the results for the tested materials are in agreement with the other results and methods. At least there are no clearly opposite trends. Upon trying to give a qualitative order of plastics with respect to their burning behaviour from Table 4, three classes of materials are obtained:
• Class 1 showing high flame resistance: PTFE, PVC
• Class 2 showing medium flame resistance: PC, PA 6, PA 6.6, (PBT)
• Class 3 showing low flame resistance: (PBT), PA 6 GF 30, ABS, PE, PS, PMMA
A more elaborate classification seems not to be possible with the UL-94 or GWFI method alone or by a combination of both.
A rating of the burning behaviour by a separate evaluation of the tign as well as the taf leads partially to the above classification. Both values indicate the highest flame resistance for PTFE. PC and both the unfilled PAs are in the medium range, and PS, PMMA and ABS show a low flame resistance according to both values. PVC and PA 6 GF 30 can not be clearly assigned to one class, since the ratings after those two values differ too much. In order to solve this problem, tign and taf were combined mathematically. The contained information on the burning behaviour is then expressed by the combined value Wbb. A clear assignment is then possible, at least for the materials investigated in this study. The combination was not performed for materials which could not be ignited (tign = ¥, PTFE), or had a afterflame time taf of 0 (PVC-U). These values already prove the low flammability of these materials, which are therefore listed on top of Table 5.
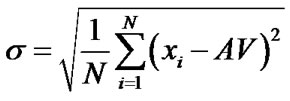
The mathematical procedure applied here is based on establishing average (AV) and standard deviation (rootmean square error, s) of both series of measurements. Then the difference between the individual values and the average was correlated with s leading to tign,rel and taf,rel, resulting in values of comparable order of magnitude. The tign values had to be assigned negative in order to ensure a similar treatment for the relative values reflecting the burning behaviour. Furthermore the tign,rel was weighed only half for Wbb since by subjective estimation tign describes the burning behaviour less accurate then taf.
By simple addition we obtain
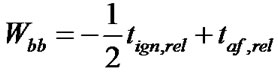 (1)
(1)
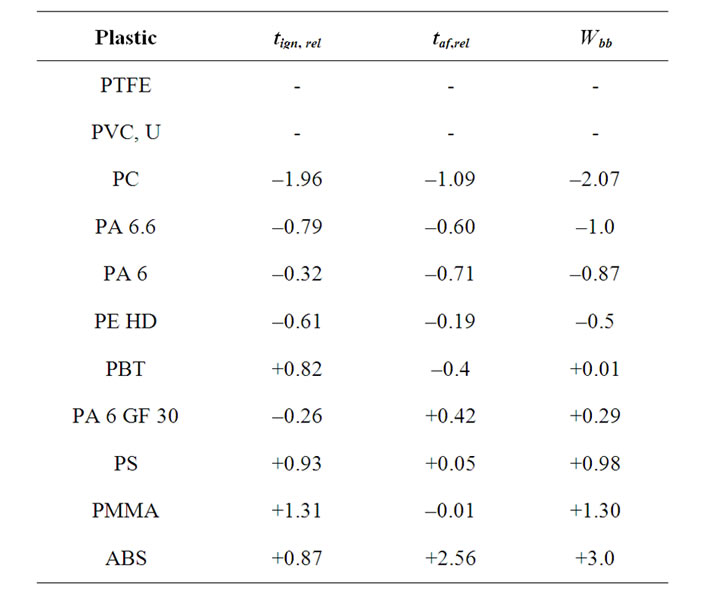
Table 5. Ignition time tign,rel, afterflame time taf,rel and Wbb value in the order of increasing Wbb.
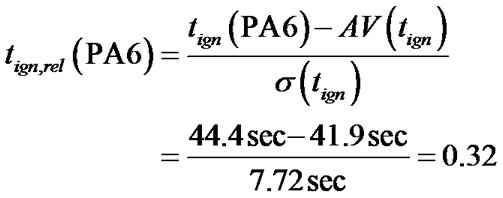
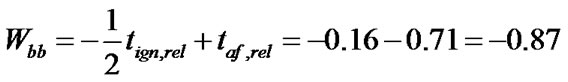
In the following the procedure is demonstrated for PA 6:
The average (AV) of the tign is calculated
 (2)
(2)
N: number of measured values (9); xi: actual measured value (for PA 6: 44.4sec)
 (3)
(3)
with
 (4)
(4)
a s(tign) of 7.72 sec is obtained.
For tign,rel (PA 6) with
 (5)
(5)
a value of 0.32 is obtained.
By an analogous procedure for taf with AV (taf) = 56.7 sec and σ (taf) = 31.0 sec and taf,rel (PA 6) = – 0.71 via
 (6)
(6)
we obtain for PA6 a Wbb of –0.87.
Table 5 lists the tested plastics in the order of increasing Wbb. From the definition of Wbb (see Equation (1)) follows that a particular plastic material is all the less flammable the more negative the result of the sum. This value allows to compare the combustibility of the materials. Figure 1 illustrates this relationship.
The plastics have clearly different Wbb values. The classes of materials from Table 4 can still be recognized. Class 1 is represented by PTFE and PVC with a tign and taf of 0 respectively. The negative range –2 to 0 includes those materials which have been assigned already to class 2 earlier. PBT with a Wbb of 0.01 is at the borderline of class 3. The flammable materials are also clearly divided from each other by their Wbb values. The order of increasing flammability is PA 6 GF 30, PS, PMMA, ABS. The clear position of ABS as being the material with the highest combustibility should be noted. The position of PE is worth mentioning, with a Wbb of –0.5 in the medium range of flame resistance, reflecting a high tign together with a relatively high thermal stability.
While with the other test methods mentioned above (where PE is assigned to class 3) in most cases the activation energy is expended for ignition, and thus cannot be taken into account for the classification, the new method allows to include this material property. This fact is certainly of advantage in order to estimate more accurately the fire risk of a particular material.
4. Conclusions
The new method allows a quick and simple testing of the burning behaviour of plastics. The procedure is easy to perform, since it does neither require injection-moulded samples nor expensive equipment.
The method is especially suitable for clearly defined classifications. It may be applied for a screening of plastic materials, or research and development, e.g. finding an optimal flame retardant. Remarkable are the low deviation and the good reproducibility of measured values.
By the mathematical combination of tign and taf we have tried to express various material properties that are responsible for the burning behaviour by one value.
The method provides classifications that are supported by the older methods. It thus would make sense to apply the new method in order to complement the other methods.
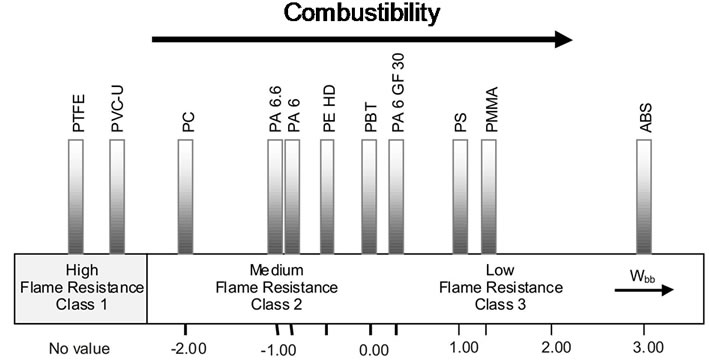
Figure 1. Wbb values of selected plastics.
These standardized tests however remain indispensable and find their application, as becomes evident e.g. from recent studies on plastics containing flame retardants [10-12].
REFERENCES
- DIN EN ISO 4589, “Plastics—Determination of Burning Behaviour by Oxygen Index: Part 1,” Beuth Verlag, Berlin, 1999.
- Underwriter Laboratories, “UL-94: Tests for Flammability of Plastic Materials for Parts in Devices and Appliances,” 3rd Edition, Underwriter Laboratories Inc., Northbrook, 1989.
- DIN EN 60695-2-12, “Fire Hazard Testing: Part 2-12: Glowing/Hot-Wire Based Test Methods—Glow-Wire Flammability Index (GWFI) Test Method for Materials,” Beuth Verlag, Berlin, 2001.
- F. Taeger, A. Mueller and D. Lehmann, “Verfahren zur Bestimmung des Brandverhaltens von Materialien,” DE Patent No. 10315228.8-52, 2003.
- H. Batzer, “Polymere werkstoffe,” Georg Thieme Verlag Stuttgart, New York, 1985, p. 517.
- C. J. Hilado, “Flammability Handbook for Plastics,” 5th Edition, Technomic Publishing Company, Basel, 1998, p. 48.
- J. Troitzsch, “International Plastics Flammability Handbook,” Carl Hanser Verlag, Munich, Vienna, New York, 1990, p. 22.
- H. G. Elias, “Macromolecules: Applications of Polymers, Volume 4,” Wiley-VCH, Weinheim, 2009, pp. 65-68. doi:10.1002/9783527627240
- A. R. Horrocks and D. Price, “Fire Retardant Materials,” Woodhead Publishing Ltd., Cambridge, 2001, p. 227.
- U. Braun, A. I. Balabanovich, B. Schartel, U. Knoll, J. Artner, M. Cisielski, M. Döring, R. Perez, J. K. W. Sandler, V. Altstädt, T. Hoffmann and D. Pospiech, “Influence of the Oxidation State of Phosphprorus on the Decomposition and Fire Behaviour of Flame-Retarded Epoxy Resin Composites,” Polymer, Vol. 47, No. 26, 2006, pp. 8495-8508. doi:10.1016/j.polymer.2006.10.022
- R. M. Perez, J. K. W. Sandler, V. Altstädt, T. Hoffmann, D. Pospiech, M. Cisielski, M. Döring, H. Braun, A. I. Balabanovich and B. Schartel, “Novel Phosphorus-Modified Polysulfone as a Combined Flame Retardantand Toughness Modifier for Epoxy Resins,” Polymer, Vol. 48, No. 3, 2007, pp. 778-790. doi:10.1016/j.polymer.2006.12.011
- O. Fischer, D. Pospiech, A. Korwitz, K. Sahre, L. Häußler, P. Friedel, D. Fischer, C. Harnisch, Y. Bykov and M. Döring, “Synthesis and Properties of Phosphorus Polyesters with Systamatically Altered Phosphorus Environment,” Polymer Degradation and Stability, Vol. 96, No. 12, 2011, pp. 2198-2208. doi:10.1016/j.polymdegradstab.2011.09.006
NOTES
*Corresponding author.