Open Journal of Radiology
Vol. 3 No. 2 (2013) , Article ID: 33354 , 8 pages DOI:10.4236/ojrad.2013.32014
Intra and Inter-Observer Reliability of Mobile Tablet PACS Viewer System vs. Standard PACS Viewing Station-Diagnosis of Acute Central Nervous System Events
Department of Radiology, Mount Sinai Medical Center, Miami Beach, USA
Email: *chancockmd@gmail.com
Copyright © 2013 Aashim Bhatia et al. This is an open access article distributed under the Creative Commons Attribution License, which permits unrestricted use, distribution, and reproduction in any medium, provided the original work is properly cited.
Received July 1, 2012; revised February 16, 2013; accepted February 24, 2013
Keywords: Teleradiology; Telemedicine; Cloud Network; PACS; Mobile Device; Emergency; Acute Stroke
ABSTRACT
Background and Purpose: The display resolution of the Apple iPad® is 1024 × 768 pixels, which is greater than that required for generating the typical CT or MRI images. The purpose of this study is to determine if specific CT and MR sequences can be interpreted accurately on mobile device/PACS software platforms when compared to a traditional stationary high resolution monitor/PACS radiological workstation. If so, this allows radiologists to provide comparable interpretation as if they were onsite at an imaging center or hospital. Materials and Methods: This study is an investigator initiated, single site, retrospective, nonrandomized, IRB approved study. Five radiologists were included in this study. Each independently interpreted specific CT and MR sequences on traditional high-resolution LCD monitors via eFilm® software as well as an iPad® mobile device using Osirix® software program. Repeat interpretations were performed, with 4 weeks minimum interval between interpretations of each patient. This investigation included: 50 patients with CTA perfusion imaging, 50 patients with MRI of the brain, and 50 patients with MRI of the spine, which were image study orders generated through emergency room requests. Subsequently, interpretive results of each radiologist for each patient were statistically compared to evaluate for intra-observer and inter-observer reliability. Results: The parameters set within the CTA perfusion brain studies demonstrated excellent intra-observer variability. All of the parameters within the MRI brain studies demonstrated excellent intra-observer variability with a Cohen’s kappa value > 0.75. The Cohen’s kappa values for the board certified neuroradiologist demonstrated excellent variability for all parameters; the resident radiologists had good variability, with a majority of kappa values near 0.75. Conclusions: The data and statistical analysis demonstrated that portable mobile devices such as the Apple iPad® can display adequate resolution of CT and MRI sequences to accurately diagnose acute central nervous system injuries and other non-acute pathology.
1. Introduction
Mobile devices with their many applications have made it possible to view radiological images on mobile tablet devices such as the Apple iPad® [1,2]. One of the commonly used applications includes the recently FDA approved mobile application, Mobile MIM® [3]. Mobile tablet/PACS viewer systems, may be used in a cloud environment on Windows® based personal computers and Apple platforms [4]. The first comprehensive mobile medical imaging picture archiving and communication system (PACS) freeware application, Osirix® (Figure 1), can be used on the iPad® and iPhone® [1,2,4,5].
Previous studies have shown the potential for evaluating emergent imaging findings with mobile devices [6-9]. Early studies evaluated personal computers for diagnosing imaging findings before mobile devices were technologically sufficient to view radiological images [10]. Wrist fractures on digital radiographs were evaluated on a personal computer linked 17-inch color monitors, with a display of 1024 × 768 pixels [10]. The traditional workstation measured 21 inches with a display of 1728 × 2304 lines, demonstrating no difference in accuracy among observers [10]. Another more recent study evaluated orthopedic injuries and intracranial hemorrhage on a personal digital assistant and Apple iPod Touch versus non-standard workstation monitors showing the potential for reading emergent studies on handheld devices [11]. Nonemergent findings such as pulmonary nodules have been compared on the iPad versus the LCD standard display demonstrating no significant difference in diagnostic variability [12]. A study interrogating the utility of analyzing emergent CT brain studies was performed using the Apple iPad as a mobile tablet viewing device with promising results suggesting further evaluation [13]. These studies support the use of the mobile viewer as an accurate, reliable tool for viewing acute and non-acute medical images in various clinical settings.
If specific CT and MR sequences can be interpreted accurately on mobile device/PACS software platforms when compared to a traditional stationary high resolution monitor/PACS workstation, then a radiologist can provide the same turnaround time as if onsite at an imaging center or hospital [14]. This improved interpretation time will result in more timely evaluation and treatment, even when the radiologist is off site [15-17]. This will improve treatment times at a significant number of institutions as many rely on off-site interpretation during non-business hours. A diagnostically accurate mobile medical viewer application is useful for additional primary and secondary interpretations by radiologists, for surgeons who wish to see images in the operating room, for physician discussions with patients and other consulting physicians, for academic presentations, for research, and to facilitate teleradiology/telemedicine endeavors [6,17].
We hypothesize the iPad and other similar mobile device display resolutions are adequate to make critical findings in acute CNS events, in which a delay in diagnosis can prolong necessary intervention and treatment [18]. Recent work supports our hypothesis that mobile tablet and smart phones indeed provide more than adequate resolution required for diagnostic purposes while maintaining expected accuracy [19].
2. Methods
This study is an investigator initiated, single site, retrospective, nonrandomized, IRB approved study. Radiologists included 5 observers consisting of: one American College of Radiology Board Certified Diagnostic & Certificate of Added Qualification-Neuroradiologist, three 4th Year radiology residents (2 entering neuroradiology fellowships), and one 2nd year radiology resident. Each radiologist independently interpreted specific CT and MR sequences on traditional high-resolution LCD monitors via eFilm software as well as on an iPad using Osirix mobile software [1,4,20,21]. The study included anonymized patient images obtained from July 2007 through October 2010. The images consisted of: 50 patients with MRI of the spine, 50 patients with MRI of the brain, and 50 patients with CTA perfusion imaging. The MRI of the spines included cervical, thoracic and lumbar spines. There were patients that had two studies; two different patients had two MRIs of the spine, a lumbar and thoracic spine. One patient had two MRI of the spines including a lumbar and cervical spine. There was a patient, which had two CTA stroke evaluations on successive days included in our study. The CT perfusion study included a plain brain with a brain and bone window; in addition two CT perfusion slabs were included. The MRI of the spine included 3 mm slice thickness sequences: T2 sagittal 3 mm TE 102/TR 4300, T1 sagittal TE 12/TR 500, STIR sagittal TE 49/TR 4360 and T2 axial. MRI of the brain included 5 mm slice thickness sequences: T2 flair axial TE 102/TR 8500, gradient axial TE 26/TR 444, T1 axial TE 10/TR 555, DWI axial with correlating ADC axial maps. Orders were generated through the emergency department for an acute CNS event requiring acute imaging. Each observer reviewed the studies independently on both platforms. Repeat interpretations were performed, with an interval of at least 4 weeks, on each respective software and workstation vs. tablet platform. The blinded interpreting radiologist physicians received access to file folders containing 50 anonymized patient image studies each; organized 1 - 50 for emergent CTA Brain perfusion, 1 - 50 for emergent MRI Brain, and 1 - 50 for emergent MRI Spine. The physicians were specifically blinded to the patient’s medical history simulating how many acute central nervous system events arrive to the emergency room with little, incomplete, or no history. Our institution is a certified comprehensive stroke center. Thus, CTA brain perfusion studies generated through the emergency room are performed to assess for acute ischemic events, and thus this history would be assumed.
Computed tomography angiogram (CTA) brain perfusion study sequences utilized CT brain, CTA maximum intensity projection 30 mm slab reconstructions, as well as colorized and post-processed CTA perfusion blood flow, blood volume, and mean transit time (MTT) renderings [22-25]. Image viewing analysis for parameters of magnification, window panel number, contrast, brightness, and same study comparison were not hindered by software independent default settings, allowing the interpreter free reign to evaluate images he/she would during a standard interpretive session [26-28]. MRI sequences for the brain included DWI, ADC, T2, and gradient. MRI sequences for the spine consisted of T2 sagittal, T1 sagittal, STIR sagittal, and T2 axial. The MRI brain and spine studies in our emergency room may be ordered in any emergency situation deemed clinically appropriate such as trauma, infection, tumor, or acute neurological deficit for common etiologies such infarction, disk herniation and compressed nerve roots [29-33].
The contrast and brightness of the two platforms were compared. They were found to use different algorithms when applied to the selected series as many proprietary viewers have pre-determined their preferred default settings for rendering image display [26,27]. The Osirix® system locates the middle image of each series, calculates the best W/L for that image, and applies those settings to the entire series [26,34]. The eFilm® image viewer as used on the standard workstation calculates the best W/L for each image, and applies it to that specific image only [26,35]. When comparing images on both systems, no qualitative visual difference was appreciated or reported and there was no fixed default setting. Specifically, interpreting radiologists were encouraged to change window level brightness and contrast variables on both the Osirix and eFilm PACS viewers as would typically be done during interpretation.
We chose the iPad mobile device as our tablet due to its compatibility with the globally popular Osirix® freeware viewer application for the Mac operating system [36]. OsiriX® mobile is an application used as a DICOM viewer for the iPad® and iPhone® allowing for medical study image viewing [4,37]. All personal identifiers were removed from the data spreadsheets such that there were no links between the study sequence folders and the individual patients as shown in Figure 1.

Figure 1. (Osirix® User Interface). Legend: User interface of Osirix® application on the Apple iPad® displaying a list of studies on the left of the screen and preview of series on the right.
Each radiologist documented his results into positive or negative restricted diffusion for infarction via analysis of restricted DWI & ADC mapping, blooming artifact seen on gradient sequencing, perfusion deficit as determined by analysis of cerebral blood flow, cerebral blood volume, and mean transit time [38-43]. In addition, other CNS pathologic etiologies were assayed including: intracranial hemorrhage, spinal cord compression, fracture, spinal canal stenosis, neural foraminal stenoses, disk herniation, and annular fissuring [24,44-47].
Subsequently, the results of each radiologist for each patient were compared to evaluate for intra-observer and inter-observer reliability [48]. The gold standard use for comparison of accuracy of results was based on the findings viewed by the board certified neuroradiologist on the high resolution LCD monitors/eFilm PACS workstation. Results were plotted for the board certified neuroradiologist individually due to wide difference in experience between reviewers, and then for all resident radiologists as a group including the neuroradiologist. The statistical method according to Cohen’s kappa test was employed [49-54]. Cohen’s kappa score range is −1 to 1 [55]. Fleiss’s arbitrary guidelines characterize Kappa’s values > 0.75 as excellent, Kappa’s values = 0.40 to 0.75 as fair to good, and Kappa’s values < 0.40 as poor [55-58].

O = Proportion of ratings where scores are in agreement E = Proportion of agreements expected “by chance” if scored randomly The iPad’s display resolution provides an acceptable display to make critical findings in acute CNS events as shown in Table 1.
3. Results
Statistical evaluation of intra-observer variation with Cohen’s kappa test demonstrated excellent correlation in a majority of the parameters evaluated, as demonstrated
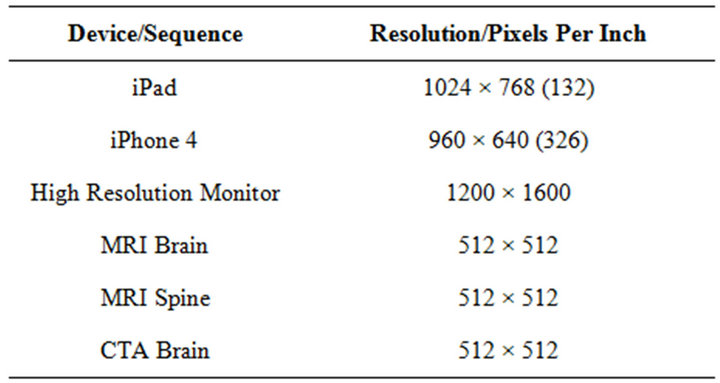
Table 1. (Viewer resolution). Legend: Comparison of resolution in pixels/inch for various mobile devices and high resolution monitor.
with a kappa value > 0.75 in CTA Brain, MRI Brain, and MRI Spine evaluations.
The CTA brain perfusion analysis parameters evaluated included: Intracranial hemorrhage, bright MCA sign, hypo-density sign (1/3 MCA infarction zone, PCA, ACA, and posterior fossa arterial distributions) and perfusion measurements (cerebral blood flow, cerebral blood volume, and mean transit time). 24 of the 50 CTA perfusion studies demonstrated no findings and were considered negative. Parameters within the CTA brain studies demonstrated excellent intra-observer variability for evaluation of the middle cerebral artery infarction zones as shown in Figure 2. Statistical comparison of the anterior and posterior circulation ischemia was limited to low incidence. For example, the anterior cerebral artery (ACA) territory remote infarct/ischemic change comparison demonstrated a Cohen’s kappa of 0.66 with a small remote ischemic region seen on post analysis, but the statistical evaluation was limited due to the low n=1 obtained in this research study. CT perfusion analysis, as frequently seen at our certified comprehensive stroke center, was considered to be highly reliable for comparison between image viewer system platforms. Notice the conspicuous color delineation seen in the mobile tablet research arm; as is depicted on the iPad® screen shot in a normal case as shown in Figure 3.
MRI brain analysis parameters included: acute, subacute, and chronic features of hemorrhage, restricted diffusion positivity, T2/T2 flair hyperintense lesions, and gradient blooming artifact as shown in Figure 4. All of the parameters within the MRI brain studies demon
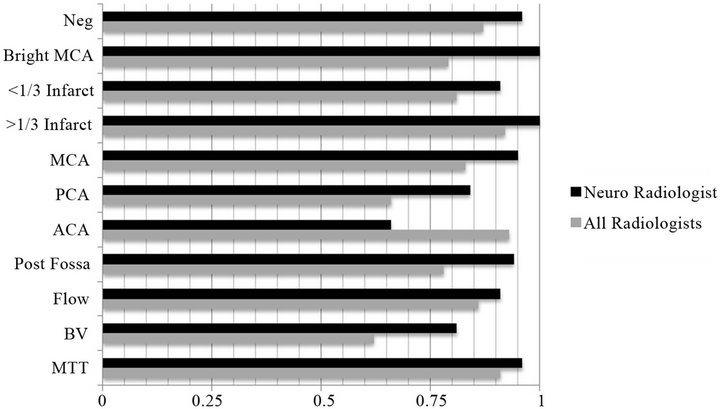
Figure 2. (CT brain Cohen’s Kappa Analysis). Legend: Graph displaying CTA perfusion kappa values for neuroradiologist and all radiologists. Cohen’s kappa values > 0.75 are considered criteria for excellent intra-observer variability. Bright MCA = Bright MCA sign; <1/3 infarct = Infarct < 1/3 Vascular Region; > 1/3 infarct = Infarct > 1/3 Vascular Region; MCA = Infarct in vascular distribution of Middle Cerebral Artery; PCA = Infarct in vascular distribution of Posterior Cerebral Artery; ACA = Infarct in vascular distribution of Anterior Cerebral Artery; Post Fossa = Infarct in posterior fossa; Flow = Blood Flow decreased; BV = Blood Volume decreased; MTT = Mean Transit Time Increased.
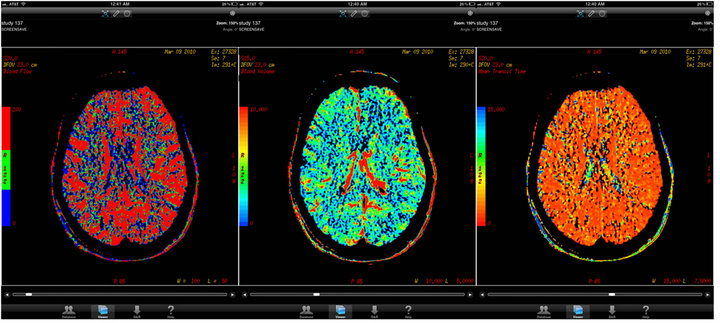
Figure 3. (CTA brain perfusion). Legend: Three separate normal CTA perfusion images at the same level viewed on Osirix® application on the Apple iPad®.

Figure 4. (MRI brain Cohen’s Kappa analysis). Legend: Graph displaying MRI brain kappa values for neuroradiologist and all radiologists. DWI = Restricted diffusion; T2 flair = T2 weighted fluid attenuation inversion recovery; GRE = Gradient Echo Signal Abnormality.
strated excellent intra-observer variability with a kappa value > 0.75. Focal infarcts were visualized on the iPad with good intra-observer reliability. Diffusion restriction showing acute infarctions were readily observed, as were vascular thromboses, which were seen conspicuously on gradient sequencing; Figure 5.
MRI spine analysis parameters included: fracture 50% vertebral body height loss, anterior/mid/posterior column fracture involvement, spinal cord integrity, moderate stenosis, severe stenosis, annular fissuring, and disk herniation; Figure 6. The Cohen’s kappa values for the neuroradiologist demonstrated excellent variability for all parameters >0.75; the resident radiologists had good variability, Cohen’s kappa values between 0.4 and 0.75, and with a majority of Cohen’s kappa values close to 0.75. Spinal cord lesions were seen on the iPad® by all radiologists with excellent reliability. Disk extrusions and annular fissures were easily discernible on both the standard viewing workstation and the mobile viewer platform as shown on iPad® screen shots Figure 7.
4. Discussion
The parameters set within the CTA perfusion brain studies demonstrated excellent intra-observer variability. CTA brain perfusion analysis demonstrated high reliabil-

Figure 5. (MRI brain acute infarction). Legend: Three separate MRI brain images at the same level demonstrating acute infarction in the right MCA territory as viewed on the Apple iPad® with Osirix® Mobile software.

Figure 6. (MRI spine Cohen’s Kappa analysis). Legend: FX > 50% = Fracture >50 vertebral body height, FX < 50% = Fracture < 50 vertebral body height; ANT = Anterior Spinal Column Abnormality, MID = Middle Spinal Column Abnormality, Post = Posterior Spinal Column Abnormality, SC = Spinal Cord Abnormality, Sten Mod = Moderate Spinal Canal Stenosis, Sten Sev = Severe Spinal Canal Stenosis, NF = Moderate/Severe Neuroforaminal Stenosis, Ann Fiss = Annular Fissure; Herniation = Intervetebral Disc Herniation.
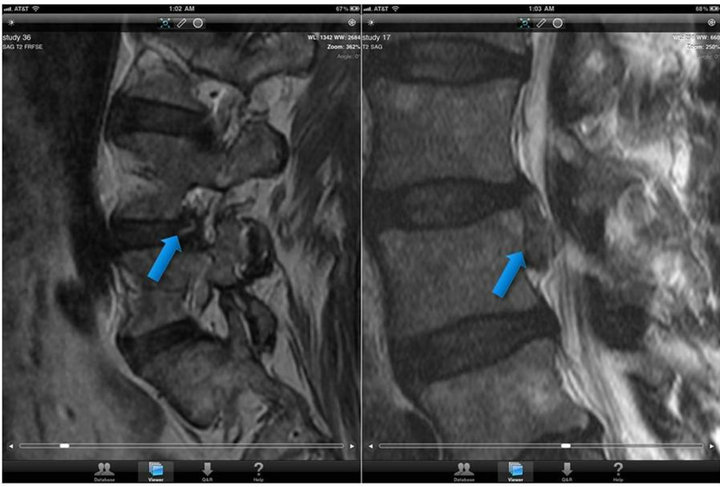
Figure 7. (MRI spine annular fissuring & disk extrusion). Legend: Two sagittal T2 weighted MRI spine images demonstrating findings of annular fissure a) and disk extrusion b) as seen on the Apple iPad® via Osirix® Mobile software.
ity for intra-observer and inter-observer analysis of cerebral blood flow, blood volume, and mean transit time. Statistical evaluation of the MRI brain study research arm demonstrated excellent variability in all parameters for the neuroradiologist and resident radiologists combined. MRI of the spine studies demonstrated the widest variability for the group of resident radiologists; however the neuroradiologist showed excellent variability. This is likely due to relative inexperience of residents and subsequent inconsistency in reading studies. The highest kappa values can be contributed to findings that are more evident to examiners due to relatively conspicuous findings such as greater than 1/3 infarct, DWI positivity, and vertebral body fracture greater than 50%. One limitation of the study is that only one American Board of Radiology board certified with certificate of added qualification (CAQ) Neuroradiologist was included in the comparison analysis. Our institution only employs one such radiologist on the faculty. Future studies may expand the IRB to include multiple centers. HIPAA and image transfer feasibility considerations will need to be addressed at that time. A follow-up study across multiple academic centers would be beneficial to further support our findings.
Another limitation of the study was the range of experience in examiners reading the various studies. However, even with the lack of experience in residents reading complex cases, such as the MRI spine and CT perfusion sequences, the majority of parameters demonstrated excellent intra-observer variability according to Cohen’s kappa score as a key metric of this study.
These results indicate that the iPad and other suitable mobile viewing/PACS platforms can be used by radiologists for diagnostic interpretation. Future studies will focus on application to real world situations, such as on call cases. Items for study include the feasibility for wireless upload of studies to Osirix® (or other software platform), forwarding images to internet mobile software applications via DICOM push/pull algorithms, and subsequent downloading onto mobile viewers for diagnosis. Bandwidth cost and wireless coverage will need to be investigated to determine the practicality of this concept.
Advances continue to be made in the mobile interpretation arena. The MIM® viewer system was recently approved by the Food and Drug Administration (FDA) as a mobile application suitable for interpretation. Other mobile PACS/viewer applications are also under development and FDA approval.
Future studies may be employed to corroborate if similar variability is obtained using other standard workstation monitor systems and divergent PACS software.
5. Conclusion
The data and statistical analysis from our study demonstrate that the Apple iPad®/Osirix® PACS mobile viewer platform displays more than adequate resolution for typical standard CT and MRI images. This validation allows the interpreting radiologist to confidently interpret and accurately diagnose acute central nervous system injuries and other pathology in a remote setting to determine if acute, subacute, and or non-acute management is necessary. This research supports referring physicians who wish to view critical medical images themselves, surgeons and other interventionalists who need to view images in their operating suites that might not otherwise be available, advances teaching and research options, allows for expansion of telemedicine initiatives, and provides physicians the ability to display and discuss medical images with their patients around the world.
6. Acknowledgements
The authors would like to acknowledge Dr. Jennifer Hui, MD for her editing efforts of this manuscript prior to submission and during the review process.
REFERENCES
- S. John, A. C. Poh, T. C. Lim, E. H. Chan and L. R. Chong, “The iPad Tablet Computer for Mobile On-Call Radiology Diagnosis? Auditing Discrepancy in CT and MRI Reporting,” Journal of Digital Imaging, Vol. 25, No. 5, 2012, pp. 628-634. doi:10.1007/s10278-012-9485-3
- F. Volonté F, J. H. Robert, O. Ratib and F. Triponez, “A lung Segmentectomy Performed with 3D Reconstruction Images Available on the Operating Table with an iPad,” Interactive CardioVasc Thoracic Surgery, Vol. 12, No. 6, 2011, pp. 1066-1068. doi:10.1510/icvts.2010.261073
- D. Yeager, “Images on the Move,” Radiology Today, Vol. 12, No. 7, 2011. pp. 12-15.
- A. F. Choudhri and M. G. Radvany, “Initial Experience with a Handheld Device Digital Imaging and Communications in Medicine Viewer: OsiriX Mobile on the iPhone,” Journal of Digital Imaging, Vol. 24, No. 2, 2011, pp. 184-189. doi:10.1007/s10278-010-9312-7
- G. Shih, P. Lakhani and P. Nagy, “Is android or iPhone the Platform for Innovation in Imaging Informatics,” Journal of Digital Imaging, Vol. 23, No. 1, 2010, pp. 2-7. doi:10.1007/s10278-009-9242-4
- S. Lee, T. Lee, G. Jin and J. Hong, “An Implementation of Wireless Medical Image Transmission System on Mobile Devices,” Journal of Medical Systems, Vol. 32, No. 6, 2008, pp. 471-480. doi:10.1007/s10916-008-9153-9
- M. Yamada, H. Watarai, T. Andou and N. Sakai, “Emergency Image Transfer System through a Mobile Telephone in Japan: Technical Note,” Neurosurgery, Vol. 52, No. 4, 2003, pp. 986-988. doi:10.1227/01.NEU.0000053152.45258.74
- P. Georgiadis, D. Cavouras, A. Daskalakis, K. Sifaki, M. Malamas, G. Nikiforidis and E. Solomou, “PDA-Based System with Teleradiology and Image Analysis Capabilities,” Annual International Conference of the IEEE Engineering in Medicine and Biology Society, Lyon, 22-26 August 2007, pp. 3090-3093. doi:10.1109/IEMBS.2007.4352981
- D. K. Kim, E. Y. Kim, K. H. Yang, C. K. Lee and S. K. Yoo, “A Mobile Tele-Radiology Imaging System with JPEG2000 for an Emergency Care,” Journal of Digital Imaging, Vol. 24, No. 4, 2011, pp. 709-718. doi:10.1007/s10278-010-9335-0
- A. J. Doyle, J. Le Fevre, and G. D. Anderson, “Personal Computer versus Workstation Display: Observer Performance in Detection of Wrist Fractures on Digital Radiographs,” Radiology, Vol. 237, No. 3, 2005, pp. 872- 877. doi:10.1148/radiol.2373041439
- R. J. Toomey, J. T. Ryan, M. F. McEntee, M. G. Evanoff, D. P. Chakraborty, J. P. McNulty, D. J. Manning, E. M. Thomas and P. C. Brennan, “Diagnostic Efficacy of Hand-Held Devices for Emergency Radiological Consultation,” American Journal of Roentgenology, Vol. 194, No. 2, 2010, pp. 469-474. doi:10.2214/AJR.09.3418
- M. F. McEntee, J. Lowe, M. L. Butler, M. Pietrzyk, M. G. Evanoff, J. Ryan, P. C. Brennan and L. A. Rainford, “iPads and LCDs Show Similar Performance in the Detection of Pulmonary Nodules,” Proceedings of the Society of Photo-Optical Instrumentation, Vol. 8318, 2012, Article ID: 83180C.
- P. Mc Laughlin, S. O. Neill, N. Fanning, A. M. Mc Garrigle, O. J. Connor, G. Wyse and M. M. Maher, “Emergency CT Brain: Preliminary Interpretation with a Tablet Device: Image Quality and Diagnostic Performance of the Apple iPad,” Emergency Radiology, Vol. 19, No. 2, 2012, pp. 127-133. doi:10.1007/s10140-011-1011-2
- J. A. Mitchell, “Smartphone Client-Server Teleradiology System for Primary Diagnosis of Acute Stroke,” Journal of Medical Internet Research, Vol. 13, No. 2, 2011, Article ID: e31. doi:10.2196/jmir.1732
- F. H. Tang, M. Y. Law, A. C. Lee and L. W. Chan, “A Mobile Phone Integrated Health Care Delivery System of Medical Images,” Journal of Digital Imaging, Vol. 17, No. 3, 2004, pp. 217-225. doi:10.1007/s10278-004-1015-5
- S. Tachakra, K. A. Banitsas and F. Tachakra, “Performance of a Wireless Telemedicine System in a Hospital Accident and Emergency Department,” Journal of Telemedicine and Telecare, Vol. 12, No. 6, 2006, pp. 298-302. doi:10.1258/135763306778558169
- K. Phabphal and S. Hirunpatch, “The Effectiveness of Low-Cost Teleconsultation for Emergency Head Computer Tomography in Patients with Suspected Stroke,” Journal of Telemedicine and Telecare, Vol. 14, No. 8. 2008, pp. 439-442. doi:10.1258/jtt.2008.080603
- B. K. Patel, C. G. Chapman, N. Luo, J. N. Woodruff and V. M. Arora, “Impact of Mobile Tablet Computers on Internal Medicine Resident Efficiency,” Archives of Internal Medicine, Vol. 172, No. 5, 2012, pp. 436-438. doi:10.1001/archinternmed.2012.45
- P. T. Johnson, S. L. Zimmerman, D. Heath, J. Eng, K. M. Horton, W. W. Scott and E. K. Fishman, “The iPad as a Mobile Device for CT Display and Interpretation: Diagnostic Accuracy for Identification of puLmonary Embolism,” Emergency Radiology, Vol. 19, No. 4, 2012, pp. 323-327. doi:10.1007/s10140-012-1037-0
- D. Schulze and M. Heiland, “Diagnostic Advantages and Possibilities for Secondary Reconstruction of NewTom 9000 Data Sets Using eFilm,” International Journal of Computerized Dentistry, Vol. 7, No. 1, 2004, pp. 61-66.
- L. C. Ebert, W. Ptacek, M. Fürst, S. Ross, M. J. Thali and G. Hatch, “Minimally Invasive Postmortem Telebiopsy,” Journal of Forensic Sciences, Vol. 57, No. 2, 2012, pp. 528-530. doi:10.1111/j.1556-4029.2011.01990.x
- H. A. Gratama van Andel, H. W. Venema, C. B. Majoie, G. J. Den Heeten, C. A. Grimbergen and G. J. Streekstra, “Intracranial CT Angiography Obtained from a Cerebral CT Perfusion Examination,” Medical Physics, Vol. 36, No. 4, 2009, pp. 1074-1085. doi:10.1118/1.3078043
- F. H. Xu, W. J. Chen, Y. J. Yang, Y. X. Duan and F. L. Fu, “Evaluation of Multislice Computed Tomographic Perfusion Imaging and Computed Tomographic Angiography on Traumatic Cerebral Infarction,” Chinese Journal of Traumatology, Vol. 11, No. 3, 2008, pp. 186-189. doi:10.1016/S1008-1275(08)60039-5
- M. A. Ezzeddine, M. H. Lev, C. T. McDonald, G. Rordorf, J. Oliveira-Filho, F. G. Aksoy, J. Farkas, A. Z. Segal, L. H. Schwamm, R. G. Gonzalez and W. J. Koroshetz, “CT Angiography with Whole Brain Perfused Blood Volume Imaging: Added Clinical Value in the Assessment of Acute Stroke,” Stroke, Vol. 33, No. 4, 2002, pp. 959-966. doi:10.1161/hs0402.105388
- A. Xyda, U. Haberland, E. Klotz, K. Jung, H. C. Bock, R. Schramm, M. Knauth and P. Schramm, “Diagnostic Performance of Whole Brain Volume Perfusion CT in Intra-Axial Brain Tumors: Preoperative Classification Accuracy and Histopathologic Correlation,” European Journal of Radiology, Vol. 81, No. 12, 2012, pp. 4105-4111. doi:10.1016/j.ejrad.2012.08.005
- P. F. Judy and R. G. Swensson, “Display Thresholding of Images and Observer Detection Performance,” Journal of the Optical Society of America A, Vol. 4, No. 5, 1987, pp. 954-965. doi:10.1364/JOSAA.4.000954
- K. Bacher, P. Smeets, A. De Hauwere, T. Voet, P. Duyck, K. Verstraete and H. Thierens, “Image Quality Performance of Liquid Crystal Display Systems: Influence of Display Resolution, Magnification and Window Settings on Contrast-Detail Detection,” European Journal of Radiology, Vol. 58, No. 3, 2006, pp. 471-479. doi:10.1016/j.ejrad.2005.12.016
- M. Sasaki, M. Ida, K. Yamada, Y. Watanabe and M. Matsui, “Standardizing Display Conditions of DiffusionWeighted Images Using Concurrent b0 Images: A Multivendor Multi-Institutional Study,” Magnetic Resonance in Medical Sciences, Vol. 6, No. 3, 2007, pp. 133-137. doi:10.2463/mrms.6.133
- U. E. Anwer, “Essential Investigations of Patients with Suspected TIAs,” European Neurology Vol. 39, No. 1, 1998, pp. 17-20. doi:10.1159/000052065
- S. Ruchholtz, C. Waydhas, T. Schroeder, K. Piepenbrink, H. Kühl and D. Nast-Kolb, “The Value of Computed Tomography in the Early Treatment of Seriously Injured Patients,” Neurochirurgie, Vol. 73, No. 10, 2002, pp. 1005- 1012. doi:10.1007/s00104-002-0429-1
- J. W. Van Goethem, M. Maes, O. Ozsarlak, L. van den Hauwe and P. M. Parizel, “Imaging in Spinal Trauma,” European Radiolog, Vol. 15, No. 3, 2005, pp. 582-590. doi:10.1007/s00330-004-2625-5
- H. G. Deen, Jr., “Diagnosis and Management of Lumbar Disk Disease,” Mayo Clinic Proceeding, Vol. 71, No. 3, 1996, pp. 283-287. doi:10.4065/71.3.283
- S. M. Papadopoulos, N. R. Selden, D. J. Quint, N. Patel, B. Gillespie and S. Grube, “Immediate Spinal Cord Decompression for Cervical Spinal Cord Injury: Feasibility and Outcome,” Journal of Trauma, Vol. 52, No. 2, 2002, pp. 323-332. doi:10.1097/00005373-200202000-00019
- M. A. Haider, “Extending PowerPoint with DICOM image support,” Radiographics, Vol. 23, No. 6, 2003, pp. 1683-1687. doi:10.1148/rg.236035074
- T. Gillespy and A. H. Rowberg, “Dual Lookup Table Algorithm: An Enhanced Method of Displaying 16-Bit Gray-Scale Images on 8-Bit RGB Graphic Systems,” Journal of Digital Imaging, Vol. 7, No. 1, 1994, pp. 13- 17. doi:10.1007/BF03168474
- L. C. Ebert, G. Hatch, G. Ampanozi, M. J. Thali and S. Ross, “You Can’t Touch This: Touch-Free Navigation through Radiological Images,” Surgical Innovation, Vol. 19, No. 3, 2012, pp. 301-307. doi:10.1177/1553350611425508
- A. F. Choudhri, T. M. Carr III, C. P. Ho, J. R. Stone, S. B. Gay and D. L. Lambert, “Handheld Device Review of Abdominal CT for the Evaluation of Acute Appendicitis,” Journal of Digital Imaging, Vol. 25, No. 4, 2012, pp. 492-496. doi:10.1007/s10278-011-9431-9
- F. Nicoli, Y. Lefur, B. Denis, J. P. Ranjeva, S. Confort-Gouny and P. J. Cozzone, “Metabolic Counterpart of Decreased Apparent Diffusion Coefficient during Hyperacute Ischemic Stroke: A Brain Proton Magnetic Resonance Spectroscopic Imaging Study,” Stroke, Vol. 34, No. 7, 2003, pp. e82-87. doi:10.1161/01.STR.0000078659.43423.0A
- C. H. Sotak, “The Role of Diffusion Tensor Imaging in the Evaluation of Ischemic Brain Injury—A Review,” NMR in Biomedicine, Vol. 15, No. 7-8, 2002. pp. 561-569. doi:10.1002/nbm.786
- B. K. Kang, D. G. Na, J. W. Ryoo, H. S. Byun, H. G. Roh and Y. S. Pyeun, “Diffusion-Weighted MR Imaging of Intracerebral Hemorrhage,” Korean Journal of Radiology Vol. 2, No. 4, 2001, pp. 183-191. doi:10.3348/kjr.2001.2.4.183
- R. A. Zimmerman, “Pediatric Cerebrovascular Disease,” JBR-BTR, Vol. 83, No. 5, 2000, pp. 245-252.
- G. C. Zheng, L. Tieqiang and T. Hindmarsh, “Diffusion MRI Studies of Experimental Animal Models and Patients with Stroke,” Chinese Medical Journal, Vol. 112, No. 2, 1999, pp. 176-181.
- B. C. Chu and K. Miyasaka, “The Clinical Application of Diffusion Weighted Magnetic Resonance Imaging to Acute Cerebrovascular Disorders,” No To Shinkei, Vol. 50, No. 9, 1998, pp. 787-795.
- A. Korge, C. J. Siepe, F. Heider and H. M. Mayer, “Total Cervical Disk Replacement-Implant-Specific Approaches: Keel Implant (Prodisc-C Intervertebral Disk Prosthesis),” Oper Orthop Traumatol, Vol. 22, No. 5-6, 2010, pp. 480- 494.
- R. W. Katzberg, P. F. Benedetti, C. M. Drake, M. Ivanovic, R. A. Levine, C. S. Beatty, W. R. Nemzek, R. A. McFall, F. K. Ontell, D. M. Bishop, V. C. Poirier and B. W. Chong, “Acute Cervical Spine Injuries: Prospective MR Imaging Assessment at a Level 1 Trauma Center,” Radiology, Vol. 213, No. 1, 1999, pp. 203-212.
- B. B. Forster and R. A. Koopmans, “Magnetic Resonance Imaging of Acute Trauma of the Cervical Spine: Spectrum of Findings,” Canadian Association of Radiologists Journal, Vol. 46, No. 3, 1995, pp. 168-173.
- S. J. Davis, L. M. Teresi, W. G. Bradley Jr., M. A. Ziemba and A. E. Bloze, “Cervical Spine Hyperextension Injuries: MR Findings,” Radiology, Vol. 180, No. 1, 1991, pp. 245-251.
- S. C. Saur, H. Alkadhi, P. Stolzmann, S. Baumüller, S. Leschka, H. Scheffel, L. Desbiolles, T. J. Fuchs, G. Székely and P. C. Cattin, “Effect of Reader Experience on Variability, Evaluation Time and Accuracy of Coronary Plaque Detection with Computed Tomography Coronary Angiography,” European Journal of Radiology, Vol. 20, No. 7, 2010, pp. 1599-606. doi:10.1007/s00330-009-1709-7
- E. C. van Straaten, P. Scheltens, D. L. Knol, M. A. van Buchem, E. J. van Dijk, P. A. Hofman, G. Karas, O. Kjartansson, F. E. de Leeuw, N. D. Prins, R. Schmidt, M. C. Visser, H. C. Weinstein and F. Barkhof, “Operational Definitions for the NINDS-AIREN Criteria for Vascular Dementia: An Interobserver Study,” Stroke, Vol. 34, No. 8, 2003, pp. 1907-1912. doi:10.1161/01.STR.0000083050.44441.10
- M. Keberle, W. Kenn, H. Müller and D. Hahn, “Interobserver Variability in CT of oroand Hypopharyngeal Carcinomas,” Rofo, Vol. 173, No. 7, 2001, pp. 583-590. doi:10.1055/s-2001-15833
- P. T. de Souza Figueiredo, A. F. Leite, F. R. Barra, R. F. Dos Anjos, A. C. Freitas, L. A. Nascimento, N. S. Melo and E. N. Guerra, “Contrast-Enhanced CT and MRI for Detecting Neck Metastasis of Oral Cancer: Comparison between Analyses Performed by Oral and Medical Radiologists,” Dentomaxillofacial Radiology, Vol. 41, No. 5, 2012, pp. 396-404. doi:10.1259/dmfr/57281042
- Q. Y. Lee, G. S. Chan, S. J. Redmond, P. M. Middleton, E. Steel, P. Malouf, C. Critoph, G. Flynn, E. O’Lone and N. H. Lovell, “Multivariate Classification of Systemic Vascular Resistance Using Photoplethysmography,” Physiological Measurement, Vol. 32, No. 8, 2011, pp. 1117- 1132. doi:10.1088/0967-3334/32/8/008
- A. Ozcan, Y. Karslioglu, B. Kurt, O. Onguru and O. Gunhan, “Quantitative Evaluation of Immunohistochemical Staining in Gastrointestinal Stromal Tumors,” Analytical & Quantitative Cytology & Histology, Vol. 29, No. 3, 2007, pp. 159-165.
- R. Cannings, K. Hawthorne, K. Hood and H. Houston, “Putting Double Marking to the Test: A Framework to Assess If It Is Worth the Trouble,” Medical Education, Vol. 39, No. 3, 2005, pp. 299-308. doi:10.1111/j.1365-2929.2005.02093.x
- U. Garske, A. Haack, O. Beltrán, L. F. Flores-Suárez, J. P. Bremer, P. Lamprecht, J. Hedderich, J. Quetz, W. L. Gross, P. Ambrosch and M. Laudien, “Intraand Inter-Rater Reliability of Endonasal Activity Estimation in Granulomatosis with Polyangiitis (Wegener’s),” Clinical and Experimental Rheumatology, Vol. 30, Suppl. 70, 2012, pp. 22-28.
- I. Fletcher, M. Mazzi and M. Nuebling, “When Coders are Reliable: The Application of Three Measures to Assess Inter-Rater Reliability/Agreement with Doctor-Patient Communication Data Coded with the VR-CoDES,” Patient Education and Counseling, Vol. 82, No. 3, 2011, pp. 341-345. doi:10.1016/j.pec.2011.01.004
- A. B. Patel, A. Amin, S. Z. Sortey, A. Athawale and H. Kulkarni, “Impact of Training on Observer Variation in Chest Radiographs of Children with Severe Pneumonia,” Indian Pediatrics, Vol. 44, No. 9, 2007, pp. 675-681.
- J. L. Fleiss, “Statistical Methods for Rates and Proportions,” 2nd Edition, John Wiley, New York, 1981, pp 38-46.
Abbreviation
CTA = Computed Tomography Angiogram MRI = Magnetic Resonance Imaging ACA =Anterior Cerebral Artery PCA = Posterior Cerebral Artery
NOTES
*Corresponding author.