Open Journal of Social Sciences
Vol.02 No.04(2014), Article ID:44112,14 pages
10.4236/jss.2014.24023
Competitive Advantage of Nations and Multilateral Trade System: How Can Lebanon Benefit from Trade Liberalization without Enhancing Its Strategic Industries?
Georges N. Nehme1, Eliane Nehme2
1Faculty of Business Administration, Antonine University, Baabda, Lebanon
2Faculty of Economic Science and Business Administration, Lebanese University, Achrafieh, Lebanon
Email: g.n.nehme@gmail.com, elianenehme@yahoo.com
Copyright © 2014 by authors and Scientific Research Publishing Inc.
This work is licensed under the Creative Commons Attribution International License (CC BY).
http://creativecommons.org/licenses/by/4.0/


Received 18 November 2013; revised 23 December 2013; accepted 1 January 2014
ABSTRACT
International trade theories explain the advantage of nations to adopt a liberal trade model and to participate in the multilateral trade system via liberalizing their systems by eliminating trade qu- otas, tariff barriers and other forms of protectionism. The influence of international institutions on trade flow, mainly the World Trade Organization (WTO), has been important. The WTO contributed by helping and advising governments so that they would benefit from multilateral agreements by granting preferential treatments for developing countries joining the institution, and making them learn from other countries’ experiences in the accession process. Both liberalizing and protecting local production have advantages and weaknesses; how do existing theories about trade policy explain this landscape? Liberalizing the economy proved to be beneficial for some countries, while others suffered from distasting consequences on domestic production, employment and purchasing power. Some researches explained that large-scale changes in political institutions, especially in the direction of democracy, may be necessary for the kind of massive trade liberalization that has occurred. Changes in preferences cannot be overlooked in some economies while explaining the rush to free trade. The reciprocal impact of trade on domestic policies and the international political system is important. Analyzing the hypotheses about nation’s competitiveness and its dependence on the capacity of its industry to innovate and upgrade deems indispensable. This paper will be testing the relevancy from applying Michael Porter’s diamonds theory and the Heckscher-Ohlin-Samuelson model on developing economies, mainly Lebanon, in order to gain national competitive advantages while having strong regional and international rivals. Do companies gain advantage against the world’s best competitors because of pressure and challenges? Lebanese productive companies are suffering from lack of competitiveness because of weak governmental support and absence of public planning to enhance strategic industries by developing a strong flexible export based model. With a 2.6 billons dollars deficit of its balance of payment, how can Lebanese government join the WTO and liberalize its trade system while avoiding its negative impact on national and social prosperity?
Keywords:
International Trade; Competitive Advantage; Preferential Treatment

1. Introduction
Predicting that trade will bring international convergence of factor prices has important effects, although it is controversial. Factor prices are not the same in all countries, and the theory predicts that any barriers to trade or any international differences in technology will limit factor price convergence. Despite this limitation to theory, the idea that trade may lead to an international convergence of factor prices is of great importance in a number of contexts [1] . It suggests that openness to trade is a good policy for a less developed country seeking to raise the wages of unskilled labor. A less developed country is likely to have a comparative advantage in products that require intensive unskilled labor, by exporting these products the country will raise the demand for unskilled la- bor and bid up their wages.
Trade theories consider that comparative advantage determines the pattern of trade. The two main sources of comparative advantages are cross-country differences in technology and in endowments of stocks of labor, cap- ital and other resources in a country. These differences are caused by different intensities of “R and D” research and development activity and different speeds of absorption of new technologies in different countries [1] .
A deep study of this landscape may consider two main remarks:
1) As technology is itself internationally tradable, it will not offer a comparative advantage to a country. Only the continuous effort in research and development may ensure a basis for a comparative advantage;
2) If technological leadership is a possible source of comparative advantage, then policy makers have to know what determines technological leadership. Research achievements have to tackle this problematic issue by de- termining what gives a country a comparative advantage in research and development.
Each country can benefit from quantities of natural resources, land of different types, labor of different skill levels and physical capital of different sorts (machines, roads, houses…). Each of these human and physical re- sources is considered as a separate factor of production. Endowments of the economy, which represent the col- lective stocks of factors of production, may change over time because of saving and education. In each period, endowment determines the productive potential of the economy, its relative productivity, and hence, its compar- ative advantage in the international trade system and flows.
2. The HOS Model
Eli Hecksher, Bertil Ohlin, Paul Samuelson and Wolfgang Stopler presented through different periods1 the well-known “HOS model of trade” that tackles the relationship between the economy’s endowment and its comparative advantage. The model considers two observations:
1) Economies differ in the relative quantities of their different factors of production;
2) Production of different goods requires the usage of factors of production in different proportions.
The mix of these observations signifies that countries will have a comparative advantage in goods that are rel- atively intensive in users of the factor of production with which they are relatively well endowed [1] .
The HOS [2] model presents four basic theorems:
1) The factor price equalization theorem;
2) The Stopler-Samuelson theorem;
3) The Rybczynski theorem;
4) The Hecksher-Ohlin theorem.
2.1. The Factor Price Equalization Theorem
This theorem gives conditions under which trade in commodities is a perfect substitute for the international mo- bility of factors of production. If the real return to labor is the same in two different countries, there is no incen- tive for international migration of human capital. In this theorem, there are conditions under which trade does equate these returns. When these conditions are applied, trade in commodities may be a perfect substitute for trade in factors.
2.2. The Stopler-Samuelson Theorem
This theorem gives conditions under which a change in relative commodity prices has an unambiguous effect on real factors returns. It supposes that there are constant returns to scale in different sectors, no factor intensity re- versals, and incomplete specialization. Under these circumstances, an increase in the relative price of good in- creases the real return to the factor that is used intensively in the production of that good, and decreases the real return to other factors.
2.3. The Rybczynski Theorem
This theorem shows how a change in factor alters production, holding fixed all prices. It supposes that there are no factor intensity reversals, and the economy is incompletely specialized. Under these circumstances and hold- ing commodity prices constant, an increase in a factor of production leads to a more than proportional increase in output that uses that factor intensively, and a decrease in output of other factors.
2.4. The Hecksher-Ohlin Theorem
This theorem shows the relation between relative factor endowments and comparative advantage. It proves that if two countries have the same constant returns to scale technology with no factor intensity reversals then the country has a comparative advantage in the commodity that uses intensively the factor in which the country is relatively well endowed.
3. The Leontief Paradox
It was not easy to prove the relevancy of the Hecksher-Ohlin-Samuelson model in empirical experiences. In the first attempt to test this model, Wassily Leontief [3] found that, contrary to expectations, the imports of the USA were more capital intensive than its exports. This perverse finding was probably due to the fact that Leontief failed to distinguish between skilled and unskilled workers, and hence failed to capture the skilled labor intensity in USA exports [1] . More recent studies have disaggregated countries’ factor endowments by looking at seven types of labor, three types of land, and physical capital, but still found only weak evidence of the relevancy of the HO model [4] .
Hecksher-Ohlin-Samuelson model has more to offer than the observation that countries have a comparative advantage by endowment of factors of production. It also provides a structure within which it is possible to in- vestigate the effects of trade on prices of different factors of production, wages of skilled and unskilled labor, land rents, and the return on capital [1] .
4. Trade and Market Structure
Analysis of the impact of market structure on flows of trade is based on two very strong assumptions:
1) If a country imports a product, it does not also export products of the same industry; we may assume that that all trade is inter-industry. In reality, a high proportion of trade is intra-industry, involving a country both exporting and importing products of the same industry.
2) Markets are perfectly competitive, ignoring issues to do with market structure or firms’ market power.
These two assumptions are closely related; how market structure less than perfectly competitive generates in- tra-industry and well as inter-industry trade?
4.1. The Pattern of Trade
Why should a country both import and export products of the same industry?
1) The first explanation relies on the variety concept. Within most industries, output consists of the production of differentiated goods; different firms produce different varieties of product. If each variety appeals to some consumers in each country, we expect to have intra-industry trade, with home varieties being exported and for- eign varieties being imported.
2) The second explanation relies on the behavior of firms in monopolistic markets. If markets are imperfectly competitive, firms will have an incentive to try to export to the foreign market. Foreign firms have the same in- centive. The natural process of competition between firms will generate intra-industry trade [5] .
4.2. Gains from Intra-Industry Trade
For the purpose of analyzing the gains generated from intra-industry trade, this model add two further potential sources of gain:
1) The product variety effect of trade; trade presents consumers with an increased range of varieties. This ef- fect is difficult to quantify, few economists would deny that people would be impoverished if imported varieties of goods ceased to be available;
2) The pro-competitive effect of trade; considering a monopolistic industry in an initial position with no in- ternational trade.
Products in such structure are subject to increasing returns to scale and the number of firms is determined by the condition that there are no abnormal profits in the long run [6] .
Figure 1 below describes the situation of this industry:
· Marginal costs are represented by the curve MC;
· Average costs are represented by the curve AC;
· Marginal revenue is represented by the line MR;
· Average revenue is represented by the line AR;
· Increasing returns to scale mean that average costs AC are falling with output;
· Marginal revenue MR, and average revenue AR curves are downward sloping;
· The equilibrium is at point A with output Qa and price Pa.
At the equilibrium A, the firm chooses output to maximize profits (production is where MR = MC), and the number of firms in the industry adjusted to give zero profits (AR = AC). The key point of this figure, is that AR is below AC everywhere except at point A. where it is tangential to it, in other words, the best a firm can do is make zero profits.
What is the effect of trade on this industry? We may assume that there are two identical economies, contain- ing the same number of firms. Reducing trade barriers causes intra-industry trade to occur, as each firm exports as well as supplying its domestic market. Each market is supplied by both home and foreign firms.

Figure 1. Equilibrium of a firm in a monopolistic competition before and after trade [1] .
This increase in competition will squeeze price-cost margins and hence force some firms out of business be- cause of bankruptcy or merger phenomena. Remaining firms become larger and gain market share, increasing returns to scale and having lower Average costs AC. Increased competition means that average revenue AR curve becomes flatter. The new AR is illustrated by the line Art, and equilibrium is at point T, where AC is tan- gential to Art. Each remaining firm’s scale has increased, from Qa to Qt, with increasing return to scale, so av- erage cost and price are now lower, with price falling from Pa to Pt.
The lower price, lower average cost and increased exploitation of economies of scale provide an additional source of gain from trade. At the end, we may note that effects of trade are more firms supplying each market, and hence more intense competition, and fewer firms producing in each country, with the remaining firms larger and operating at lower average costs, source of efficiency gain in addition to the comparative advantage gains and variety effects.
Three main remarks bring additional clarification to the above mentioned trade model:
1) The gains come from increased competition driving firms down their average cost curves. Nevertheless, it may be also the case that an increased intensity of competition forces firms to improve their internal organiza- tion, thus reducing costs further.
2) The potential pro-competitive effects of trade can be frustrated by small trade barriers. Obstacles to trade, differing national products standards and a pro-domestic bias in government procurement policies, seemed to be allowing firms to retain dominant positions in their domestic market.
3) The qualification that it is not necessarily the case that all countries are gainers, especially in case of im- plementing trade barriers.
Considering an industry with extreme increasing returns to scale such as the aircraft industry. Supposing that returns to scale are larger enough that, when trade barriers are high and there is no trade, each country has just a single monopolistic firm. Figure 2(a) illustrates this industry, where MC and AC curves are drawn, and ARa and MRa are the average and marginal revenue curves faced by the firm. The firm produces at Qa and charges price Pa. Average cost at this level of output is ACa. Since Pa exceeds ACa the firm makes abnormal profits given by the area IIa. However, these profits are not enough to encourage the entry of a second firm in order to have a more competitive market structure.
When trade is liberalized, firms compete squeezing their profit margins. Figure 2(b) illustrates the same cost curves as Figure 2(a), but the average and marginal revenue curves correspond to those that would be faced by the firm if it were duopolistic, that is, a domestic monopolist competing in world markets with a single foreign firm. These curves are labeled ARd and MRd; increased competition makes the average revenue curve flatter. ARd is below AC, confirming that in duopolistic situation, firms are bound to make losses. The minimum at- tainable loss is the area L. this means that one firm must exit the market.
After the exit of one firm, the remaining one become monopolistic at the world level and has the average and marginal revenue curves ARt and MRt as illustrated in Figure 2(c). this firm sets price Pm and makes profits given by the area IIt.
According to this model, trade causes one firm to exit the market and the other to become o world monopolis- tic. Who are the gainers and losers according to it?
Increasing returns to scale means that average costs fall, so the world is getting the product more efficiently. The country that is importing the product has to pay the monopoly price Pm shown in Figure 2(c), whereas be- fore it was paying the average cost of production ACa shown in Figure 2(a). This makes the importing economy as a whole worse off, the real cost per unit increased from ACa to Pm. The loss comes from the disappearance of the profits IIa in Figure 2(a) in the importing economy. This result is known as the profit shifting effects of trade. The remaining firm makes larger profits: the area IIt id bigger that the area IIa.
As a result, the gains from trade will be many times larger than is suggested by comparative advantage alone. However, a large range of possibilities may arise in such industry. Large gains are likely, but it is certainly possible to construct examples where one economy loses from opening up to trade.
5. The Competitive Advantage of Nations
According to Michael Porter [7] , national prosperity is created, not inherited. Controversially to the Hecksher- Ohlin-Samuelson model, it does not grow out of a country’s natural endowments, its labor pool, its interest rates, or its currency’s value. Porter argues that a nation’s competitiveness depends on the capacity of its industry to
 (a)
(a) (b)
(b) (c)
(c)
Figure 2. (a) Monopoly before trade [1] ; (b) Duopoly with trade [1] ; (c) Monopoly at a world level [1] .
innovate and upgrade. Companies gain advantage against the world’s best competitors because of pressure and challenge. They may benefit from having strong domestic rivals, aggressive domestic suppliers and demanding local consumers. Competitive advantage is created and sustained via a localized and structured national process. National values, organizational culture, economic structures may contribute deeply to competitive success. There are striking differences in the patterns of competitiveness in every country; no nation can achieve compet- itive advantage in all sectors. They may achieve it in particular industries depending on the national or regional environment and benefits that it can procure to their growth and development [7] .
According to prevailing economic theories, labor costs, interest rates, exchange rates, and economies of scale are the most potent determinants of competitiveness. Nowadays, mergers, alliances, strategic partnerships are key choices for a company’s and nation’s competitiveness. Managers are pressing for more government support for particular industries [8] .
5.1. International Success of Companies: Information and Innovation
Companies achieve competitive advantage through innovation process. They approach innovation via technolo- gies and new ways of production. They may perceive a new basis for competing or create better means of com- peting in old initial ways. Innovation can be illustrated in a new product design, new marketing strategy, training of employees and a new production process. Achieving a higher level of innovation should be incremental, de- pending on more deployed and continuous efforts in different areas of the production process. It often proposes new ideas never vigorously pursued. It always involves investments in skill and knowledge, as well as in physi- cal assets and brand reputations [8] .
Some innovations create competitive advantage by perceiving and entirely new market opportunity or by serving a market segment that competitors have ignored, “when competitors are slow to respond, such innova- tion yields competitive advantage” [7] .
In international markets, information that is not available to competitors plays a large role in the process of innovation and improvement. According to Porter, it may come from simple investment in research and devel- opment or market research, from openness and from looking in the right place unencumbered by blinding as- sumptions or conventional wisdom.
Innovation May Come from Four Different Sources
1) A new company, whose founder has a nontraditional background or was simply, not appreciated in an older established company;
2) Into an existing company through senior managers who are new to the particular industry and thus more able to perceive opportunities and more likely to pursue them;
3) When a company diversifies, bringing new resources, skills, or perspectives to another industry;
4) Another nation with different circumstances or different ways of competing, in relation with the culture and the know-how implemented previously.
According to Vivek Suneja [8] , innovation is the result of unusual effort. Once a company achieves competi- tive advantage through innovation, it can sustain it only through relentless improvement; almost any advantage can be imitated. Competitors will eventually and inevitably overtake any company that stops improving and in- novating. Sometimes early-movers advantages such as customer retention, economies of scale and the exclusiv- ity of the distribution channels, are enough to permit a stagnant company to retain its entrenched position for years or even decades. But sooner or later, more dynamic competitors will find a way to innovate around these advantages or create a better or cheaper way of doing things [8] .
5.2. Determinants of National Competitive Advantage: The Diamond
Michael Porter’s diamond of national competitive advantage tackles the playing field that each country estab- lishes and operates in order to reinforce its strategic industries and benefit from the international flow of trade. The diamond’s attributes, as shown in Figure 3, consist of the following fields:
1) Factors of production conditions: skilled labor, nations’ infrastructure, necessary to compete in a specific industry;
2) Demand conditions: the nature of domestic demand for the goods and services produced in a specific in- dustry;
3) Related and supporting industries: suppliers who may play a major role in reinforcing strategic capabilities and competencies;
4) Firm strategy and market structure: organizational history, companies creation, management as well as the nature of home-based rivalry and competition.
These determinants may sincerely help firms to achieve competitive advantage at the world level via creating a supporting environment that ensure facilitations and incentives. Each field affects essential ingredients for achieving international competitive advantage. Porter argues that the diamond works as a system where all de- terminants are interdependent and need to be realized concurrently: “the availability of resources and skills ne- cessary for competitive advantage in an industry; the information that shapes the opportunities that companies perceive and the directions in which they deploy their resources and skills; the goals of the owners, managers, and individuals in companies; and, most important, the pressures on companies to invest and innovate” [7] .
5.2.1. Factor Conditions
According to standard economic theory, the following factors of production determine the flow of trade: labor, land, natural resources, capital and infrastructure. The HOS model obviously powered that a nation export those goods that make most use of the factors with which it is relatively well endowed. According to Michael Porter, this doctrine whose origins date back to Adam Smith and David Ricardo, is at best incomplete and at worst in- correct [8] . In the sophisticated industries that form the backbone of any advanced economy, a nation does not inherit but instead creates the most important factors of production, such as skilled human resources or scientific base [7] . Moreover, the stock of factors that a nation enjoys at a particular time is less important than the rate and efficiency with which it creates, upgrades, and deploys them in particular industries. Nations succeed in in- dustries where they are particularly good at factor creation. Implicit in the oft-repeated Japanese statement “We are an island nation with no natural resources”.
5.2.2. Demand Conditions
According to economic theory, globalization of competition would diminish the importance of domestic demand. According to Porter, this is simply not the case. Nations gain competitive advantage in sectors where the domes- tic demand gives their companies a clearer or earlier picture of emerging buyer needs, and where demanding buyers pressure companies to innovate faster and achieve more sophisticated competitive advantages than their

Figure 3. Determinants of national competitive advantage [8] .
foreign competitors. Home-demand conditions help build competitive advantage when a particular industry segment is larger or more visible in the domestic market than in foreign markets. The larger market in a nation receive the most attention from the nation’s companies; who accord smaller or less desirable segments a low priority.
5.2.3. Related and Supporting Industries
The presence in the nation of related and supporting industries that are internationally competitive is a main condition to achieve and sustain a national competitive advantage. Internationally home-based suppliers deliver the most cost-effective inputs in an efficient, early, rapid, and sometimes preferential way. Suppliers and end- users located near each other can take advantage of short lines of communication, quick and constant flow of information, and ongoing exchange of ideas and innovations. Firms have the opportunity to influence their sup- pliers’ technical efforts and can serve as test sites for research and development work, accelerating the pace of innovation. Information flow and technical interchange speed the rate of innovation and upgrading, it also pro- vides a source of entrants who will bring a novel approach to accelerated competition.
5.2.4. Firm Strategy and Market Structure
Porter argues that national circumstances and context create strong tendencies in how firms are created, orga- nized, and managed, as well as the domestic competition will be. Competitiveness in a specific industry results from convergence of the management practices and organizational culture favored in the country and the sources of competitive advantage in the industry. Individual motivation to work and expand skills is also important to achieve competitive advantage. Outstanding talent may be a scarce resource in a country. A national success depends on the types of educating its talented people, who choose to work and invest by deploying their efforts and showing their skills and competencies [7] .
The presence of strong competitors is a final and powerful stimulus to the creation and persistence of compet- itive advantage. Domestic rivalry creates pressure on firms to innovate and improve. Local competitors push each other to lower costs, improve quality and service, and create new products and processes [8] .
6. Lebanon’s Economy
After four consecutive years of solid economic growth, Table 1 reveals that the Lebanese economy lost its mo- mentum starting 2011 and registered modest growth rate in 2012 due to internal political instability and due to external problems in some Arab countries, notably Syria. Exports to Arab countries were remarkably affected as well as tourism. In addition, the real estate sector activity dropped starting 2011 after four years of strong growth. Foreign direct investment has also registered a decline, while transfers maintained their pace to represent the permanent support of domestic consumption.
6.1. Deficit of the Trade Balance
Graph 1 show that, according to banks’ association in Lebanon, in 2010, the deficit in the trade balance in- creased to USD 13711 million against USD 12758 million in 2009, registering an increase of one billion dollar while the economy maintained its high performance scoring very high growth rate. This is due to the increase in the value of goods imports, as a result of the rise in world prices and the moderate increase of imported quanti-

Table 1. GDP, current account, real growth rate, and inflation [13] .
ties. Consequently, the rate of coverage of imports by exports increased to 23.7% in 2010, compared to 21.5% in 2009 and 21.6% in 2008.
According to Graph 1, imports of goods reached USD 17964 million in 2010, with an increase of 10.6% com- pared to 2009 while the imported quantities increased by 2.5% according to central bank statistics. The value of imports has been influenced by the rise of goods prices and the increase of imported quantities. The value of imported industrial machines reached a record level of USD 227 million in 2010 with an increase of 14.1% compared to 2009. The 2.5% increase of imports does not represent the real evolution of imported goods of dif- ferent types. Some goods witnessed an increase in imported quantities while others registered a decrease.
Exports of goods increased in 2010 to attain USD 4235 million, a 22.1% increase compared to 2009 as per Graph 2. In addition, the exported quantities increased by 5.0%. The main reason of this remarkable increase is the exports of military equipments for the United Nations Interim Force in Lebanon UNIFIL, a value of USD 332 million. Once the proper correction is done, we may confirm that the increase of exported goods registered only 12.5%. The increase of exports is not due to the increase of precious or semi-precious stones. It is due to the increase of exports in machinery and mechanical appliances, base metals, chemical and vegetables products. Thus the above-mentioned increase of exported quantities does not represent the effective evolution of all im- ported goods since Lebanon scored a decrease of 24% of the exported mineral products.
6.2. Imports and Exports Composition
According to central administration statistics, Graph 2 displays that Lebanon’s imported goods are composed mainly of Mineral products, followed by machinery and mechanical appliances, transport equipment, chemical products, and base metals.
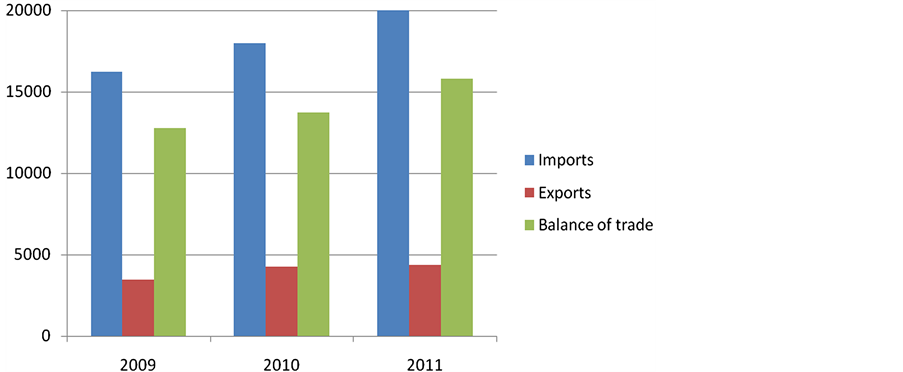
Graph 1. Lebanon’s foreign trade (million USD) [13] .
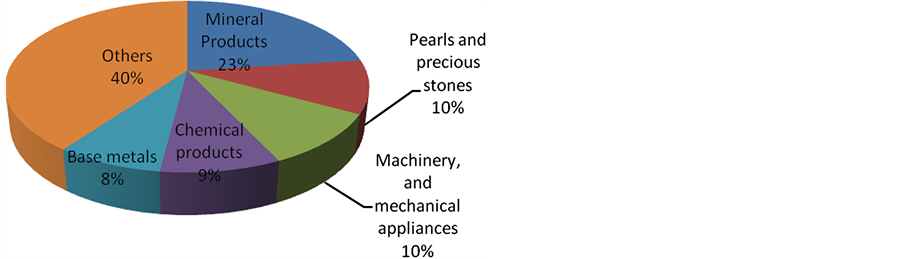
Graph 2. Main types of imported goods—Share in % of total— 2011 [14] .
As for distribution of exported goods, as shown in Graph 3, Lebanon exported goods are composed mainly of Pearls and precious stones, followed by machinery and mechanical appliances, base metals, transport equipment, and prepared foodstuffs products.
6.3. Imports and Exports Origins and Sources
Graph 4 shows that Lebanon imports mainly from the United States, followed by China, Italy, Germany and France. Simultaneously, Graph 5 classifies the main countries of exportation; they are Switzerland followed by the United Arab Emirates, France, Iraq and Saudi Arabia.
7. Lebanese Financial Institutions
Lebanese commercial banks have proven their capacity to face difficult and complex situations. They have ma- naged to overpass periods of instability by applying a series of measures. Lebanese banks had complied with all restrictions and ceilings imposed by the local monetary authorities and control. Added to that, they managed, through strategies, systems and tools available, to maintain high level of liquidity in Lebanese pounds and in foreign currencies2 as mentioned in Table 2.
The volume of the Lebanese banking sector is very important compared to GDP’s volume3. Hence, Lebanese banks have large capacity to mobilize residential and none residential savings and to optimize managing re- sources depending on the needs of the prevailing economic situations.
8. Banks Deposits
The deposits remain the main resource of the sector and the main engine of the activity of the commercial banks

Graph 3. Main types of exported goods—share in % of total— 2011 [14] .
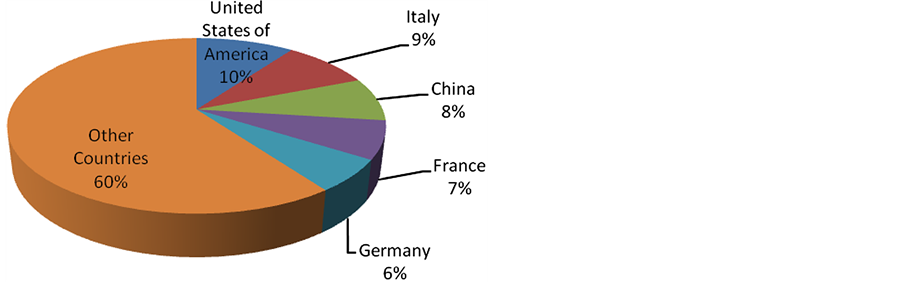
Graph 4. Main countries of origin—share in % of total—2011 [14] .
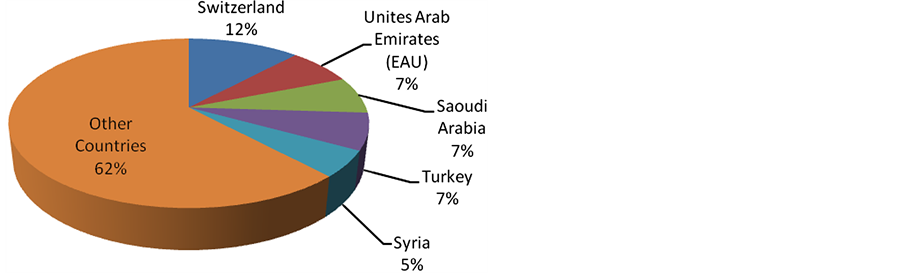
Graph 5. Main countries of destination—share in % of total— 2011 [14] .
Table 2. Evolution of deposits and claims at banks (end of period) [14] .
operating in Lebanon. As matter of fact, high concentration of deposits resources reflects confidence and loyalty of the Lebanese, residents and emigrants, and of businessmen mainly Arabs. Lebanese banks rely on their depo- sits as main source of funds and not on the financial markets. The deposits, in great majority, have short-term tenor4.
According to central bank, at the end of 2010, the basis of deposits which includes private sector and public sector, has reached 163,716 billion Lebanese pounds5 against 145,957 billion Lebanese pounds in 2009 and 118,584 billion Lebanese pounds at the end of 2008. These deposits represent the fourth largest deposit base in the Arab world, preceded by United Arab Emirates, the Kingdom of Saudi Arabia, and Egypt, while the deposits of coming from the public sector in these three countries are much more important in relation to those hig- hlighted in Lebanon who represent only 1% of the total commitments (liabilities) of the Lebanese banks.
In addition, Lebanese banking sector had benefited in 2009 from the international financial crisis affecting the banking sector worldwide. Hence, banks operating in Lebanon have attracted an exceptional volume of funds from overseas, registering an increase of their deposits in volume of 27,373 billion of Lebanese pounds6.
Bank deposits are concentrated in the city of Beirut and its suburbs. The contribution to this region represented 69.3 percent of total deposits end of 20107, while 30.7 percent only of total deposits in volume come from other regions of Lebanon8. Hence, it indicates significant difference in the average of deposits invested, between the city of Beirut and its suburbs, on one hand, and the rest of Lebanese regions, on the other.
9. Banks Loans
The volume of bank loans to the private sector changed significantly with the size of the economy. According to the association of banks in Lebanon, the average of the receivables to the GDP having reached 88% in 2010, a rate considered high compared to many emerging countries.
The relatively high level of this rate in Lebanon can be explained in part by the magnitude of the private de- mand funded in large part by the bank claims to individuals and companies (Corporate) in view for investment and in particular for consumption. On the other hand, by the weak structure of the business sector and their mas- sive recourse to bank financing instead of seeking Market financing (i.e. Via stock and bond markets), which makes the bank financing, in spite of its increase relatively to the size of the economy, required and necessary.
It should be noted here that the rate of bank loans in relation to GDP remains insufficient to measure the total financing granted in a given economy because it must also consider the share of funding provided by the two markets of Stocks and Bonds.
The statistics relating to the nature of the credits granted by the financial sector, show that most of these cre- dits are in general overdraft facilities. The share of these specific loans to total distributed has formed at the end of 2010, 30.5 percent against 31.5 percent end 2009, followed by real estate loans whose share has reached 25.5 percent and 23.4 percent in the two dates respectively, and then by the receivables on personal guarantee whose share has reached 17.5 percent and 17.3 percent respectively (i.e. in 2010 and in 2009).
It is noted that overdraft facilities are granted to customers benefiting from the high financial capacity and/or to large customers, who in fact monopolize the greater part of the receivables. The share of overdraft facilities in the total/receivables is consistent with the global loan distribution in reference to amounts and beneficiaries.
As for loans’ distribution to different economic sectors, with the exception of the agricultural sector, as is the case in most developed and emerging markets, it corresponds roughly to the contribution of different economic sectors to GDP. The statistics have shown a strong increase in credits granted to all the economic sectors during 2010, including a remarkable increase of housing credits which has reached 60.8%, while loans granted for in- dustrial purposes have increased only by 16.6%, and for agriculture purposes jumped 31.4%.
As a result of these increases across the different sectors, their share of total loans has drastically changed between 2009 and 2010. Credits continued to be concentrated in trade and services sectors despite the decline of their share in the total loans distribution9.
The share of the industry in the credit distribution also declined to 11.3 percent at the end of 2010. By con- trast, the share of personal loans has continued to increase from 22.2 percent at the end 2009 to 23.5 percent end 2010 driven by the increase in loans for housing. Housing loans share has significantly increased from 8.9 percent to 11.7 percent during the same period. The share of building and construction sector has also increased 16.3%, financial intermediation flagged at 8.5%, while agriculture sector has increased slightly10.
10. Enhancing Lebanon’s Competiveness
Lebanon is incrementally participating to international trade liberalization with no long term planning aiming to develop national competitiveness and reinforcing strategic industries benefiting from factors endowments, in- novation, research and development. Lebanese government and parliament have to reconsider decisive actions in order to encourage and enable strategic industries to grow up faster and participate to international trade flows characterized by demanding consumers, increasing competition and economies of scale.
Lebanese legislations still need major modifications to ensure a relevant market structure moving from mo- nopolistic structure to a strong competitive environment. Competition law is to be voted as soon as possible to break monopolistic local producers model, which do not need to innovate and upgrade, either in research and development, or decreasing their average cost of production. In addition, legislations and law need to strongly impose quality standards enabling demanding consumers’ pressure on companies to achieve competitive advan- tage to satisfy their needs and wants, essential condition prior to export activities where increasing competition urges international producers achieve competitive advantage and economies of scale. Lebanese consumers can give local companies a clearer or earlier picture of emerging and foreigner buyer needs. The presence of strong Lebanese competitors is a powerful stimulus to the creation and persistence of competitive advantage. No doubt, domestic rivalry will create pressure on Lebanese firms to innovate and improve.
Lebanese government has to intervene in the economy according to different trade models to ensure necessary infrastructure to national industries. Financial incentives need to be granted to strategic firms to innovate and grow faster, meeting international quality standards and requirements. Even though Lebanon does not inherit factors, but instead local producers have to create the most important factors of production, such as skilled hu- man resources, with or even without endowments in natural resources.
Government may provide important incentives urging suppliers and end-users to be located near each other, to take advantage of short lines of communication, quick and constant flow of information, and ongoing ex- change of ideas and innovation. Lebanese firms can serve as test sites for research and work development to their suppliers, accelerating their own pace of innovation and trade.
The strong highly liquid Lebanese banking institutions have to relocate loans and funding towards strategic Lebanese industries, under a national development plan lead by the government to restructure national’s capa- bility and competitiveness via intensive investment in research and development to meet international require- ments. Banks’ deposits are largely sufficient to enable local firms achieve competitive advantage, develop own capabilities and benefit from openness to foreign markets. Banks’ loans as mentioned above are currently con- centrated in specific non-productive sectors, mainly consumption, services and real estate. Taking into consider- ation that volume of Lebanese banking sector is one of the highest worldwide compared to GDP, Lebanese banks have large capacity to mobilize residential and non residential savings towards strategic productive sec- tors. Is it acceptable to have stagnating industries while possessing huge savings and loans possibilities invested in wrong sectors, neglecting national production and competitiveness? Lebanese trade pace is far from what it should be because of absence of relevant legislations, weak government intervention and non-structured loans to economy.
11. Conclusions
Analyzing nation’s competitiveness and its dependence on the capacity of its industry to innovate and upgrade deems indispensable. Nevertheless, applying one standard trade model is too good to be true, different economic models identify specific approaches to tackle trade liberalization which strongly influences my market struc- ture and international exchange of goods, demand wise, and worldwide supply to drive down average cost curves. Empirical studies are needed to specify strengths and weaknesses of economic theories and models prior to implementation within a nation’s economy. Competitive advantage determines the pattern of trade and trade pace to export to different destinations. Intra-industry trade flow remains a major market depending on local factors characteristics, as well as intensive investment in research and development to achieve competitiveness and ensure real opportunities to a nation to benefit from trade liberalization. Simultaneously, factors endow- ments may strongly and positively influence strategic export capabilities through focusing on producing goods that are relatively intensive in users of the factor of production with which they are relatively well endowed. All the same, trade models should not neglect the fact that in many nations, national prosperity is created, and not always inherited; it does not always grow out of natural endowments, labor pool, interest rates, and currencies’ values. It is proven that nation’s competitiveness depends on the capacity of its strategic industries to innovate and upgrade, benefiting from having strong domestic rivals and aggressive domestic supplies.
Lebanon’s industries cannot achieve competitive advantage in all sectors. Enhancing and reinforcing strategic industries remain a major factor enabling Lebanon to benefit from trade liberalization and accession to WTO. Government’s intervention is crucial for good planning and ensuring funding, infrastructure and supply chain for domestic firms benefiting from factors endowments, skilled labor and real capabilities to innovate via intensive investment in training, research and development. Updating and contextualizing necessary legislations and laws will always remain a major condition to Lebanon’s competitiveness through enhancing local competition, en- couraging information exchange between consumers, producers and suppliers. Legislations will enable de- manding buyers to pressure companies to innovate faster and achieve more sophisticated competitive advantages.
References
- Dawson, G. and Mackintosh, M. (2004) Economics and Economic Change. The Open University, London.
- Karp, L. (2006) The Heckscher-Ohlin-Samuelson Model. http://are.berkeley.edu/courses/ARE201/fall2006/Notes2004/Chapter4.pdf
- Leontief, W. (1953) Domestic Production and Foreign Trade. http://www.ucl.ac.uk/~uctpvhg/ECON1005/Readings/Leontief.pdf
- Bowen Harry, P., Edward, E., Learner and Sveikauskas, L. (1987) Multicountry, Multifactor Tests of the Factor Abun- dance Theory. http://web.mit.edu/14.54/www/handouts/Bowen.pdf
- Carter, C.F. and Williams, B.R. (1957) Industry and Technical Progress. Oxford University Press, Oxford.
- Freeman, C. (1982) The Economics of Industrial Innovation. 2nd Edition, Francis Pinter, London.
- Porter, M. (1990) The Competitive Advantage of Nations. Harvard Business School Publishing Corporation, London.
- Suneja, V. (2002) Policy Issues for Business. The Open University, London.
- Presidency of the Council of Ministers (2011) Economic Accounts of Lebanon 2010. http://www.finance.gov.lb/en-US/finance/EconomicDataStatistics/Pages/LatestEconomicIndicators.aspx
- Presidency of the Council of Ministers Central Administration of Statistics. Consumer Price Index. http://www.cas.gov.lb/index.php/en/economic-statistics-en/cpi-en#cpiresults
- IMF Country Report No. 12/39 (2012) Staff report for the 2011 Article IV Consultation. http://www.imf.org/external/pubs/ft/scr/2012/cr1239.pdf
- IMF World Economic Outlook (2012) Growth Resuming, Dangers Remain. http://www.imf.org/external/pubs/ft/weo/2012/01/pdf/text.pdf
- Association of Banks in Lebanon (2012) Annual Report 2011. http://www.abl.org.lb/subPage.aspx?pageid=1499
- Banque du Liban. Statistics and Research. http://www.bdl.gov.lb/webroot/statistics/
NOTES

1This model was initially published by Hecksher and Ohlin in 1933, Samuelson and Stopler presented essential input to it in 1941, related to the remuneration of factors of production.

2Mainly USD notes.
3Close to 328% in 2010.

4Less than 90 days on average.
5The equivalent of 108.6 billion US dollars.
6A 23.1% increase compared to 2008.
7Owned by 49.5 percent of the total number of depositors.
8Owned by 50.5 percent of the total number of depositors.

9Only 36.1% end of 2010 against 38.2% in 2009.
10Only 1% increase.