International Journal of Intelligence Science
Vol.2 No.4A(2012), Article ID:24190,10 pages DOI:10.4236/ijis.2012.224022
Emotions States Recognition Based on Physiological Parameters by Employing of Fuzzy-Adaptive Resonance Theory
1School of Electrical and Computer Engineering, Shiraz University, Shiraz, Iran
2Biomedical Engineering Department, Electrical Engineering Faculty, Sahand University of Technology, Tabriz, Iran
Email: mahdismonajati@yahoo.com
Received May 16, 2012; revised July 16, 2012; accepted July 27, 2012
Keywords: Physiological Signal; Galvanic Skin Response; Heart Rate; Respiration Rate; Fuzzy-ART; Emotion Recognition
ABSTRACT
This paper is an investigation on negative emotions states recognition by employing of Fuzzy Adaptive Resonance Theory (Fuzzy-ART) considering the changes in activities of autonomic nervous system (ANS). Specific psychological experiments were designed to induce appropriate physiological responses on individuals in order to acquire a suitable database for training, validating and testing the proposed procedure. In this research, the three physiological applied signals are Galvanic Skin Response (GSR), Heart Rate (HR) and Respiration Rate (RR). The first experiment which is named Shock was designed to determine a criterion for the change of physiological signals of each individual. In the second one, a combination of two sets of questions has been asked from the subjects to induce their emotions. Finally, Physiological responses were analyzed by Fuzzy-ART to recognize which question excites the negative emotions. Detecting negative emotions from neutral is obtained with total accuracy of 94%.
1. Introduction
For as long as human beings have concealed their emotions from others, people have tried to develop techniques for detecting inner emotions. Psychophysiology attempts to achieve human emotions by study of the interrelationships between the physiological and psychological aspects of behavior. John Stern (1964) defined the work of psychophysiology as “any research in which the dependent variable (the subject’s response) in a physiological measure and the independent variable (the factor manipulated by the experimenter) a behavioral one” [1]. Physiological parameters include electrodermal activity, heart rate, skin temperature and respiration rate because these variables respond to signals from the autonomic nervous system, which is not under conscious control [2]. James (1884) hypothesizes that autonomic nervous system (ANS) activity produces the percept of discrete emotional state implies that emotion-specific somatovisceral patterns generate emotional experiences [3]. There are many studies have been carried out on the human emotions recognition since now. The most common procedure to recognize the emotions when the individual conceals them is polygraph test. But there is still no technique that consistently meets the legal standards of scientific evidences and very few that scientists even consider acceptable. However, detecting deception is still the most tempting “best-guess” game because the physiological responses that the polygraph measure in psychological states are associated with deception (e.g., fear of being judged deceptive), can also arise in the absence of deception [4,5]. One of the reasons which leads this flaw arises, is the cause of the confessions that were obtained by the polygraph examiner who interrogated the examinee after deciding the test was failed. Under these circumstances, the criterion (the confession) and the test outcome (deception indicated) are not independent [6]. However emotions recognition without considering the application of these psychological experiments can be a procedure to achieve the inner human emotions. In this research, Fuzzy-ART is proposed to categorize the physiological responses which are induced by negative emotion. Cacioppo et al. proposed to use the negative emotions which are associated with stronger ANS responses [3]. The three physiological parameters; GSR, HR and RR have been collected through the laboratory experiments, in which the subjects’ emotions were induced by two sets of questions. A special technique was applied for experiments to prepare appropriate conditions for exact categorization.
The layout of this paper consists of a review on previous research in relation to human emotion recognition (Section II), a description of the physiological signals applied in this research (Section III), and experiments which were carried out to prepare required data (Section IV). The Algorithm is presented in detail in Section V, and some analysis of data is described in Section VI. The result provided by the algorithm is shown in Section VII. Finally, conclusions and future work (Section VIII) are in the end of this paper.
2. Literature Review
Several methods have been developed to recognize human emotions from different approaches and viewpoints. The proposed method in this paper focuses on emotions recognition based on physiological signals. Considering this, there exist many previous works related to this topic. The word “emotion” possesses several connotations that make a unique, exact definition unfeasible [7]. Several sets of basic emotions have been proposed by theorists. The basic emotion set proposed by Ekman includes anger, fear, disgust, sadness, and enjoyment and, sometimes, surprise [8]. Emotions are defined in a multidimensional apace of emotion attributes. Most literature about emotions however agrees on the fact that emotions have a complex nature and that they are a combination of physical and cognitive factors. The physical part is also referred to as bodily or primary emotions, while the cognitive part is also referred to as mental emotions [9]. A model that could be able to differentiate between emotional states is shown in Figure 1. This model is a discretization of continuous valence-arousal which was defined by Lang (1990) [9]. Valence defines whether the emotion is positive or negative, and to what degree. Arousal defines the intensity of the emotion, ranging
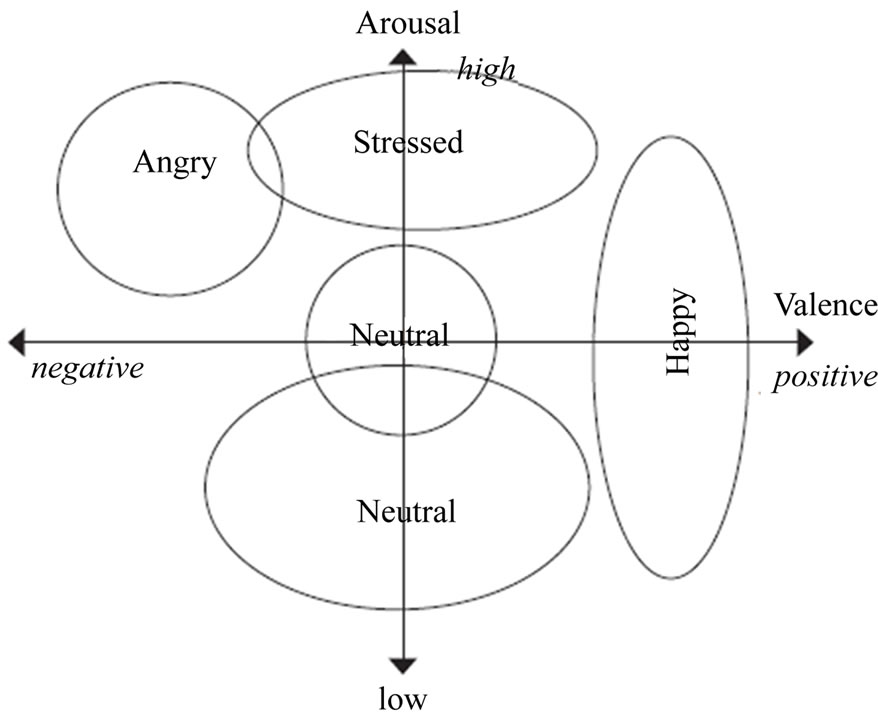
Figure 1. Discretization of arousal-valence based on lang model [9].
from calm (lowest value) to excited (highest value) [9].
One of the difficulties of using emotion classes is that the relationship between the emotion categories is not clear and there is no structure for measuring the similarity of the emotions or the way in which they differ. For example, the specifications for separating distress from fear or contempt and disgust are subject to debate [10]. The OCC model can be categorized at the most general level into positive and negative emotions [9]. Joy, contentment, sadness or depression, disgust, fear and anger are primary emotions that identified by Boucsein [11]. Neutral is a subcategory of the positive state, since it has no negative influence [9]. Emotion recognition has been studied using physiological signal, facial expression, gesture and voice. Also, many studies were carried out on detecting of different emotional expressions such as stress, anger, fear, sadness and happiness. Recently, emotions recognition using physiological signals has been performed by various machine learning algorithms, e.g., Back Propagation (BP) with forgetting [12] k-Nearest Neighbor algorithm (KNN) [13], Linear Discriminant Analyze (LDA) [14], Sequential Floating Forward Search (SFFS) [14], and Support Vector Machine (SVM) [10,14,15]. Multilayer Perceptron (MLP) [17], the Adaptive Neuro-Fuzzy Inference System (ANFIS) [10,15]. Lee et al. proposed MLP to analyze the relationship between emotions and HR and GSR signals. They found an accuracy rate of 80.2% for four classes identified as sad, calm pleasure, interesting pleasure and fear [16]. Chang et al. proposed a Support Vector Regression (SVR) trained by five physiological signals were induced by watching movies in order to obtain three emotional trend curves (sadness, fear, and pleasure) [15]. Also, in recent years several studies were proposed for increasing the safety of car during driving. A study by Katsis was carried out to classify emotional states of car-racing drivers which are identified as high stress, low stress, disappointment, and euphoria using facial electromyograms, ECG, respiration, and electrodermal activity. The classifiers were (SVMs) and (ANFIS) with validation of 79.3% and 76.7%, respectively [10]. Multivariate Statistics methods were studied by Zocchi et al. for evaluating the correlations between the physiological parameters acquired during driving. They found that K-mean clustering was more appropriate than mean and Standard Deviation and Hierarchical clustering methods [12]. Moreover, Facial expression is widely used for emotion recognition by several researches which have different applications such as evaluating the interaction between human and the computers in order to provide machines with the ability to interpret and “experience” emotions [7]. Some significant features of emotions were found by combination of human faces and physiological signals using a feature selection method [9,17]. However, since facial expressions may be expressed differently by different people, inaccurate results are unavoidable [15]. As seen, different work has been done to recognize emotions. Neural Networks are commonly used to classification but causes of the ambiguous in the definition of boundaries of each emotional class, the fuzzy classifiers have been developed. Layeghi et al. used modified KNN algorithm to assign the different degrees of membership to each input according to their distances from the mean of its own class or the other classes because each object can be considered to belong to more than one class at the same time [13]. Sierra et al. achieved the accuracy of 99.5% in stress detection using two physiological signals (only HR and GSR). Their manual implementation was based on Mamdani fuzzy decision algorithm and automatic implementation based on (ANFIS), which provides a Sugeno-type fuzzy inference system [18]. However, the proposed method in this research is able to recognize the negative human emotions by classifying features extracted from physiological signals.
3. Physiological Signals
This study proposes the use of three physiological parameters; GSR, HR and RR to recognize human emotions. These parameters are extracted directly from electrodermal activity, electrocardiogram (ECG) and respiration signals respectively. The main characteristics of these signals are noninvasiveness and rapid changes. Also these signals have been applied in many studies with high accuracy in their results [8,18]. Furthermore, it is common to focus on three or more physiological signals in order to obtain more precise information about the state of mind [8,18,19]. GSR, which is known also as electrodermal activity or skin conductance level (SCL), is an indicator of skin conductance. GSR has been used as a psychophysiological measure ever since it was popularized by Carl Jung (1907) [2,18]. Eccrine sweat glands, present on the palmar surfaces of the hands and on the bottom of the feet, are innervated by the sympathetic nervous system. Sympathetic activity causes an increase in sweat production, thereby increasing skin conductance. Skin conductance is expressed in micro-siemens (µS), a common unit of conductance [2,11,18]. Lang et al. have argued that whereas other peripheral psychophysiological measures might distinguish between the positive and negative aspect of emotional experience, GSR appears sensitive only to the arousal dimension not direction or valence of the emotion involved [11]. HR is the second parameter that was focus on it in this research. It describes the heart activity when the (ANS) attempts to tackle with the human-body demands depending on the stimuli received. In addition, in this research HR measures the number of the well-known QRS complex in an ECG signal per minutes [18]. Both HR and GSR behave differently for each individual and they shouldn’t be compared with the other individuals [18,19]. RR as a third parameter, also measures the number of the peaks in respiration signal per minutes. This signal has been selected because the indirect effect of the sympathetic nerve activity on it [20,21]. A study by Boiten (1996) also raises the possibility that at least some of the cardiac differentiation of emotions that has been observed may be secondary to effort and respiratory changes [18]. Skin temperature is another physiological signal that is under the control of ANS. Circulation in the microvasculature can be varied in order to regulate temperature and oxygen supply to tissues. The changes in skin temperature can be brought about by a change in emotional state [2]. But regularly, it has more delay in changing in comparison with the other signals [4]. Hence it is not appropriate to be applied with Fuzzy-ART method.
4. Data Acquisition
All of the corresponding experiments were carried out in the biomedical laboratory, Electrical Engineering Faculty, Sahand University of Technology (SUT), Tabriz, Iran. The main aim of this step is to collect GSR, HR and RR signals from each volunteer. 30 series PowerLab is the device which is proposed to carry out these experiments. It is worth mentioning that this hardware is able to record all needed physiological signals. Prior start the experiment volunteers were introduced to detail experiment procedure while the second experimenter attached electrodes for measurement of physiological signals. This time was an opportunity in order to feel comfortable and adaptive in the laboratory’s environment. The laboratory was located in a calm environment without any electrical and magnetic noise. In this research GSR, ECG and respiration were recorded at the same time. GSR was measured from two Ag/AgCl electrodes attached to the index and ring fingers of the left hand. The subject should remove any jewelry and he had clean, dry hands ECG electrodes were attached on the limbs. The respiratory belt was attached around the volunteers’ abdomen using the Velcro strap to record the respiration signal. The Skin Temperature Probe was attached to the palmar surface of middle fingers using medical tape. The GSR electrodes and Skin Temperature Probe should not on the same finger [2]. Answers to the questions were recorded by pressing a push button in right hand. The “Yes” response was signed by one press and “No” by two press with a little delay.
4.1. Subjects
All the subjects were students from Sahand University of Technology (SUT) consist of 6 males and 7 females of ages between 20 and 25 years old and all of them were completely in normal and healthy state. The number of subjects was low because it has no meaning to get the statistical output from hundreds of subjects [9]. Emotion occurs very differently according to the situation, personality, and growth environment etc. So, the generalization of the detection algorithm to everyone isn’t appropriate [9,15]. Moreover, they had no previous information about the questions in order to prepare the real condition. Before start the main experiment some plump packets were proposed to each subject to select a set of emotional questions among them and at the end of experiment it gave back to him. This procedure was done to increase subject confident. It is also requested from subject to conceal his emotions in order to evaluate the physiological responses.
4.2. Experimenters
These experiments were carried out by two experimenters. The first one was asking the questions from each subject with face to face contact. And the second one was monitoring the signal records. These tasks were done separately in order to increase the accuracy of the physiological responses and decrease the negative influence of experimenter judgment during the experiments.
4.3. Pilot Experiment
Experiments were designed according to the pilot experiments, which were carried out on four volunteers. Their physiological responses have been investigated in order to find the best technique for producing real conditions. It is notable that these volunteers didn’t participate in main experiments to prepare the same conditions for all subjects.
4.4. Psychological Experiments
The subjects underwent two experimental sessions by using physiological signals. All steps of experiments are shown in Figure 2. The first experiment is named Shock Test. In this experiment a shock was created by a loud voice behind the subject while he had undergone calm state. This shock was preparing a stress state for subject. It was carried out in order to obtain a criterion about physiological reaction of each subject. The main test named emotional test was carried out in order to induce physiological responses in the negative emotional state. This test was under the following conditions: calm state, baseline questions, emotional questions. Before asking the questions some minutes were given to each subject to achieve calm state then seven questions with “Yes or No” answers have been asked that the subject must answer to them truthfully. These baseline questions were designed to prepare normal physiological condition without exciting emotions. The following questions are the examples of
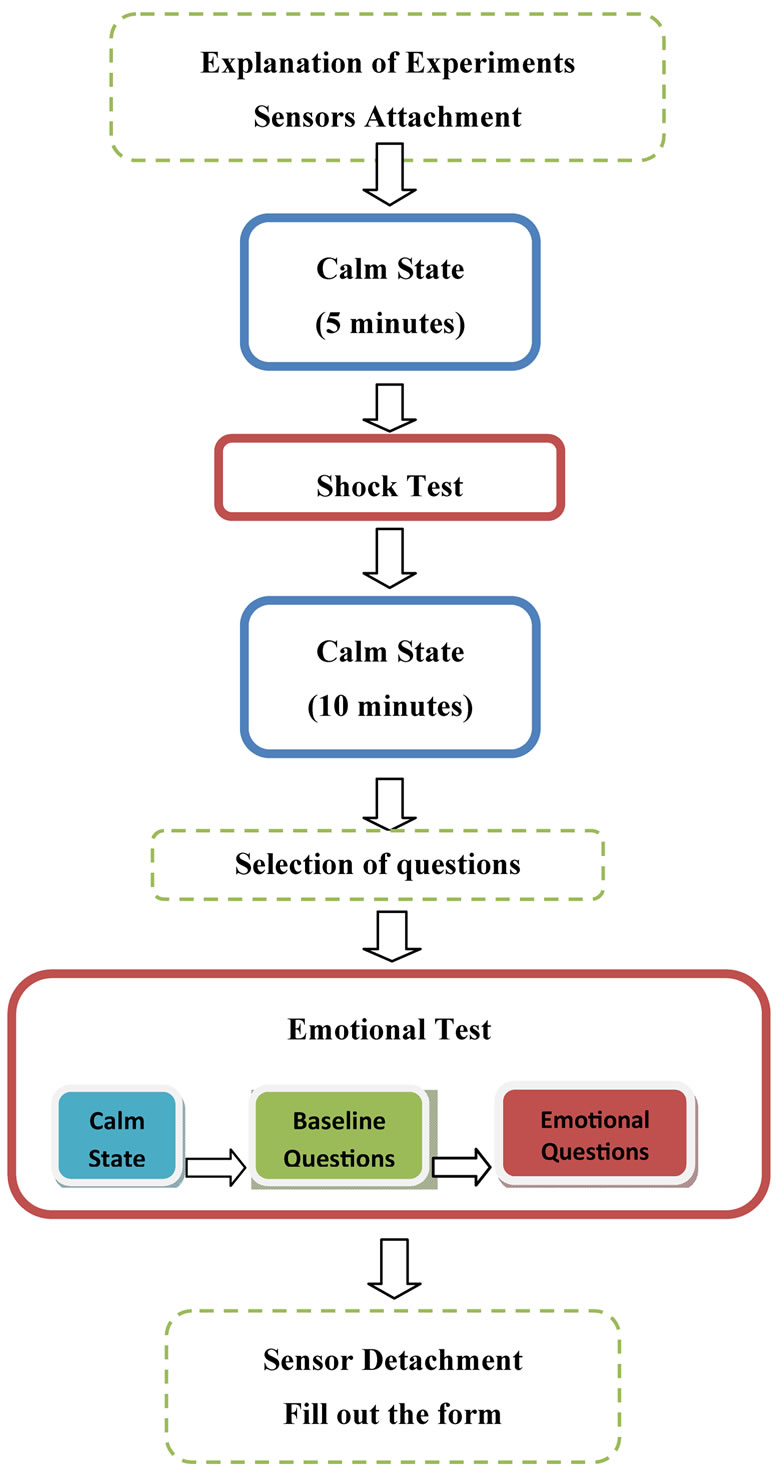
Figure 2. Experiment procedure, in steps of the dashed outline boxes subject was prepared for experiments, in steps of blue boxes subject underwent to calm state in order to achieve normal physiological responses and red boxes are experiment steps.
these questions.
• Today is Friday, isn’t it?
• Did you have cheese for breakfast this morning?
• Do you have a sister?
The set of the emotional questions containing of nineteen questions was also the combination of both baseline questions or neutral questions and emotional questions. The emotional questions were designed according to the events which may occur in the individual life in order to prepare real condition for each subject because several reviews have noted the failure of imagination to produce differentiation reliably [3,16]. The sequence of these questions plays an important role in categorizing more precisely. It was designed to highlight the emotional ones. The set of questions below is in the typical sequence.
1) Today is Tuesday?
2) Are you invited for a party this Tuesday?
3) Do you go to the party every week?
4) Have you ever stolen anything?
5) Do you wear the glasses?
6) And sun glasses?
Only the question number (4) is considered as an emotional question in this sequence. But the other ones return the physiological responses toward their baselines. Neutral questions have the relation with each other to draw off the mind from emotional questions. This technique is the combination of Control Question Technique (CQT) and Relevant/Irrelevant technique. The CQT is used to get a baseline physiological response to anxiety or stress. Moreover, in the Relevant/Irrelevant technique, a number of questions are asked and the ones for which the subject has a markedly greater physiological response are assumed to be the ones they are lying about [4,5]. The subject had to answer these questions with “yes or no” in face to face contact with examiner. There was at least 10 seconds between two questions based on the time delay between the instances that the subject experienced an emotion and the corresponding response changes in the selected signals [22]. Physiological responses may be excited cause of the negative emotions such as stress, sadness.
5. Emotion Recognition Algorithm
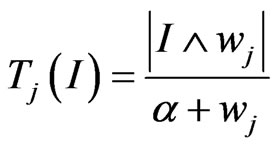
A key element of this paper is the application of Adaptive Resonance Theory (ART) to categorize the questions which induce emotions from the other ones. ART is a collection of models for unsupervised learning. ART-1 in particular was designed to resolve the stability-plasticity dilemma. This refers to a conflict in the ability to maintain old learned information while still being adaptive to learn new information. An algorithm is defined as plastic if it can adapt to new information. Additionally, an algorithm is stable if it can retain previously learned knowledge. The aim is to create an algorithm that can retain previously learned knowledge while at the same time integrating newly discovered knowledge. In this way, the algorithm is both stable and plastic. Many clustering algorithms are one or the other, but not necessarily the both [23]. An interesting advantage of ART-1 is in its ability to create a new cluster if the underlying data warrants [23]. It accomplishes this with a vigilance parameter that helps to determine when to cluster an input vector to a “close” cluster, or when to simply create a new cluster into which this input vector is inserted [23]. If the input vector is not clustered after checking all of the available clusters, a new cluster is created for it using createnew-cluster. This process continues until no changes to clusters are made. While clusters are created, input vectors may drop out of a cluster and into another based on new feature vectors being added, and adjusting the cluster vector. When no cluster changes are made for an entire iteration through the available feature vectors, the algorithm is complete [23]. The ART-1 algorithm is a useful clustering algorithm with the obvious advantage over k-Means in that new clusters can be created if the feature data require it. ART-1 can also be tuned using the β (“tie-breaker”) and ρ (vigilance) parameters. Regardless of these settings, ART-1 is stable in that once the clusters have formed, performing additional iterations of the algorithm on the same data will not change the clusters [23]. These properties make ART algorithm ideal candidates for emotions recognition. Since the physiological parameters which can be presented as data or input vectors, have analog nature and uncertainty; therefore, Fuzzy-Adaptive Resonance Theory (Fuzzy-ART) was applied as an unsupervised learn algorithm to categorize the emotions. Fuzzy-ART incorporate computations from fuzzy set theory into the ART-1 neural network, which learns to categorize only binary input patterns [24]. The generalization to learning both analog and binary input patterns is achieved by replacing appearance of the intersection operator (∩) in ART1 by the MIN operator (˄) of the fuzzy set theory [23].
Simpler Fuzzy-ART has two layers and requires only one set of weights [25]. As seen in Figure 3, the algorithm is begun with a set of unclustered input vectors. The first layer which is named input layer is capable of housing an analog input vector, I, of  vector components. Each input vector maps to an input cell within the neuron computing cell. The second one which is named category layer is capable of housing the same vector components. These two neurons are connected according to a synaptic weight, in which the first similarity computation is found [24,26].
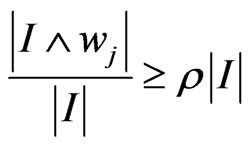
  is an analog-valued weight vector which is associated with cluster J. The α parameter is used as a “tie-breaker” to give deference to clusters. This parameter is typically a small and positive number [23,24]. The vigilance parameter (ρ) is constant and defined as 0 < ρ < 1 [24]. If ρ is high (such as 0.9),
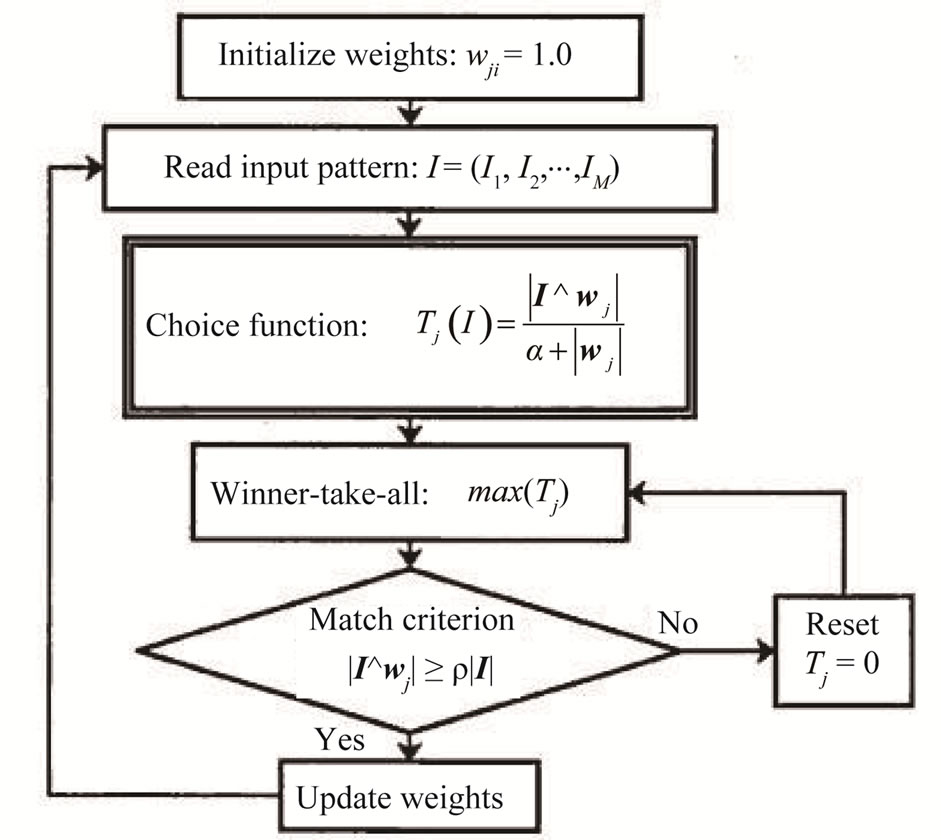
Figure 3. Fuzzy-ART architecture [25].
more clusters will tend to be created and if vigilance is low, then fewer clusters will be created [23,24]. Isawa et al. propose a Fuzzy-ART combining overlapped categories using variable vigilance parameters which are arranged for every category, and they are varied according to the size of respective categories with learning [27]. For this research low vigilance parameter was selected to achieve few clusters. Category proliferation is prevented by normalizing input vectors at a preprocessing stage. This normalization leads to a symmetric theory in which the MIN (˄) and MAX (˅) operator of fuzzy sets play a complementary role [24]. Fuzzy-ART clusters vectors based on two separate distance criteria, match and choice [23,24]. Carpenter et al. propose searching for a category J which maximizes 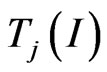 and then checks whether the match criterion is true or not. If this category does not satisfy the match criterion and is marked as ineligible (Reset) then the search should be repeated until an acceptable category is found (Resonance) [23,24]. The choice function,
  , is the similarity measurement between the analog input vector I and the stored category J.
The output of the choice function becomes the input of the category layer, where the most acceptance category, if available at the time of comparison, is selected to contain the current vector input I [24,26].The next portion of this algorithm is checking for vigilance. After a category has been selected, it must satisfy the vigilance check, which is the final determiner for whether the input vector should be added to the particular cluster. If not, the input vector is discarded and the algorithm is reset [24,26].
The fuzzy-ART learning rule is given by:
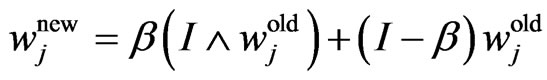
where 0 < β < 1 [26]. In this architecture, there is only one copy of the weights, which is employed further to facilitate parallel implementation [26]. Learning is stable because all adaptive weights can only decrease in time. Decreasing weights corresponds to increasing the size of category boxes [24].
6. Analysis
6.1. Manual Analysis
In our experiments, there are four physiological signals were recorded during Shock test from a subject and the corresponding results are illustrated in Figure 4 which is directly extracted from original software (chart). These signals are GSR, Temperature of finger, ECG and Respiration respectively from the above. After inserting a shock, GSR increased rapidly up to 20 Sec. then decreased more slowly. It is worth mentioning that this subject had normal GSR range. The temperature signal started to decrease after implementation of the shock with a long time delay of about 20 Sec. Consequently, this signal was not proper to being judged in a short time and was eliminated to avoid the effect on the physiological response of other questions in Emotional test. The physiological responses of this test can be a criterion for analyzing the ones which is induced by Emotional Test.
By eliminating the temperature signal three signals were remained. Emotional test of previous subject is
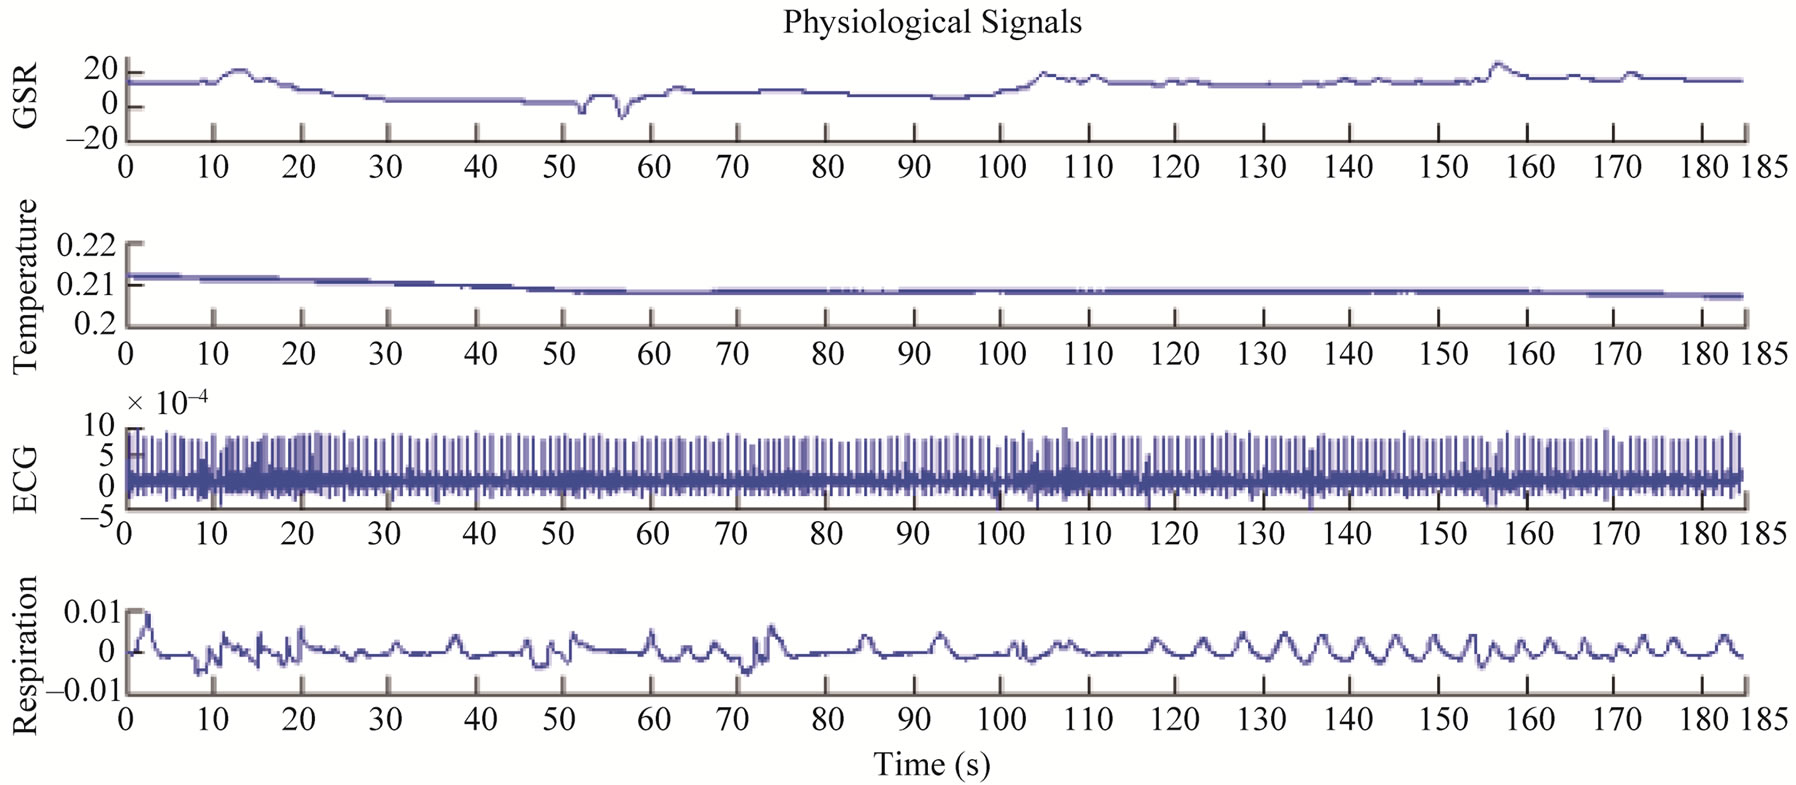
Figure 4. Physiological were recorded from a female subject aged 23 during the shock test, the first signal from above is GSR, the second one is the temperature of finger, the third one is ECG and the last one is respiration. In the instant 154 (s), a shock is inserted.
shown in Figure 5. GSR, ECG and Respiration are the Physiological signals that are respectively obvious from the above in the channel. The original figure of these signals is also shown in Figure 6. The first seven questions are defined as the baseline or neutral ones. These signals as they can be seen in Figure 5 prepared normal emotion state for subject (during first 100 seconds). The next nineteen questions which are combination of both neutral and emotional ones are started from instance 100 (s). Considering subject self-report, the questions number 10 and 11 from emotional set induced negative emotions. Number 10 evoked stress state cause of telling lie in instance 220 (s) and number 11 evoked sadness in instance 238 (s). Although, the question number 11 was considered as a neutral, but emotion induction was unavoidable. According to subject self-
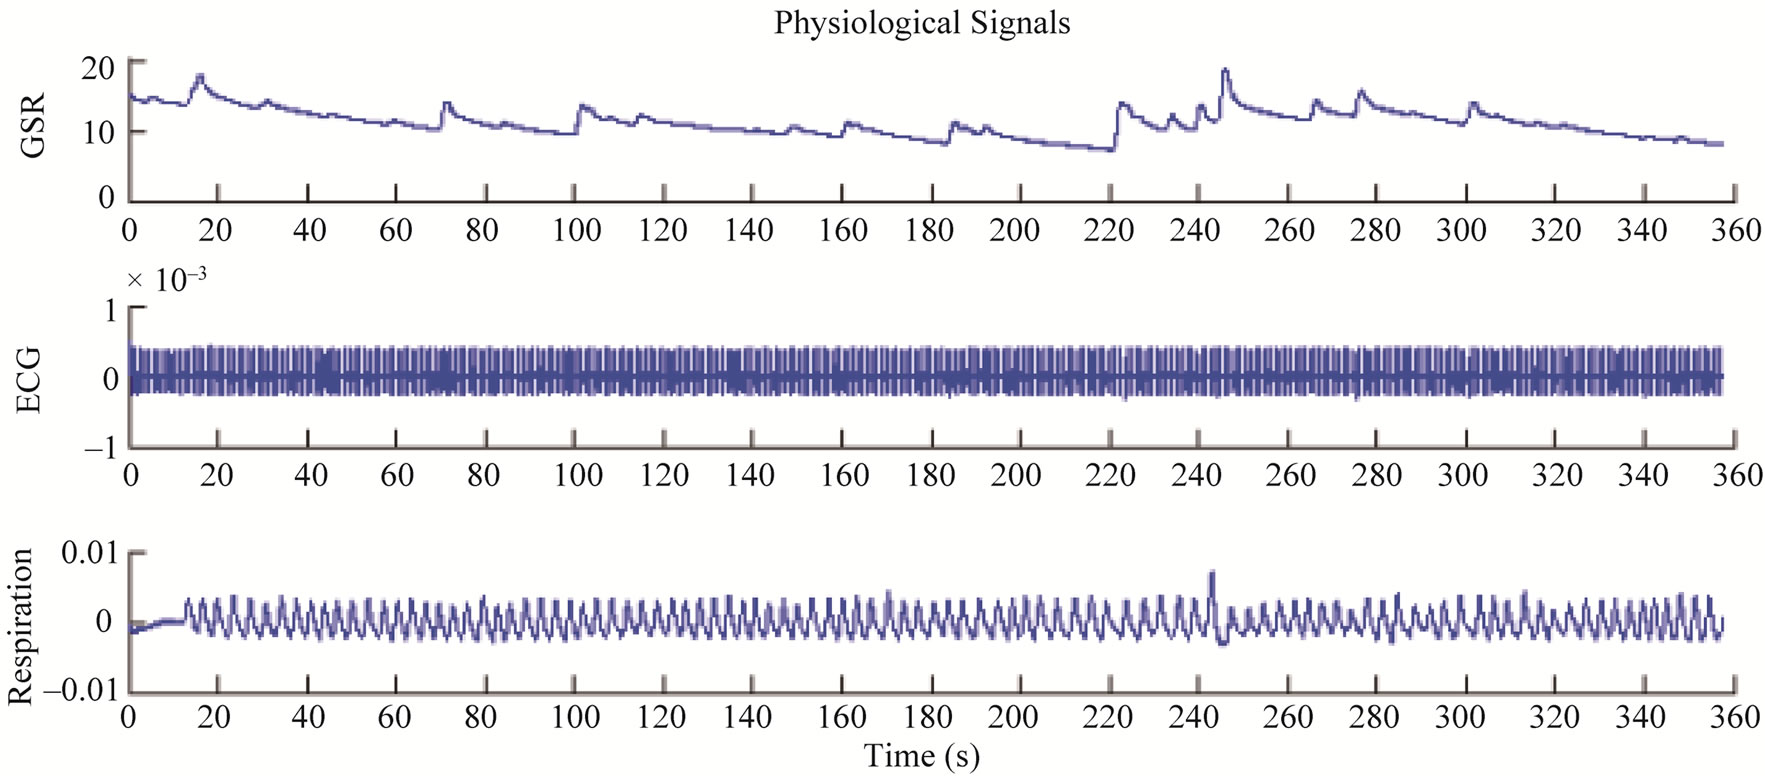
Figure 5. The physiological signals were recorded during main experiment from a subject that her physiological responses to shock test is shown in Figure 4. The signals from above are GSR, ECG and respiration. Baseline questions are finished in 100 (s) then emotional ones are started.
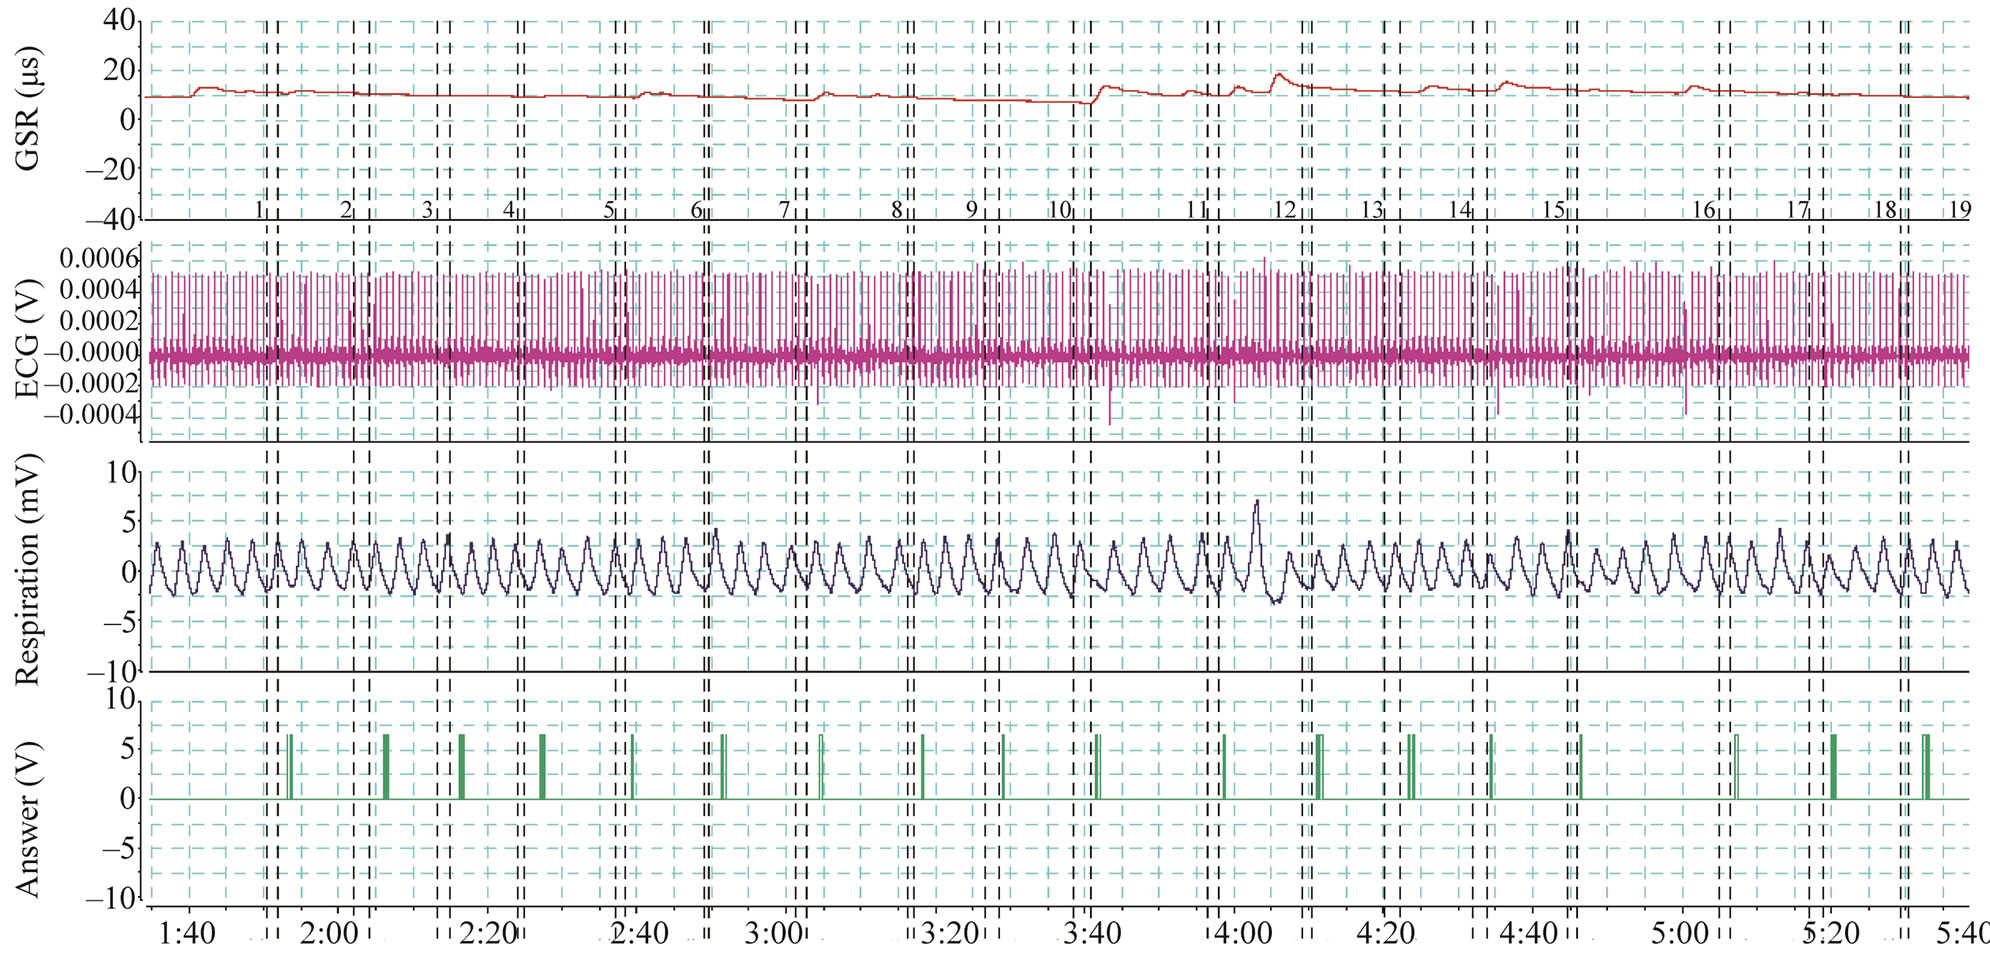
Figure 6. The physiological signals from original software (Chart) were recorded from a subject that her physiological responses are shown in Figures 4 and 5. The first signal from above is GSR, the second one is ECG, the third one is respiration and the last channel is subject response to each question which was recorded by pressing the push button. Each question is determined by a two comments which were instantly inserted in the start and the end of asking a question. The first seven questions are neutral ones and the other 19 questions are emotional question series. Emotional questions numbers in this sequence which was selected by the subject were 4, 7, 10, 13 and 17. According to the statements of the subject the question number 10 was lie and 11 was induced the sadness for him.
report, this question led to remembering a bad event. GSR increase as a result of these emotions seen in Figure 5, is clearly obvious.
6.2. Feature Extraction
The feature extracted from both ECG and Respiration signals are the average of the frequency of these signals between two questions during at least 10 Sec. These mean values are illustrated as a bar graph in Figures 7 and 8. Changing in physiological responses is clear, but some other changes were also observable in these bar graphs. Therefore analyzing the feature extractions by means of a machine is unavoidable, because detecting the emotion induction by human is difficult. The proposed method is Fuzzy-ART which is able to collect the same feature extraction together simultaneously. In this paper, three feature extraction of physiological parameters were applied as three inputs of Fuzzy-ART algorithm; MeanHR, Mean-RR and GSR-dif.
GSR-dif is defined by the equation below:

GSR-max: Maximum GSR which is induced after each question.
GSR-base: The average of maximum GSR which is induced after each baseline question in the first set.
6.3. Automatic Analysis
As it described before in Manual Analyze section, three feature extractions from three physiological parameters can be considered as feature or input vector that the process will be started initially with them. Each feature vector has three elements. For entering the Fuzzy-ART algorithm, these elements should be normalized as described in Emotion Recognition Algorithm section. Each input vector should be in the form below:
I: Input vector
α: Normalized Mean-HR
β: Normalized Mean-RR
γ: Normalized GSR-dif n: Question Number
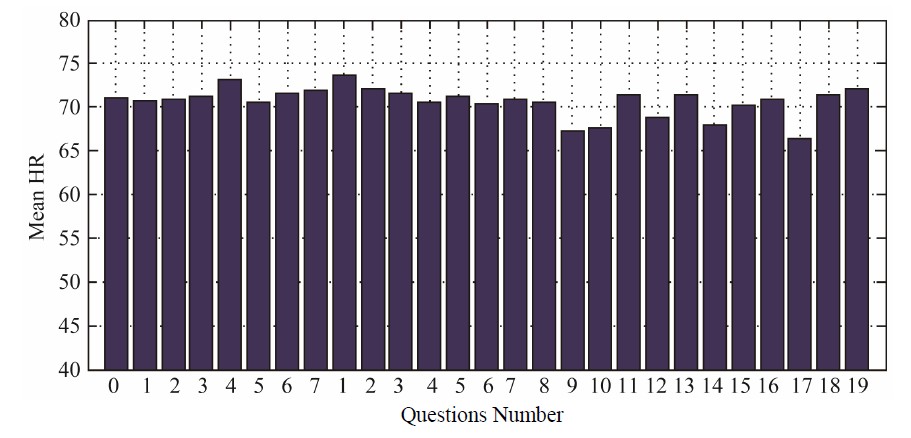
Figure 7. The bar graph of Mean-HR according to the physiological responses of previous subject which is shown in Figure 5. There are some changes in questions number 9, 10, 12, 14, 17.
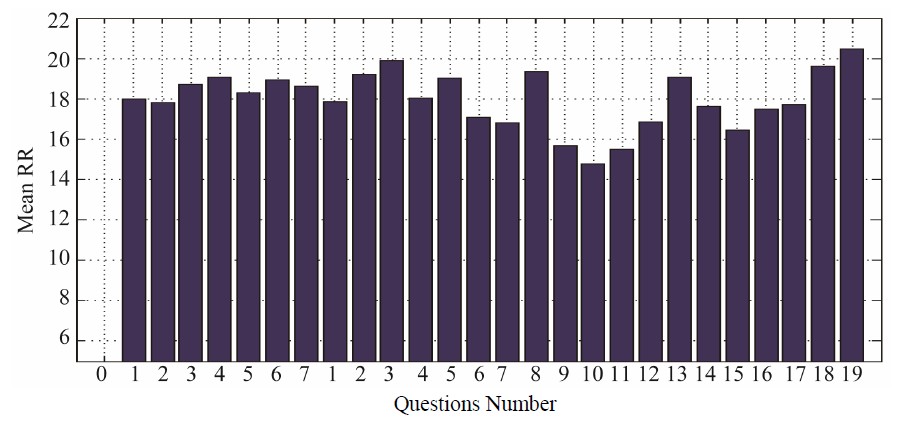
Figure 8. The bar graph of Mean-RR according to the physiological responses of previous subject which is shown in Figure 5. There are some changes in questions number 9, 10, 11, 15.
Figure 9 shows a scattering representation of each feature vector  which was extracted from physiological parameters of previous subject. The smaller box surrounds two questions which were induced negative emotions according to subject self-report. The bigger box includes the other questions which are considered as neutral questions in subject mind. As it is shown in Figure 9, two categorizations were achieved by physiological parameters of the previous subject. It is notable that how neutral questions provoke low excitation in GSR (bigger box) and on the contrary, the evidence of an arousal when undergoing an emotional state (smaller box).
7. Results
This algorithm has provided a decision system that is able to detect negative emotions from actual ones with accuracy of 80% and neutral emotions from actual ones with 96% and totally 94% from emotional set using three physiological parameters GSR, HR and RR measured only during a set of emotional questions. The number of questions led to emotion induction, is illustrated in Table 1. Other categories associate with emotions evoked by other reasons that might be cause of lying in unreal conditions.
8. Conclusions and Future Works
In this research the method for categorization between the negative and neutral emotions based on their dimensional characteristics, i.e., intensity (high or low arousal),
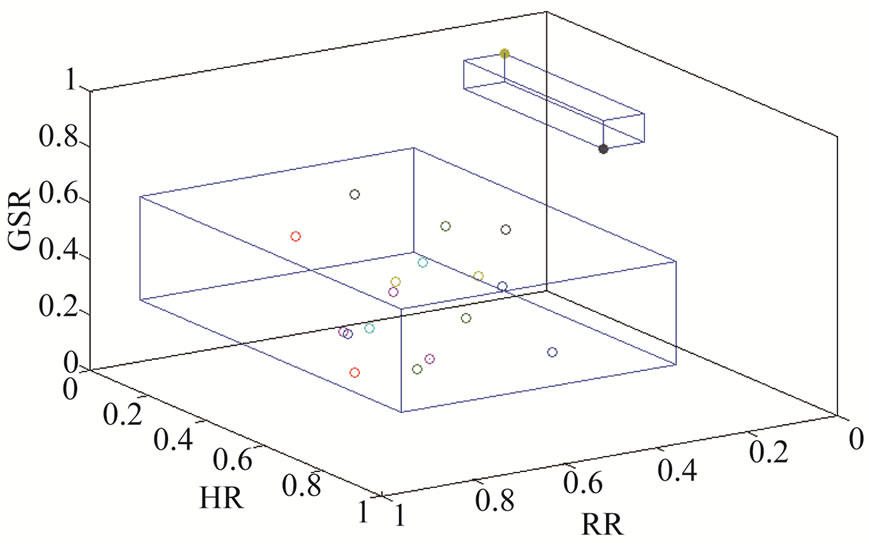
Figure 9. The physiological parameters were classified with two different category boxes.
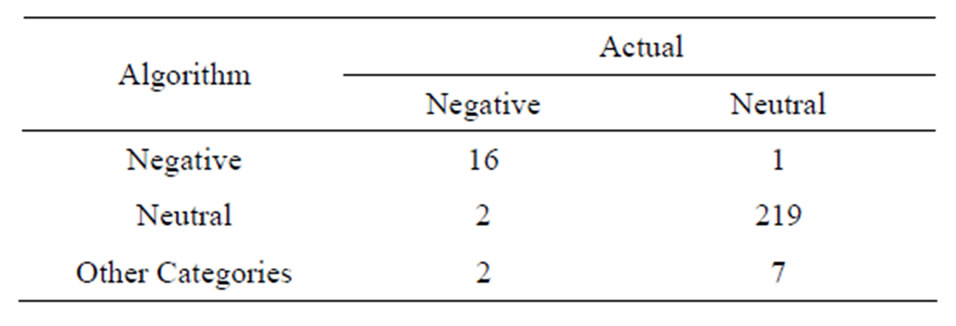
Table 1. Total number of questions from emotional set which were determined to each category by subject selfreport (Actual) and detected by Fuzzy-ART algorithm.
and valence (positive or negative) by employing FuzzyART was described. Although, using two elements in each input vector is usual because of complicated calculations, it is proposed to apply three elements as three physiological parameters collectively because at least two parameters have the same features when human is in same emotional states. Considering Shock test as a criterion can also evaluate the accuracy of outcomes because different people have different changes but this problem was ignored in many previous researches. This experiment determines the range of each physiological parameter. So, the personal differences of subjects’ physiological responses were successfully demonstrated by representation of this method. For example in some people, GSR doesn’t have sufficient sensitivity to detect. So in these cases, it is proposed to apply this method by input vector which contains of two features extracted from HR and RR parameters because normalized GSR leads to the feature vectors distribute along the GSR axis. And overlap between neutral and emotional classes is unavoidable.
Further investigation in manipulating the Fuzzy-ART algorithm may result in increased ability for the framework to fully classify all emotional states. In order to classification of each emotion state, it is proposed to provoke emotions by video or music to expand the time of emotion induction because classification with more input vectors which they have the same feature consequences more precise categories. Also, It is notable that when is high, Fuzzy ART frequently classifies the input data of the common categories into several categories, so category proliferation problem occurs. To solve this problem using Fuzzy-ART with variable vigilance parameter is proposed.
However, this method is suggested in employee screening, and pre-employment screening or for addicted person screening during the treatment. Furthermore, it can detect whether a matter is important for human or not.
REFERENCES
- R. M. Stern, W. J. Ray and K. S. Quigley, “Psychophysiological Recording,” 2nd Edition, Oxford University Press, New York, 2001. http://books.google.com/books/about/Psychophysiological_Recording.html
- “Psychophysiology Studies,” http://www.adinstruments.com/solutions/research/applications/psychophysiology-studies#method
- J. T. Cacioppo, G. G. Berntson, J. T. Larsen, K. M. Poehlmann and T. A. Ito, “The Psychophysiology of Emotion,” 2nd Edition, Guilford Press, New York, pp. 173-191.
- E. B. Ford, “Lie Detection: Historical, Neuropsychiatric and Legal Dimensions,” International Journal of Law and Psychiatry, Vol. 29, No. 3, 2006, pp. 159-177. doi:10.1016/j.ijlp.2005.07.001
- Committee to Review the Scientific Evidence on the Polygraph and National Research Council, “The Polygraph and Lie Detection,” The National Academies Press, Washington DC, 2003. http://www.nap.edu/catalog/10420.html
- W. G. Iacono, “Accuracy of Polygraph Techniques: Problems Using Confessions to Determine Ground Truth,” Physiology & Behavior, Vol. 95, No. 1-2, 2008, pp. 24-26. doi:10.1016/j.physbeh.2008.06.001
- E. Leon, G. Clarke, V. Callaghan and F. Sepulveda, “Real-Time Detection of Emotional Changes for Inhabited Environments,” Computers & Graphics, Vol. 28, No. 5, 2004, pp. 635-642. doi:10.1016/j.cag.2004.06.002
- P. Ekman, “Facial Expression and Emotion,” American Psychologist, Vol. 48, No. 4, 1993, pp. 384-392. doi:10.1037/0003-066X.48.4.384
- H. Holzapfel, M. Denecke, C. Fuegen and A. Waibel, “Integrating Emotional Cues into a Framework for Dialogue Management,” Proceedings of Fourth IEEE International Conference on Multimodal Interfaces (ICMI’02), Pittsburgh, 14-16 October 2002, pp. 141-146.
- C. D. Katsis, N. Katertsidis, G. Ganiatsas and D. I. Fotiadis, “Toward Emotion Recognition in Car-Racing Drivers: A Biosignal Processing Approach,” IEEE Transactions on Systems, Man and Cybernetics—Part A: Systems and Humans, Vol. 38, No. 3, 2008, pp. 502-512. doi:10.1109/TSMCA.2008.918624
- G. Turpin and L. Harrison, “Electrodermal Activity,” In: G. Fink, Ed., Encyclopedia of Stress, Academic Press, San Diego, 2000, pp. 25-27. http://books.google.com/books/about/Encyclopedia_of_Stress.html
- C. Zocchi, A. Rovetta and F. Fanfulla, “Physiological Parameters Variation during Driving Simulations,” IEEE International Conference on Advanced Intelligent Mechateronics, Zurich, 4-7 September 2007, pp. 1-6.
- S. Layeghi, M. Dastmalchi, E. Jacobs and R. B. Knapp, “Pattern Recognition of the Polygraph Using Fuzzy Classification,” Proceedings of the Third IEEE Conference on Fuzzy Systems, Orlando, 26-29 June 1994, pp. 1825-1829. doi:10.1109/FUZZY.1994.343582
- E. Jang, B. Park, S. Kim, C. Huh, Y. Eum and J. Sohn “Emotion Recognition through ANS Responses Evoked by Negative Emotions,” The Fifth International Conference on Advances in Computer-Human Interactions (ACHI), Valencia, 30 January-4 February 2012, pp. 218-223.
- C. Chang, J. Zheng, C. Wang and P. Chung “Application of Support Vector Regression for Physiological Emotion Recognition,” International Computer Symposium, Tainan, 16-18 December 2010, pp. 12-17.
- C. K. Lee, S. K. Yoo, Y. J. Park, N. H. Kim, K. S. Jeong and B. C. Lee, “Using Neural Network to Recognize Human Emotions from Heart Rate Variability and Skin Resistance,” 27th Annual Conference on Engineering in Medicine and Biology, Shanghai, 17-18 January 2006, pp. 5523-5525.
- J. N. Bailenson, E. D. Pontikakis, I. B. Mauss, J. J. Gross, M. E. Jabon, C. A. C. Hutcherson, C. Nass and O. John, “Real-Time Classification of Evoked Emotions Using Facial Feature Tracking and Physiological Responses,” International Journal of Human-Computer Studies, Vol. 66, 2008, pp. 303-317. doi:10.1016/j.ijhcs.2007.10.011
- A. S. Sierra, C. S. Ávila, J. G. Casanova and G. B. Pozo “A Stress-Detection System Based on Physiological Signals and Fuzzy Logic,” IEEE Transactions on Industrial Electronics, Vol. 58, No. 10, 2011, pp. 4857-4865. doi:10.1109/TIE.2010.2103538
- P. Karthikeyan, M. Murugappan and S. Yaacob, “A Review on Stress Inducement Stimuli for Assessing Human Stress Using Physiological Signals,” IEEE 7th International Colloquium on Signal Processing and Its Applications, Penang, 4-6 March 2011, pp. 420-425.
- B. Aysin, J. Colombo and E. Aysin, “Comparison of HRV Analysis Methods during Orthostatic Challenge: HRV with Respiration or without?” Proceedings of the 29th Annual International Conference of the IEEE EMBS, Lyon, 23-26 August 2007, pp. 5047-5050.
- R. J. Bryg, T. Vybiral and M. Maddens, “The Effect of Controlled Respiration on Parameters of Heart Rate Variability,” Proceedings of the IEEE Conference on Computers in Cardiology, Chicago, 23-26 September 1990, pp. 255-258.
- M. E. Dawson, A. M. Schell and D. L. Filion, “Handbook of Psychophysiology,” Cambridge University Press, New York, 2000.
- M. T. Jones, “Artificial Intelligence: A Systems Approach,” Infinity Science Press, Hingham, 2008.
- G. A. Carpenter, S. Grossberg and D. B. Rosen, “Fuzzy ART: Fast Stable Learning and Categorization of Analog Patterns by Adaptive Resonance System,” Neural Networks, Vol. 4, 1991, pp. 759-771. doi:10.1016/0893-6080(91)90056-B
- L. Jain, B. Lazzerini and H. Ugur, “Innovations in Art Neural Networks,” Physica-Verlag, Heidelberg, 2000. http://books.google.com/books/about/Innovations_in_Art_Neural_Networks.html
- D. Papada and K. W. Jablokow, “Conceptual Design of a Driving Habit Recognition Framework,” IEEE Symposium on Computational Intelligence in Vehicle and Transportation Systems, Paris, 11-15 April 2011, pp. 59-66.
- H. Isawa, H. Matsushita and Y. Nishio, “Fuzzy ART Combining Overlapped Categories Using Variable Vigilance Parameters,” International Workshop on Nonlinear Circuits and Signal Processing, Waikiki, 1-3 March 2009, pp. 661-664.