Advances in Materials Physics and Chemistry
Vol.3 No.1A(2013), Article ID:30340,7 pages DOI:10.4236/ampc.2013.31A007
Fitting Full X-Ray Diffraction Patterns for Quantitative Analysis: A Method for Readily Quantifying Crystalline and Disordered Phases
1Chesapeake Energy Corporation, Oklahoma City, Oklahoma, USA
2Indiana University, Bloomington, Indiana, USA
Email: Steve.Chipera@chk.com, Bish@Indiana.edu
Copyright © 2013 Steve J. Chipera, David L. Bish. This is an open access article distributed under the Creative Commons Attribution License, which permits unrestricted use, distribution, and reproduction in any medium, provided the original work is properly cited.
Received January 17, 2013; revised March 5, 2013; accepted April 10, 2013
Keywords: Full-Pattern; Quantitative; X-Ray; Diffraction; XRD
ABSTRACT
Fitting of full X-ray diffraction patterns is an effective method for quantifying abundances during X-ray diffraction (XRD) analyses. The method is based on the principal that the observed diffraction pattern is the sum of the individual phases that compose the sample. By adding an internal standard (usually corundum) to both the observed patterns and to those for individual pure phases (standards), all patterns can all be normalized to an equivalent intensity based on the internal standard intensity. Using least-squares refinement, the individual phase proportions are varied until an optimal match is reached. As the fitting of full patterns uses the entire pattern, including background, disordered and amorphous phases are explicitly considered as individual phases, with their individual intensity profiles or “amorphous humps” included in the refinement. The method can be applied not only to samples that contain well-ordered materials, but it is particularly well suited for samples containing amorphous and/or disordered materials. In cases with extremely disordered materials where no crystal structure is available for Rietveld refinement or there is no unique intensity area that can be measured for a traditional RIR analysis, full-pattern fitting may be the best or only way to readily obtain quantitative results. This approach is also applicable in cases where there are several coexisting highly disordered phases. As all phases are considered as discrete individual components, abundances are not constrained to sum to 100%.
1. Introduction
X-ray powder diffraction (XRD) has been the preferred choice for qualitative phase analysis for close to 100 years since von Laue’s discovery of the diffraction of Xrays in 1912 [1]. Methods for the quantification of X-ray diffraction data have been slower to develop, progressing through theory but more importantly, with developing computational power. Quantitative X-ray diffraction analysis (QXRD) is based on the fact that the intensities of diffraction peaks from a given phase are related to the phase’s abundance in a mixture. However, various samplerelated effects usually prevent us from directly comparing peak intensities for a phase in a mixture with those from the pure phase prepared and run under similar conditions.
The Reference Intensity Ratio (RIR) method has been one of the most popular methods for general quantitative phase analysis over the past forty years [2-9]. This method involves comparing the intensity of one or more peaks of a phase with the intensity of a peak of a standard (usually the corundum 113 reflection) in a 50:50 mixture by weight. If these intensity ratios are known for all phases in a sample, the weight abundance can be determined for every phase in the sample. The use of an internal standard can correct for absorption and matrix effects (see [2] for an excellent discussion of the RIR theory). The RIR method has the benefit that it is straight forward and easy to implement. In addition, if a known amount of an internal standard is added to a multicomponent sample, then an amorphous component can be determined by the difference from 100% (i.e., amorphous abundance = 100% − sum of crystalline phases). However, as the method generally uses only one or a series of reflections, it can suffer from the effects of variable chemistry and preferred orientation of individual phases. In addition, although amorphous materials can be treated with this method, analysis of such materials is limited because those phases often do not have distinct scattering signatures whose intensities can be readily measured.
More recently, the Rietveld method [10] was adapted for quantitative XRD analysis [11,12]. Rietveld quantitative analysis involves calculating diffraction patterns of individual components of a mixture using a crystal structure model. The resultant simulated pattern is fit to an observed pattern by varying parameters of the model(s). The Rietveld method is very powerful and provides not only abundances but also provides other quantitative measurements such as unit-cell parameters, atomic occupancies, and information on crystallite size/strain. Most XRD instrument manufactures today offer some form of Rietveld refinement in their XRD software packages. Current Rietveld refinement programs typically require that the crystal structure of all component phases is known and that the phases are three-dimensionally ordered, which excludes materials such as glasses, polymers, and even natural geologic materials such as clay minerals.
An alternate method which is based on fitting of full XRD patterns to observed data has been proposed for obtaining quantitative abundances [13-18]. This method blends the advantages of the RIR and Rietveld methods. The full-pattern fitting method is similar to the RIR method but instead of using a single reflection, entire diffraction patterns are used. By using full diffraction patterns, including the background which contains important information on sample composition and matrix effects, explicit analysis of amorphous or partially ordered materials can often be readily accomplished if the amorphous/disordered phases are included in the analyses as distinct phases to be fit. In this case, the amorphous abundance can be measured directly rather than being determined as the difference from 100%. Like the Rietveld method, full-pattern fitting routines typically use least-squares minimization to optimize the fit of the library standards to the observed pattern, thereby minimizing user intervention. The use of full patterns compensates for preferred orientation and chemical variability (averaging reflections that are too strong with reflections that are too weak). The method can be easily applied to any mineralogical or materials system and requires little crystallographic background, as long as suitable standards are available. This paper describes the methodology behind full-pattern fitting and provides information for creating/generating standard patterns for quantitative analysis.
2. Methodology
Full-pattern fitting for QXRD analysis requires generation of a library of standard patterns, including a pattern for each phase expected in the analysis. These libraries generally contain patterns of well-ordered phases, but they can include patterns for any material including glasses, polymers, clay minerals, organic materials, gels, pharmaceuticals, etc. In addition, simulated or calculated patterns may also be included in the library if it is not possible to obtain a pure sample of a material of interest. As with the traditional RIR method [2], an internal standard should be used to compensate for instrumental and sample matrix effects and to put all standard patterns on an equal-intensity basis so that unconstrained-total analyses can be made. This is readily accomplished if standards and samples are prepared in the same way, by adding to each a small, known portion of an internal standard. The internal standard may be any consistent material, but corundum has been the material of choice for many years [4] as it is stable, readily available, and typically has few peak overlaps on the phases of interest in the unknown samples. Using corundum as the reference material also facilitates analysis and preparation of standards, as most databases such as the ICDD powder diffraction file often list an I/Ic value (intensity of the phase 100% peak divided by the 100% peak of corundum). Any ratio of internal standard to sample can be used, but in our laboratories we have found that a mixture of 80% sample to 20% corundum is an optimal ratio.
Full-pattern fitting begins by scaling patterns for the sample and standards so they are on an equal-intensity basis. This process takes advantage of the internal standard, ensuring that the corundum intensity for each standard pattern is the same as that of the corundum in the sample pattern. During full-pattern fitting, the corundum intensity for all individual standard patterns for all phases in the sample will sum to match the corundum intensity in the sample pattern. Although it is possible to scale the intensity of the corundum in each standard pattern individually to the corundum in the observed pattern (to put all patterns on a normalized intensity basis), the process is easier if all standard patterns have been normalized to an equal-corundum-intensity basis beforehand. In this case, it is necessary to match the corundum intensity in only a single standard pattern to the corundum intensity in the sample pattern and then apply this scaling factor to all phases in the sample [17]. This process involves normalization of the corundum intensity that has been added to the each standard library pattern to the intensity of a single pure corundum pattern (can be scaled down by 80% to derive scaling factors closer to 1).
Full-pattern fitting operates on the principle that the patterns for all phases in a sample are additive. FULLPAT [16-18] is a full-pattern fitting program that performs quantitative analysis by fitting the sum of individual pure standard patterns to the observed pattern via a least-squares minimization to optimize the fit. As the same amount of internal standard is used in both standards and unknowns, matching standard patterns to the observed pattern is a PERCENT match—a perfect match being 100%.
Figure 1 shows the result of a FULLPATfull-pattern fit of individual standard patterns to a sample containing well-ordered phases (calcite, dolomite, quartz). Pattern (a) is the observed pattern; (b) are the patterns of the individual phases fit to the observed pattern; (c) is the summation of the individual phases fit the to the observed pattern; and (d) is the difference pattern generated by subtracting the sum of the individual standard patterns from the observed pattern. The difference pattern not only provides a good assessment of the overall fit, but phases not accommodated or included in the analysis are readily apparent. As seen in the difference plot, the fit for this analysis is very good, with an unconstrained total of 100.2 weight%. As all phases in this example are well ordered, this analysis could be conducted readily with any of the three standard XRD quantitative methods (RIR, Rietveld, full-pattern).
Figure 2 shows the results obtained for a mineral mix
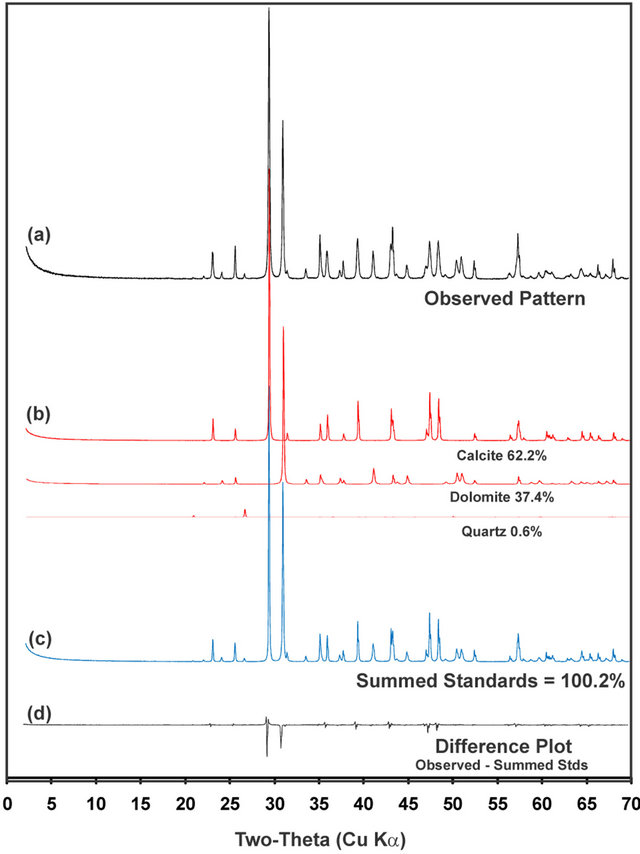
Figure 1. FULLPAT analysis of a sample containing wellordered phases. Pattern (a) is the observed pattern; (b) are the patterns of the individual phases fit to observed pattern; (c) is the summation of the individual phases fit the to the observed pattern; and (d) is the difference pattern between the observed and summed standard patterns. The amounts used in the analysis are listed by the individual patterns.
ture containing a significant amount of volcanic glass. This example demonstrates the ability of the full-pattern fitting method to analyze samples containing amorphous or poorly ordered phases. This analysis was not constrained and did not require that the sum of all phases in the mixture, including the amorphous component, be normalized to 100% as it would with the RIR and many Rietveld programs. Because the entire pattern including the background was used, the amorphous component was treated simply as another phase in the least-squares refinement. As seen in the difference plot, the fit for this analysis is very good, with an unconstrained total of 98.2 weight%.
There are many examples for which full-pattern fitting methods are recommended over others. Indeed, the fullpattern fitting approach is often the method of choice for analyzing systems containing extremely disordered phases for which no crystal structure is available. Similarly, XRD patterns having no unique peak or intensity area(s) that can be used for traditional RIR analyses can be analyzed by full-pattern methods. An example of the latter is shown in Figure 3, which illustrates data for a reaction product of heat-treated serpentine reacted in an autoclave at 200˚C under high CO2 pressure. The pattern shows evidence for a significant component of the initial disordered meta-serpentine reactant, which produces only broad and poorly defined regions of scattering. The observed pattern (with 20% corundum internal standard added) can be readily fit using measured standard patterns (also with 20% corundum internal standard added) of the meta-serpentine (along with minor amounts of chlorite and lizardite that were in the initial reactant) and
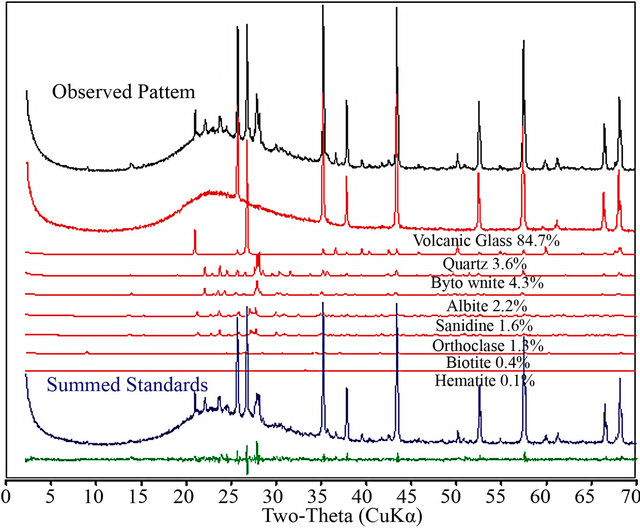
Figure 2. This example demonstrates the ability of fullpattern fitting to analyze samples containing amorphous or poorly ordered phases (black pattern). Fitting the individual standard components (red patterns) to the observed pattern yields a sum (blue pattern) which is an excellent fit to the observed pattern.

Figure 3 Full-pattern fitting analysis of an autoclaved (200˚C, high CO2 pressure) heat-treated serpentine. No crystal structure is available for the meta-serpentine material, making Rietveld refinement difficult, and there are no distinct peak(s) or area(s) of intensity that can be used in RIR analysis. By including a pure meta-serpentine pattern as one of the standard phases, a very good fit was obtained, giving an unconstrained total of 99.5 wt%.
opal and magnesite reaction products. The difference pattern shows a very good fit, with an unconstrained total of 99.5 wt%.
Although it is desirable to add an internal standard to unknown samples, as this allows unconstrained analyses, there are times when the addition of an Al2O3 standard to a sample is undesirable. Fortunately, the full-pattern fitting method can be applied without the addition of an internal standard, making the analysis analogous to the adiabatic flushing method described by [3]; this approach assumes that all the standard library patterns have been scaled to a constant corundum intensity. In this case, analyses are conducted as with the internal standard method, but the assumption is made that the sum of all phases must be 100%. However, because amorphous and disordered phases are included as independent phases in the analyses, their relative abundances are also determined independently during the analysis. The last step in the analysis is to simply normalize the relative percentages so that the sum of all phases is 100%.
3. Sample Preparation
As always in XRD analyses, sample preparation is extremely important in producing good X-ray diffraction results. For example, crystallite sizes generally <5 µm are required to ensure adequate particle statistics and to help reduce preferred orientation, primary extinction, and other sample-related effects [19,20]. Such particle sizes are readily obtainable with modern laboratory mills (e.g., McCrone Micronizing mill). Numerous methods can be employed to reduce preferred orientation such as using back-packed or side-drifted sample mounts, or using spraydried sample agglomerates to minimize or eliminate orientation effects [21]. Special sample handling methods have also been developed for field-portable XRD instruments that can randomize coarse particles up to 150 µm in size [22]. Although full-pattern methods can accommodate some particle-size and sample-related effects such as preferred orientation by using standards that exhibit the same effects as samples, it is always best to remove the various sources of error by judicious sample preparation.
4. Standards for Full-Pattern Fitting
As with any analytical method using standards, selection of standards matching the materials in unknowns is crucial, and this is no exception with full-pattern fitting QXRD. Individual machine configurations can significantly affect measured diffraction patterns. For example, theta-compensating slits, size of incident slits, Soller slits, radius of the goniometer circle, sample area, sample thickness, sample mount material, etc., can all have profound influence on measured diffraction patterns. Therefore, it is important to recognize that the quality of fullpattern quantitative analysis depends strongly on the quality of the standard library patterns. One should use patterns generated on another instrument or with different instrumental configurations only when necessary. Indeed, we do not share our measured standard patterns without this caveat. Figure 4 compares the diffraction pattern of a kaolinite: Al2O3 80:20 mixture collected on a Siemens D500 diffractometer with that produced from a Bruker D4 optimized for rapid throughput of production runs. Although many of the instrumental parameters such as goniometer radius and incident-beam optics are similar, the D4 machine has been optimized for maximum intensity for high sample throughput. These optimizations result in an elevated background, including low-angle artifacts resulting from scattering from the sample mount. Rietveld methods often experience difficulty modeling these low-angle artifacts, and the lowest-angle data are often excluded from refinement. However, such instrumental
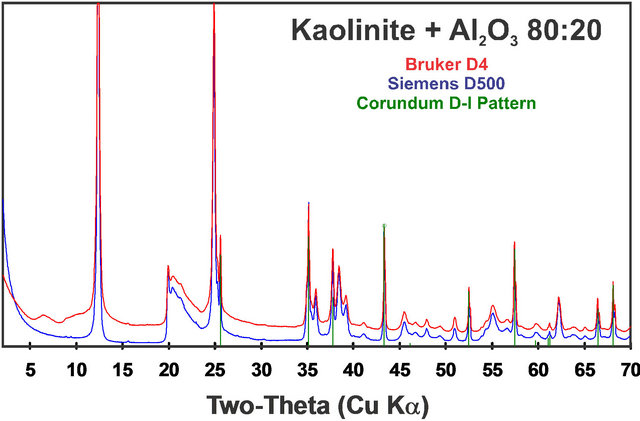
Figure 4. Diffraction patterns of a kaolinite:Al2O3 80:20 mixture collected on a Siemens D500 diffractometer compared with data collected on a Bruker D4 optimized for rapid throughput of production runs. Differences in the machine parameters and sample mounts result in differences in the patterns, including background and low-angle artifacts along with peak breadth and intensity differences.
artifacts are explicitly included in standard and sample diffraction patterns when applying the full-pattern fitting method, as long as both sets of data were measured in identical fashion using identical instrument parameters. Thus, by fitting entire patterns including the background, such artifacts are explicitly included in the full-pattern analysis. It is also possible to include a pure background pattern as one of the “phases” in the full-pattern analysis, thereby modeling any background effects; this is especially important when using calculated patterns for reference standards.
In some cases, a standard material might be very difficult to obtain or too valuable to “contaminate” with an internal standard. In such cases, one can measure the pattern of the pure standard and then “add” the pattern of pure corundum in the appropriate amount as dictated by a published, measured, or calculated RIR value. This process involves measurement of the area of a peak of interest in the pure-phase pattern, measurement of the area of the reference peak in the pure-corundum pattern, and scaling the pure-phase pattern using the RIR before adding the corundum pattern to create the library pattern.
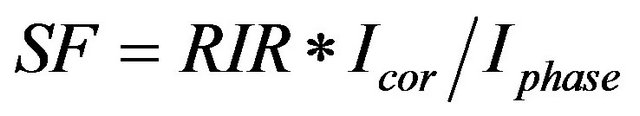 (1)
(1)
SF = scale factor to apply to the pure-phase pattern;
RIR = reference intensity ratio;
Icor = integrated intensity of the corundum peak used for the RIR;
Iphase = integrated intensity of the pure phase peak used for the RIR.
An alternate method to obtain a standard pattern if a pure phase is not available is to calculate the pattern from published crystal structure data, ideally using analyti- cal or fundamental-parameter profile parameters for the instrument used for analysis. Most instrument companies provide software to calculate powder diffraction patterns, and there are numerous third-party software packages available, all based on methods and principles similar to those first incorporated in POWD10 [23]. At a minimum, instrumental profile shapes are required, along with an understanding of the variation in instrumental full-width at half maximum (FWHM) values as a function of 2θ. We have applied this process with the inXitu TERRA XRD instrument, a field-portable, miniaturized X-ray diffractometer that uses a micro-focus Co X-ray tube and a CCD detector [24-26]. We used beryl to obtain peak profiles and FWHM data as a function of 2θ (Figure 5) to characterize the instrumental behavior of the TERRA diffractometer. Peak shapes from TERRA can be fit with either a pseudo-Voigt or Pearson VII function but tend to be rather Gaussian in nature.
5. Validation of Quantitative XRD Methods
Demonstration of accuracy and precision in QXRD analyses is typically difficult. Unlike chemical standards, few QXRD standards exist with known phase composition supplied by a nationally recognized source such as the National Institute of Standards and Technology (NIST). Researchers generally must prepare their own standard mixtures to assess accuracy [9,17], participate in a roundrobin event [27], and/or compare with results of other analyses, such as optical microscopy or chemical normative calculations. The Clay Minerals Society holds a quantitative mineralogical analysis competition every two years that has served as an effective evaluation of a variety of QXRD methods applied to clay mineral-bearing samples. The Reynolds Cup competition, named after Prof. Robert C. Reynolds, Jr., for his pioneering work in quantitative clay mineralogy and his contributions to clay science, was established in 2000 (http://www.clays.org/society%20awards/RCintro.html).
Unlike other round-robin events that often use wellordered, high-symmetry phases [27], the Reynolds Cup competition uses mixtures of pure phases in known abundances that represent realistic sedimentary rock compositions. The competition is open to all analytical methods, and recently more than 75 contestants from over 20 countries entered the competition, representing commercial, industrial, government, and academic laboratories. Every two years, three clay mineral-bearing mixtures are prepared from pure mineral standards by the organizers and are sent to anyone wishing to enter the competition. In general, XRD is the primary analytical method employed by successful entrants, often supported by other methods such as chemistry and microscopy. Although RIR, Rietveld refinement, and full-pattern fitting methods have placed in the top three positions, Rietveld refinement and
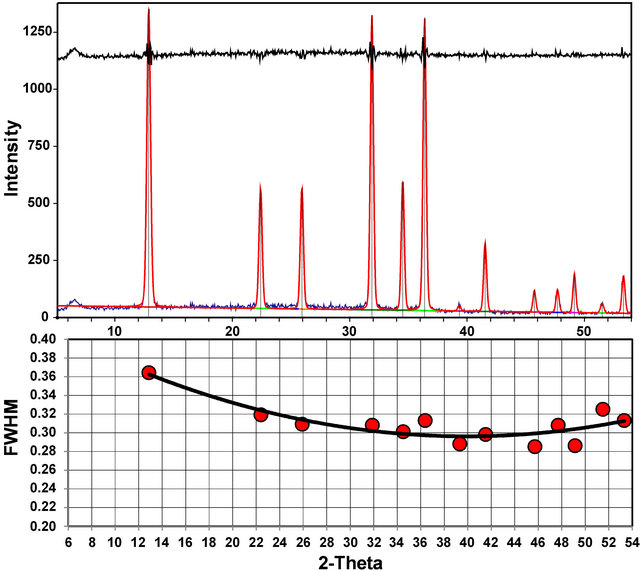
Figure 5. XRD pattern of beryl collected on a TERRA field-portable XRD instrument, used to determine the 2q-dependent peak profiles needed to simulate instrument-dependent standard patterns.
full-pattern fitting methods have been the most successful [28].
6. Conclusions
Although various methods can be used to conduct quantitative XRD analyses, full-pattern fitting is an efficient and easy method that can be used for even the most difficult samples containing highly disordered materials. In some cases, with highly disordered materials where no crystal structure is available, with materials that have no unique intensity area that can be measured, or in samples containing several coexisting highly disordered phases, full-pattern fitting may be the only way to obtain quantitative results. The primary limitation of the method, as with most other methods, is in obtaining and/or generating standard patterns of pure phases. The use of an internal standard with unknowns and standards is generally recommended and the method is easiest if all standard patterns have first been normalized to an equivalent internal standard intensity.
For further information on full-pattern quantitative analysis, the interested reader is directed to [17] describing the FULLPAT quantitative method and software package. FULLPAT has been coded using standard Microsoft EXCEL and is free and publicly available [18] by downloading from http://www.ccp14.ac.uk/ccp/web-mirrors/fullpat/.
REFERENCES
- M. Eckert, “Disputed Discovery: The Beginnings of XRay Diffraction in Crystals in 1912 and Its Repercussions,” Acta Crystallographica Section A, Vol. 68, 2012, pp. 30-39. doi:10.1107/S0108767311039985
- F. H. Chung, “Quantitative Interpretation of X-Ray Diffraction Patterns of Mixtures. I. Matrix-Flushing Method for Quantitative Multicomponent Analysis,” Journal of Applied Crystallography, Vol. 7, 1974, pp. 519-525. doi:10.1107/S0021889874010375
- F. H. Chung, “Quantitative Interpretation of X-Ray Diffraction Patterns of Mixtures. II. Adiabatic Principle of XRay Diffraction Analysis of Mixtures,” Journal of Applied Crystallography, Vol. 7, 1974, pp. 526-531. doi:10.1107/S0021889874010387
- C. R. Hubbard, E. H. Evans and D. K. Smith, “The Reference Intensity Ratio, I/Ic, for Computer Simulated Powder Patterns,” Journal of Applied Crystallography, Vol. 9, 1976, pp. 169-174. doi:10.1107/S0021889876010807
- B. L. Davis, “Reference Intensity Quantitative Analysis Using Thin-Layer Aerosol Samples,” Advances in X-Ray Analysis, Vol. 27, 1984, pp. 339-348. doi:10.1007/978-1-4613-2775-2_38
- G. A. Pawloski, “Quantitative Determination of Mineral Content of Geological Samples by X-Ray Diffraction,” American Mineralogist, Vol. 70, No. 7-8, 1985, pp. 663- 667.
- D. L. Bish and S. J. Chipera, “Problems and Solutions in Quantitative Analysis of Complex Mixtures by X-Ray Powder Diffraction,” Advances in X-Ray Analysis, Vol. 31, 1988, pp. 295-308. doi:10.1007/978-1-4613-1035-8_32
- D. L. Bish and S. J. Chipera, “Accuracy in Quantitative X-Ray Powder Diffraction Analyses,” Advances in X-Ray Analysis, Vol. 38, 1995, pp. 47-57. doi:10.1007/978-1-4615-1797-9_5
- S. J. Chipera and D. L. Bish, “Multireflection RIR and Intensity Normalizations for Quantitative Analyses: Applications to Feldspars and Zeolites,” Powder Diffraction, Vol. 10, No. 1, 1995, pp. 47-55. doi:10.1017/S0885715600014305
- H. M. Rietveld, “A Profile Refinement Method for Nuclear and Magnetic Structures,” Journal of Applied Crystallography, Vol. 2, 1969, pp. 65-71. doi:10.1107/S0021889869006558
- R. J. Hill and C. J. Howard, “Quantitative Phase Analysis from Neutron Powder Diffraction Data Using the Rietveld Method,” Journal of Applied Crystallography, Vol. 20, 1987, pp. 467-474. doi:10.1107/S0021889887086199
- D. L. Bish and S. A. Howard, “Quantitative Phase Analysis Using the Rietveld Method,” Journal of Applied Crystallography, Vol. 21, 1988, pp. 86-91. doi:10.1107/S0021889887009415
- D. K. Smith, G. G. Johnson Jr., A. Scheible, A. M. Wims, J. L. Johnson and G. Ullmann, “Quantitative X-Ray Powder Diffraction Method Using the Full Diffraction Pattern,” Powder Diffraction, Vol. 2, No. 2, 1987, pp. 73-77. doi:10.1017/S0885715600012409
- G. Cressey and P. F. Schofield, “Rapid Whole-Pattern Profile-Stripping Method for the Quantification of Multiphase Samples,” Powder Diffraction, Vol. 11, No. 1, 1996, pp. 35-39. doi:10.1017/S0885715600008885
- M. Batchelder and G. Cressey, “Rapid, Accurate Phase Quantification of Clay-Bearing Samples Using a PositionSensitive X-Ray Detector,” Clays and Clay Minerals, Vol. 46, No. 2, 1998, pp. 183-194. doi:10.1346/CCMN.1998.0460209
- S. J. Chipera and D. L. Bish, “FULLPAT: An Improved Full-Pattern Quantitative X-Ray Diffraction Method,” Proceedings of the 38th Annual Clay Minerals Society Meeting, Madison, 16-20 June 2001, p. 105.
- S. J. Chipera and D. L. Bish, “FULLPAT: A Full-Pattern Quantitative Analysis Program for X-Ray Powder Diffraction Using Measured and Calculated Patterns,” Journal of Applied Crystallography, Vol. 35, 2002, pp. 744- 749. doi:10.1107/S0021889802017405
- S. J. Chipera and D. L. Bish, “FULLPAT: A Full-Pattern Quantitative Analysis Program for X-Ray Powder Diffraction,” International Union of Crystallography, Commission on Powder Diffraction Newsletter, No. 27, 2002, pp. 27-28.
- H. P. Klug and L. E. Alexander, “X-Ray Diffraction Procedures for Polycrystalline and Amorphous Materials,” John Wiley & Sons, Inc., New York, 1974.
- D. L. Bish and R. C. Reynolds Jr., “Sample Preparation for X-Ray Diffraction,” In: D. L. Bish and J. E. Post, Eds., Modern Powder Diffraction, Mineralogical Society of America Reviews in Mineralogy, Washington DC, Vol. 20, 1989, pp. 73-99.
- S. Hillier, “Use of an Air Brush to Spray Dry Samples for X-Ray Powder Diffraction,” Clay Minerals, Vol. 34, No. 1, 1999, pp. 127-135. doi:10.1180/000985599545984
- P. Sarrazin, S. Chipera, D. Bish, D. Blake and D. Vaniman, “Vibrating Sample Holder for XRD Analysis with Minimal Sample Preparation,” Proceedings of the 53rd Annual Denver X-Ray Conference, Steamboat Springs, 2- 6 August 2004, p. 89.
- D. K. Smith, M. C. Nichols and M. E. Zolensky, “POWD 10, a FORTRAN IV Program for Calculating X-Ray Powder Diffraction Patterns, Version 10,” Pennsylvania State University, College of Earth and Mineral Sciences report, University Park, Pennsylvania, 1983.
- P. Sarrazin, D. Blake, S. Feldman, S. Chipera, D. Vaniman and D. Bish, “Field Deployment of a Portable XRD/ XRF Instrument on Mars Analog Terrain,” Advances in X-Ray Analysis, Vol. 48, 2005, pp. 194-203.
- S. J. Chipera, P. Sarrazin, L. Alcantar-Lopez, D. T. Vaniman, D. L. Bish, D. Blake and G. Chiari, “Real-Time XRD-XRF at a Mars-Analog Sulfate Site in Leadville, Colorado, Using a CHEMIN-Heritage Instrument,” 40th Lunar and Planetary Science Conference, 23-27 March 2009, Houston, No. 1328.
- M. Wilkinson, “Beyond Terra Firma,” Chemistry World, Vol. 7, No. 3, 2010, pp. 50-53.
- I. C. Madsen, N. V. Y. Scarlett, I. M. D. Cranswick and L. Thaung, “Outcomes of the International Union of Crystallography Commission on Powder Diffraction Round Robin on Quantitative Phase Analysis: Samples 1a to 1h,” Journal of Applied Crystallography, Vol. 34, 2001, pp. 409-426. doi:10.1107/S0021889801007476
- O. Omotoso, D. K. McCarty, R. Kleeberg and S. Hillier, “Some Successful Approaches to Quantitative Mineral Analysis as Revealed by the 3rd Reynolds Cup Contest,” Clays and Clay Minerals, Vol. 54, No. 6, 2006, pp. 748- 760. doi:10.1346/CCMN.2006.0540609