Advances in Materials Physics and Chemistry
Vol. 2 No. 1 (2012) , Article ID: 17899 , 7 pages DOI:10.4236/ampc.2012.21007
Third Order Optical Nonlinearities of C450 Doped Polymer Thin Film Investigated by the Z-Scan
1Department of Physics, College of Science, University of Baghdad, Baghdad, Iraq
2Department of Physics, College of Science for Women, University of Baghdad, Baghdad, Iraq
3Ministry of High Education & Scientific Research, Foundation of Technical Education, Institute of Medical Technology, Mansour, Iraq
Email: zainab_ss2004@yahoo.com
Received October 18, 2011; revised December 9, 2011; accepted January 22, 2012
Keywords: Nonlinear Optics; Solvent Effect; Z-Scan Technique
ABSTRACT
In the present work, z-scan technique was used to study the nonlinear properties, represented by nonlinear refractive index and nonlinear absorption coefficient for Coumarin 450 (C450) doped PMMA as a function of concentration for two different solvents. The results show change of the effect from self-focusing to self-defocusing in closed aperture zscan (or change of the effect from two photon absorption to saturable absorption in open aperture z-scan), when the sample dissolved in low viscosity and more polar solvent
1. Introduction
There is considerable interest in understanding the optical nonlinearities of dyes for widespread applications. Dye molecules are used mostly to generate tunable laser sources and optical shutters, optical signal-processing devices [1-4], two-photon microscopy [5], up conversion lasers [6,7], optical limiting [8,9], optical data storage [10,11] and three-dimensional microfabrication [12]. The basic absorption processes in dyes could be divided into 1) linear absorption; 2) saturation of absorption (SA) and 3) reverse saturable absorption (RSA). Saturation of absorption is vital for use of the dyes in mode-locking. The most important application of RSA is for optical limiting devices [13,14] that protect sensitive optical components, including human eye, from laser-induced damage.
In the present work we studied the nonlinear properties of PMMA thin films doped Coumarin 450 (C450) dye used as an active media of solid state dye laser with two kinds of excitation, CW diode laser at 650 nm and pulsed Nd:YAG at 532 nm.
2. Experimental Materials
All materials used without further purification. Coumarin 450 (C450) supplied from Lambda Physik and used without further purification, Polymethacrylate (PMMA) from ICI company. The solvents used were Tetrahydrofloran (THF) from (BDH Chemicals Ltd. Poole England, Chloroform: From Lab-Scan Ltd. Analitical Sciences HPLC, Dublin Ireland and Methanol from Riedel_dehaen.
All solvents are spectroscopic grade. The choose of the solvents was based on the requirement of solubility of polymers.
2.1. Samples Preparation
Solution of concentrations (10–5, 10–4 and 10–3) M/L with different solvents where prepared by weighting amount of the material by using a matter balance having a sensitivity of 10–4 gm. To enhance the solubility of the dye in each solvent, the dye firstly dissolved in Methanol with ratio (20%) for each solvent.
Dye doped polymer films were fabricated by the free casting technique (FC), the solution of the polymer was prepared by dissolving the required amount of polymer (7 gm in 100 ml of the used solvent).
The free casting (FC), involves casting a polymer solution on to a flat bottomed glass cup (Petri dish) without imposing hydrodynamic stress on the liquid .The dishes were arranged on a glass plate in order that the dishes have a plan situation, then the dishes were covered with a heavy paper box to be protected from from li light. Solvent is allowed to evaporate under ambient conditions (30˚C) until the films harden. The harden films were then removed from the Petri dish by washing them off with distilled water and placed in the oven (50˚C) for 10 minutes to dry. The thickness of the films produced by this method is dependent on straight forward way of concentration and the volume of the liquid in the dish. In this study the liquid volumes are ranged from (6 - 14) ml, yielding film thickness of (90 - 210) µm. The thickness of the films was measured with an electrical device (Mini-test 3000 microprocessor coating thickness) from electro, Phyisk, Germany (ERICHSEN).
2.2. Z-Scan System
The experimental setup of closed and open aperture zscan is shown in Figure 1. The laser that is used in the present work is a home built cw Diode laser of 650 nm (maximum power 50 mw, beam diameter 1.5 mm and beam divergence 1.5 mrad).
3. Results & Discussion
3.1. Closed Aperture Z-Scan Using CW Diode Laser
Closed aperture z-scan was used to investigate the nonlinear refractive index, where a circular aperture with transmissivity S < 1 is placed behind the sample in the far field to control the cross section of the beam coming out of the sample. As the sample is scanned through the beam, the far field profile shows intensity variation across the beam profile, which is recorded through the aperture and the transmission is recorded as a function of z position. Figures 2 and 3 show the closed aperture z-scan trace for the dye C450 in PMMA doped films in Chloroform and THF.
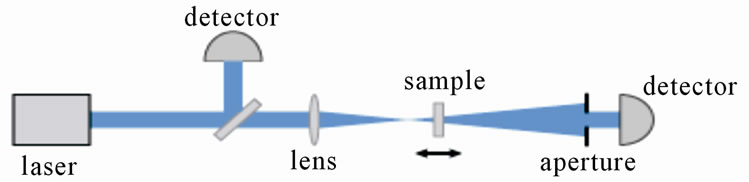
Figure 1. The setup of z-scan system.
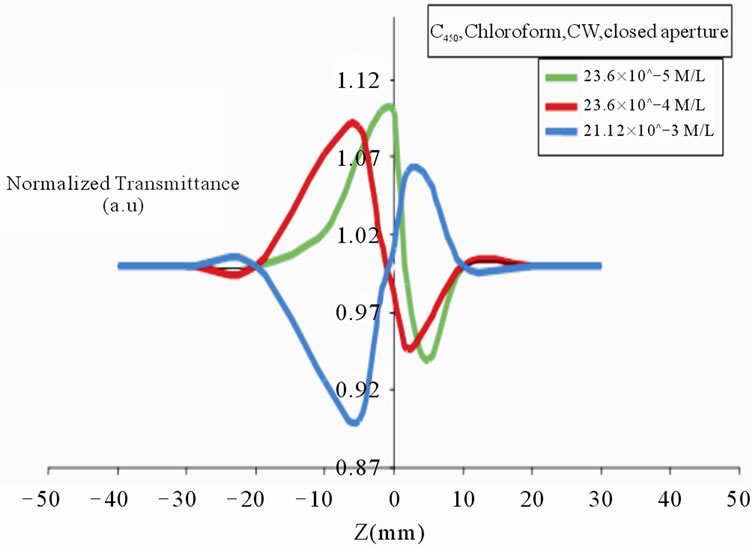
Figure 2. Closed aperture z-scan with CW laser for C450 in PMMA doped films in chloroform.
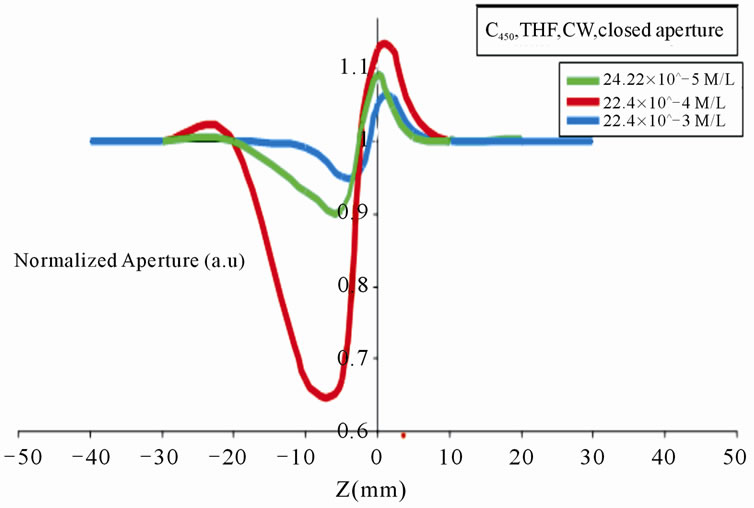
Figure 3. Closed aperture z-scan with CW laser for C450 in PMMA doped films in THF.
Figure 2 indicates negative refractive index for films of concentrations (23.6 × 10⁻⁵, 23.5 × 10⁻⁴) M/L and positive refractive index for film of concentration (21.12 × 10⁻³) M/L.
Figure 3 indicates positive refractive index for the three concentrations.
It is clear from the figures above that the z-scan trace varies for each films as the dye concentration is changed and this is because the difference of dye concentration in each film this causes variation in films thickness which causes a variation in the nonlinear phase shift which in turn changes the value of the nonlinear refractive index and the third order electric susceptibility. It is seen that, under the condition of small phase shift, z-scan curves are approximately symmetric, where the increase and decrease of normalized intensity at the aperture are basically the same. z-scan curves broaden and their peak-tovalley separation increases as the nonlinear phase shift increases so that the z-scan curves becomes gradually asymmetric. This can be easily explained by the beam intensity distribution on the aperture plane.
Figure 3 and for film of C450 with concentration (22.4 × 10⁻⁴) M/L in THF shows that the valley has amplitude which is much larger than its peak and this is because of the large phase shift in the laser beam. In the case of a large nonlinear phase shift, at the transmittance peak of the z-scan curves, the normalized intensity at the aperture changes rapidly and then arrives at zero. In contrast, the change of normalized intensity is slow at the transmittance valley of the z-scan curves. Accordingly, the change of the peak of z-scan is quicker than the valley due to the difference of the radial distribution of normalized intensity on the aperture plane, so it is seen that, the shape of the z-scan curves becomes gradually asymmetric and broaden. Moreover, the peak almost disappears while the valley still exists. Our results are in good agreement with the results of S.-Qi Chen et al. [15].
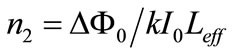
In a closed-aperture z-scan the nonlinear refractive index n2 can be calculated from the following formula [15]:
 (1)
(1)
where
ΔΦ0: nonlinear phase shift;
λ is the wavelength of the beam.
Leff: the effective length of the sample which can be determined from the following formula [16]
 (2)
(2)
where L: the sample length;
α0: linear absorption coefficient.
In Equation (1), I0 is the intensity at the focal spot given by [17]
 (3)
(3)
where
ω0: the beam radius at the focal spot;
Ppeak: the peak power given by [17]
 (4)
(4)
where E: the energy of the pulsed laser;
Δt: the time duration.
The closed-aperture z-scan defines variable transmittance values, which used to determine the nonlinear phase shift ΔΦ0 and the nonlinear refractive index n2 using the above equations. This can be shown in Table 1, which represent the ΔΦ0, n2 and other linear and nonlinear parameters of the C450 doped with PMMA films in the two solvents with CW diode laser at 650 nm.
Figure 4 below represent the variation of the nonlinear refractive index with the nonlinear phase shift of C450 doped films in the two solvents.
It is clear from Figure 4 that the relation between the nonlinear phase shift and the nonlinear refractive index is linearly increasing relation. As the dye concentration is increased, the film’s thickness of the doped films is increased and it causes the increase the laser beam phase shift.
Films of C450 doped with THF shift laser beam are more than doped films in chloroform .This indicates: the different of the nonlinear response of each film causing a different third order nonlinear susceptibility and different nonlinear refractive index.
3.2. Closed Aperture Z-Scan with Pulsed Nd:YAG Laser
Closed aperture z-scan with pulsed Nd:YAG laser at 532 nm (second harmonic output of the Nd:YAG laser) with
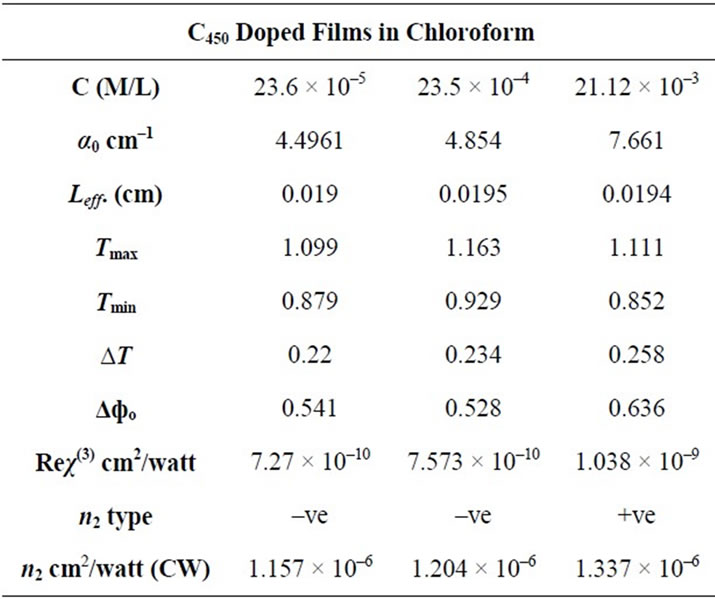
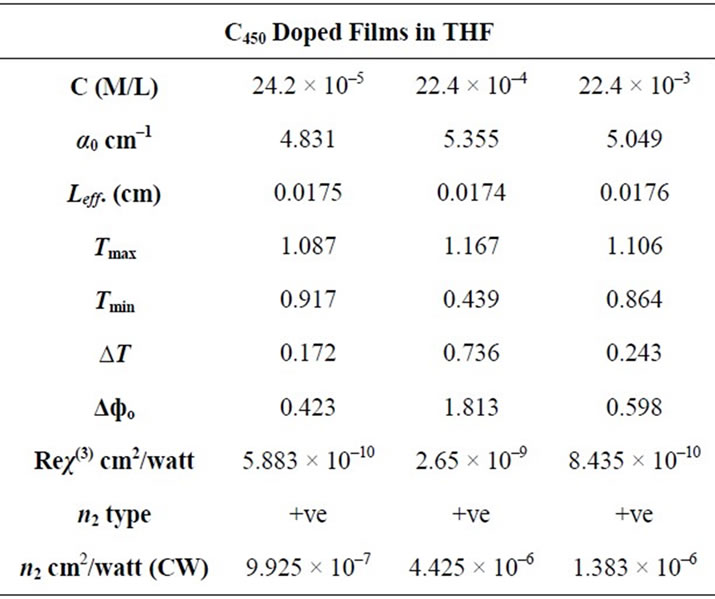
Table 1. The linear and nonlinear parameters of the C450 doped with PMMA films in the solvents chloroform and THF by using closed aperture z-scan with CW diode laser at 650 nm.
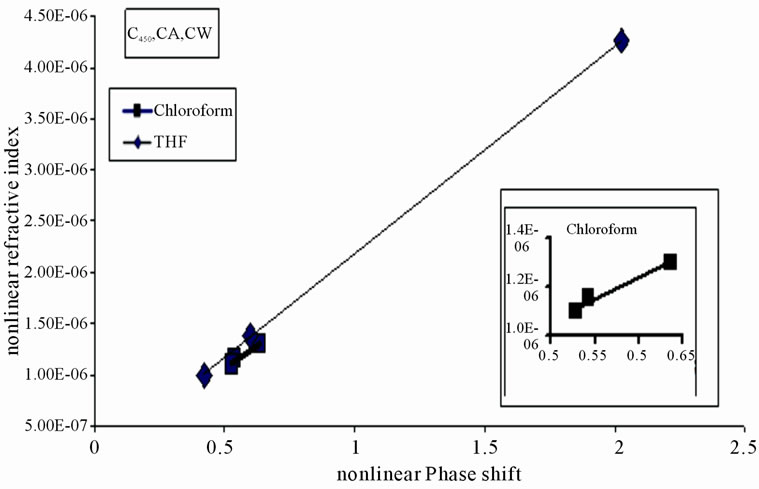
Figure 4. Variation of the nonlinear refractive index as a function of the phase shift of the laser beam for the dye C450 in PMMA doped films in the solvents chloroform and THF by using diode laser at 650 nm. The inset figures represent the variation of the nonlinear refractive index with nonlinear phase shift for the film of C450 in chloroform alone.
nanosecond laser pulses were used to investigate the nonlinear refractive index of the dye C450 in PMMA doped films in chloroform only. The following Figures 5 and 6 show the closed aperture z-scan results:
Figure 5 shows z-scan for C450 in chloroform.
Figure 5 shows that the behavior of C450 doped films in chloroform of concentrations (23.6 × 10⁻⁵, 21.12 × 10⁻³) M/L, have negative refractive index while film of concentration (23.5 × 10⁻⁴) M/L has positive refractive index. We noticed also that the peak of films with concentrations (23.6 × 10⁻⁵, 23.5 × 10⁻⁴) M/L was enhanced and the valley was suppressed and this is because of large nonlinear phase shift in these films.
Figure 6 shows the variation of the nonlinear refracttive index with the nonlinear phase shift of the dye C450 doped films in chloroform.
The first observation forms all the results of closed aperture z-scan by using CW and pulsed laser is that: the behavior of nonlinear refractive index n2 changes between negative and positive behavior as the magnitude of laser beam nonlinear phase shift is changed. Nonlinear phase shift was changed with films thickness, the intensity at the focus and film’s linear absorption coeffi-
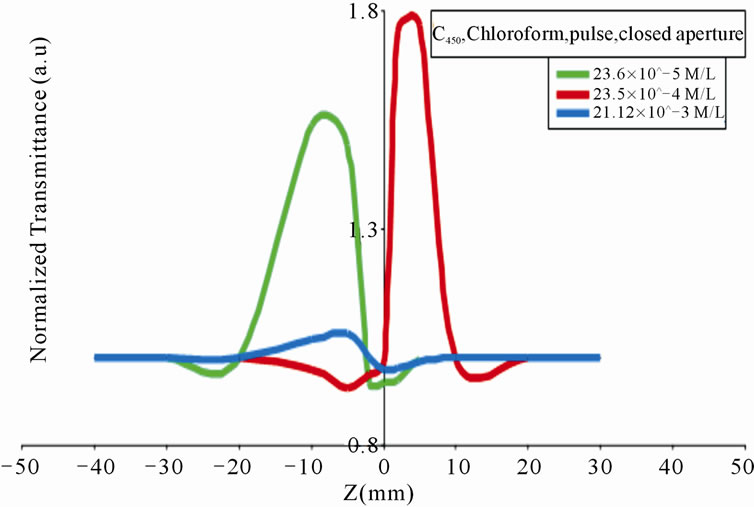
Figure 5. Closed aperture z-scan with pulsed Nd:YAG laser for C450 in PMMA doped films in chloroform.
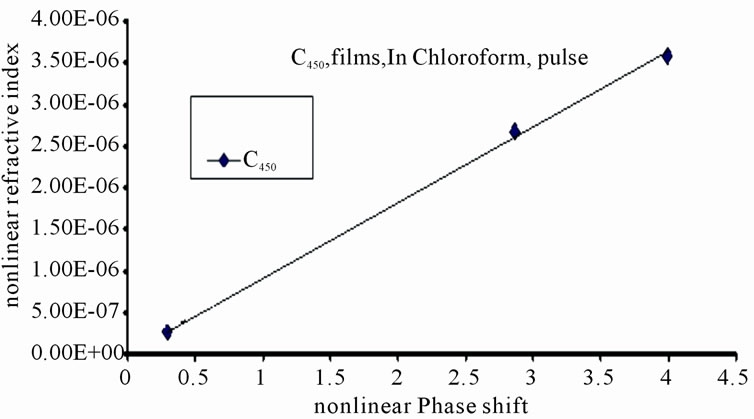
Figure 6. Variation of the nonlinear refractive index as a function of the phase shift of the laser beam for the dye C450 in PMMA doped films in chloroform, by using Nd:YAG pulsed laser.
cient. Since the dyes concentration in each film limits the value of the linear absorption coefficients α0, so α0 is another factor which limits the value of n2, (Table 2). All these factors limit the amount of beam’s energy which is transferred to each sample through the linear absorption. These indicate that the general shape of curve as well as the nonlinear refractive index sign is medium dependant. F. F. Alonso and coworkers consider the measured nonlinear refractive index as being only parametric in nature i.e., “off-resonance”, that is not involving a net change of population from the ground state to other excited states and the refractive index is positive for frequencies below resonance and negative at frequencies above it [18].
The difference between the experimental results of CW and pulsed-laser indicates that the third order nonlinearities in the two cases have different origins. With CW pumping major the contribution for the observed third-order nonlinearities is to be thermal in nature. The energy from the focused laser beam is transferred to sample through linear absorption and is manifested in terms of heating the medium leading to a temperature gradient and there by the refractive index changes across the sample which then acts as a lens (Kerr effect). The phase of propagating beam will be distorted due to the presence of this thermal lens. Since low intensity of the CW diode laser rules out purely electronic contributions (253.97 watt/cm2) compared with the intensity of pulsed laser (285.68 × 10⁸ watt/cm2), the thermal effect for CW laser should be considered, while the electronic polarization contributes to the change of the index of refraction in pulsed laser excitation so it was mainly electronic in origin.
We observed from the above tables also that the values of n2 as a function of the dye films thickness and concentration are changed with the kind of used solvents where
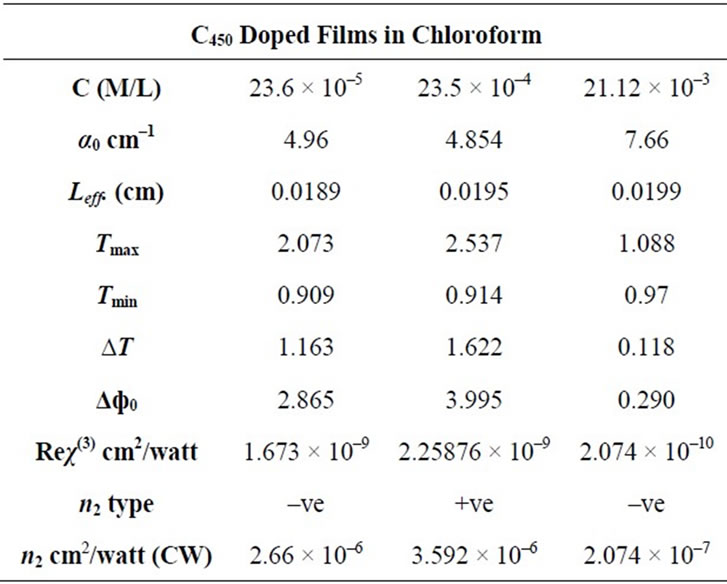
Table 2. The linear and nonlinear parameters of the dye C450 in PMMA doped films in the solvent chloroform by using ND:YAG laser.
the two solvents which we used are different in their dielectric constant, refractive index, vapor pressure and viscosity. The choice of solvent has a major influence on the film thickness: For solvents with low vapor pressure (i.e. the surrounding air will take up only a small amount of solvent before being saturated), the evaporation process will take longer than for solvents with a high vapor pressure, such process effects the films’ thickness [19].
The kind of used solvent effects also the polymer chains where polymer chains dissolved in “good” solvents tend to have an open conformation, allowing easy access for chromophores to come into interchain contact. Polymer chains in “poor” solvents, on the other hand, tend to form tight coils, and make it difficult for chromophores to become physically adjacent even through the chains that tend to clump together [18,20,21]. For these reasons we notice a large difference in the nonlinear behavior of the films by changing the solvents.
3.3. Open Aperture Z-Scan with CW Diode Laser
Open aperture z-scan was used to investigate the nonlinear absorption coefficient by removing the aperture. This case corresponds to collecting all the transmitted light and therefore it is insensitive to any nonlinear beam distortion due to nonlinear refraction [22].
The coefficients of nonlinear absorption can be easily calculated from such transmittance curves [13]. The total transmittance is given by [16]:
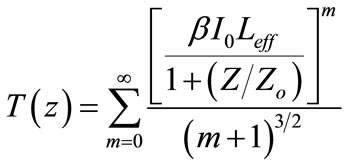 (5)
(5)
where, Z: is the sample position at the minimum transmittance;
Zo: the diffraction length;
m: integer;
T(z): the minimum transmittance.
The two terms in the summation are generally sufficient to determine the nonlinear absorption coefficient β.
Figures 7 and 8 show the open aperture z-scan results for C450 doped films in the two solvents:
Figure 7 indicates that the behavior of C450 in PMMA doped films in chloroform: films of concentrations (23.6 × 10⁻⁵) and (21.12 × 10⁻³) M/L have saturation behavior while film of concentration (23.5 × 10⁻⁴) M/L has TPA behavior.
Figure 8 indicates that the behavior of C450 in PMMA doped films in THF: film concentrations (24.2 × 10⁻⁵) and (22.4 × 10⁻⁴) M/L have saturation behavior while (22.4 × 10⁻³) M/L has TPA behavior.
The open-aperture z-scan defines variable transmittance values, which used to determine β at CW Diode laser. This can be reported in Table 3.
3.4. Open Aperture Z-Scan with Nd:YAG Pulsed Laser
Figures 9 and 10 show the open aperture results of C450 doped films in PMMA, chloroform and THF.
Figure 9 indicates that the (TPA) behavior for the
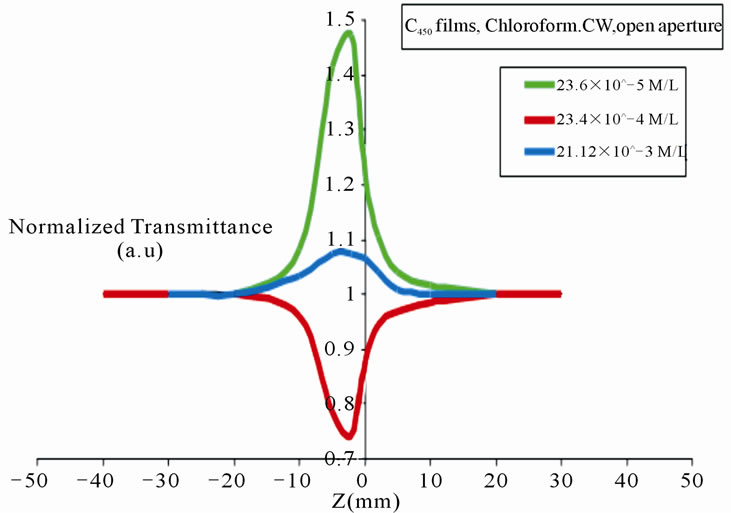
Figure 7. Open aperture z-scan for C450 doped in PMMA films in chloroform using CW diode laser.
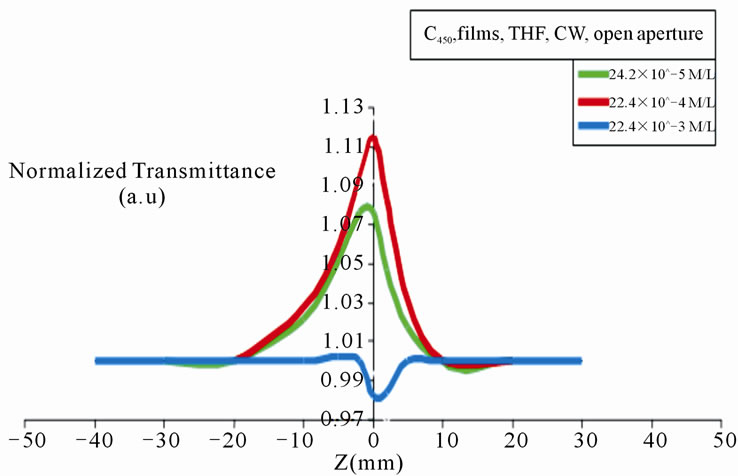
Figure 8. Open aperture z-scan for C450 in PMMA doped flms in THF using CW diode laser.
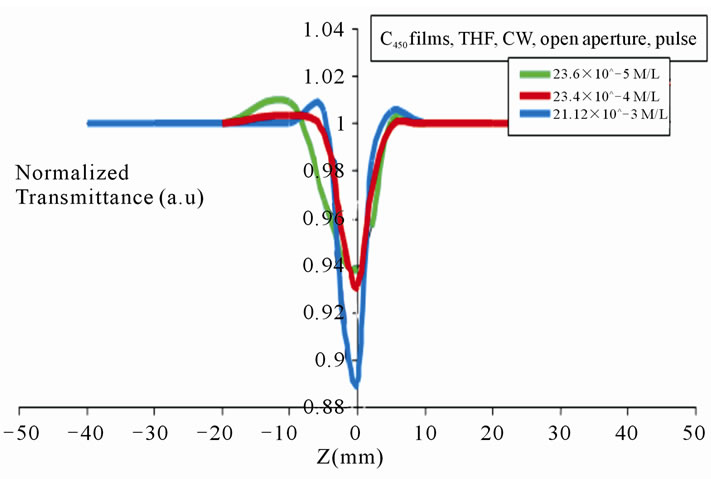
Figure 9. Open aperture z-scan for C450 doped with PMMA films in chloroform using Nd:YAG laser.
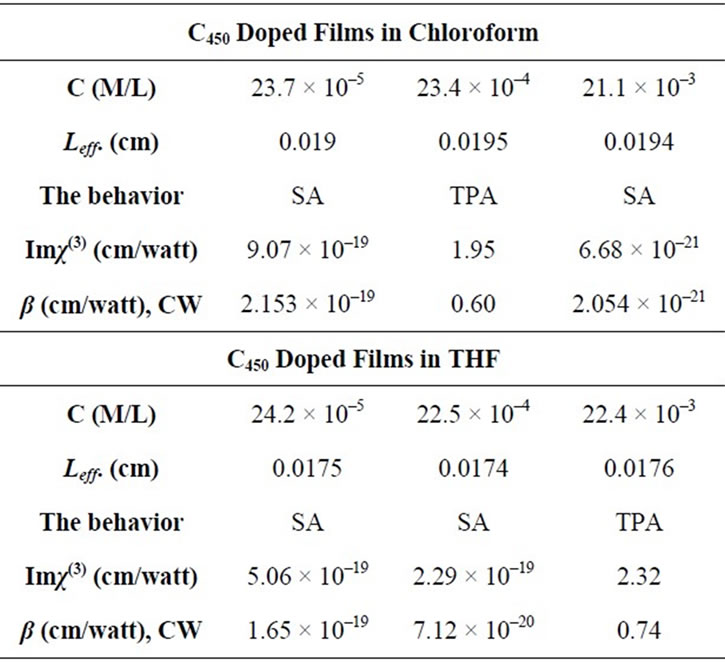
Table 3. Calculated of the nonlinear parameters of C450 doped films in the solvents chloroform and THF, by using open aperture z-scan with CW Diode laser.
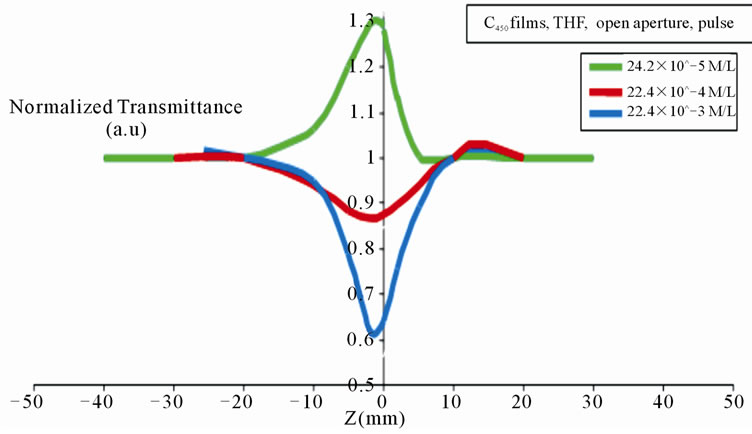
Figure 10. Open aperture z-scan for C450 doped with PMMA films in THF using Nd:YAG laser.
three concentrations.
Figure 10 indicates that the behavior of C450 in PMMA doped films in THF: film with concentration (24.22 × 10⁻⁵) M/L has SA behavior while films with concentrations (22.5 × 10⁻⁴ and 22.4 × 10⁻³) M/L have (TPA) behaviors.
In open-aperture, z-scan with Nd:YAG laser defines variable transmittance value. Table 4 can be used to determine β.
We notice from the results above that: for open aperture z-scan, the nonlinear absorption behavior switched over between saturable absorption (SA) and reversed saturable absorption (TPA) for all the concentrations and the behavior is TPA for the films of concentration 10–3 M/L (high concentration) by using CW and pulsed laser.
TPA occrued when the excited state cross section is greater than the ground state cross section where enhancement of TPA is attributed to intermediate state resonance that makes the cross section of the excited
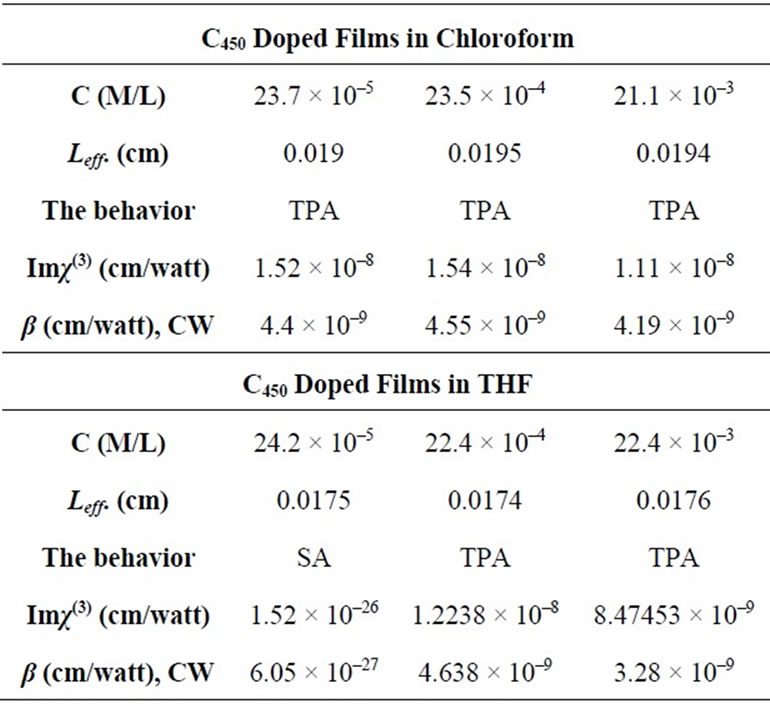
Table 4. Calculated nonlinear parameters of C450 doped films in chloroform and THF, by using open aperture z-scan with Nd:YAG laser.
state greater than that of the ground state. Hence the intensity at the focus is increased and exhibited significant transmittance drop .While the behavior of the saturation absorption is due to the accumulation of molecules in the singlet excited state leading to depletion of the ground state, so the intensity at the focus is reduced and exhibited high transmittance. The reason for this behavior is the occurrence of a photon-assisted off-resonance energy transfer and that was demonstrated by L. C. Olivier and S. C. Zhilio [23].
β in case of TPA was calculated from Equation (5). It is clear from this equation that the factors which limit the nonlinear absorption coefficient are the samples Leff., transmittance at Z = 0 and I0 the peak intensity at the focus. For this we notice that the β’s values and the imaginary part of the nonlinear susceptibility values measured by using Nd:YAG laser is too much lower than that measured by CW laser and that is because the intensity of the Nd:YAG laser (258.6 × 10⁸ watt/cm2) is too much greater compared with the CW laser intensity (253.97 watt/cm2). In case of SA, β was calculated from equation below
 (6)
(6)
where
σο: is the ground state cross section;
Is: is the saturation intensity.
It is clear from the above results that the values of β and the imaginary part of the nonlinear susceptibility (Imχ(3)) for the dyes C450 in the two cases: TPA and SA are changed with the kind of used solvents.
Naga Srinivas and workers [24] attributed the switch over from SA to RSA behavior with increasing the dye concentration to localization of energy which leads to resonant TPA, and the change over from REA to SA is attributed to the aggregation and fast decay times in molecules which get populated through energy transfer.
4. Conclusion
The values of nonlinear refractive index coefficient for C450 doped PMMA thin films change with the kind of laser used for excitation, and that is because the different of the origin of the third-order nonlinearity caused by each kinds of laser
REFERENCES
- F. P. Schafer, “Dye Lasers,” Springer-Verlag, Berlin, 1973.
- R. L. Sutherland, “Handbook of Nonlinear Optics,” Marcel Dekker, New York, 1996.
- H. S. Nalwa and S. Miyata, “Nonlinear Optics of Organic Molecules and Polymers,” CRC Press, Boca Raton, 1997.
- F. P. Schafer, “Organic Dyes in Laser Technology,” Angewandte Chemie International Edition in English, Vol. 9, No. 1, 1970, pp. 9-25. doi:10.1002/anie.197000091
- W. Denk, J. H. Strickler and W. W. Webb, “Two-Photon Laser Scanning Fluorescence Microscopy,” Science, Vol. 24, No. 4951, 1990, pp. 73-76. doi:10.1126/science.2321027
- M. Anandi, “Two-Photon Pumped Unconverted Lasing in Dye Doped Polymer Waveguides,” Applied Physics Letters, Vol. 62, No. 26, 1993, pp. 3423-3425. doi:10.1063/1.109036
- G. S. He, C. F. Zhao, J. D. Bhawalkar and P. N. Prasad, “Two-Photon Pumped Cavity Lasing in Novel Dye Doped Bulk Matrix Rods,’’ Applied Physics Letters, Vol. 67, No. 3703, 1995, pp. 3703-3705. doi:10.1063/1.115355
- J. E. Ehrilich, X. L. Wu, I. Y. S. Lee, Z. Y. Hu, H. Rockel, S. R. Marder and J. W. Perry, “Two-Photon Absorption and Broadband Optical Limiting with Bis-Donor Stilbenes,” Optics Letters, Vol. 22, No. 24, 1997, pp. 1843-1845.
- G. S. He, G. Xu, P. N. Prasad, B. A. Reinhardt, J. C. Bhatt and A. G. Dillard, “Two-Photon Absorption of Novel Organic Compounds,” Optics Letters, Vol. 20, No. 5, 1995, pp. 435-437. doi:10.1364/OL.20.000435
- D. A. Parthenopoulos and P. M. Rentzepis, “Three-Dimensional Optical Storage Memory,” Science, Vol. 245, No. 4920, 1989, pp. 843-845. doi:10.1126/science.245.4920.843
- H. Strickler and W. W. Webb, “Three-Dimensional Optical Data Storage in Refractive Media by Two-Photon Excitation,” Optics Letters, Vol. 16, No. 22, 1991, pp. 1780- 1782. doi:10.1364/OL.16.001780
- B. H. Cumpston, S. P. Ananthavel, S. Barlow, D. L. Dyer, J. E. Ehrlich, L. L. Erskine, A. A. Heikal, S. M. Kuebler, I. Y. S. Lee, D. M. Maughon, J. Quin, H. Rockel, M. Rumi and J. W. Perry, “Two-Photon Polymerization Initiators for Three-Dimensionaloptical Data Storage and Microfabrication,” Science, Vol. 398, No. 4, 1999, pp. 51-54.
- L. W. Tutt and T. F. Boggess, “A Review of Optical Limiting Mechanisms and Devices Using Organics, Fullerenes, Semiconductors and Other Materials,” Progress in Quantum Electronics, Vol. 17, No. 4, 1993, pp. 299-338. doi:10.1016/0079-6727(93)90004-S
- S. VenugopalRao, N. K. M. Naga Srinivas and D. Narayana Rao, “Nonlinear Absorption and Excited State Dynamics in Rhodamine B Studied Using Z-Scan and Degenerate Four Wave Mixing Techniques,” Chemical Physics Letters, Vol. 361, No. 5-6, 2002, pp. 439-445. doi:10.1016/S0009-2614(02)00928-4
- S.-Q. Chen, Z.-B. Liu, W.-P. Zang, J.-G. Tian, W.-Y. Zhou, F. Song and C.-P. Zhang, “Study on Z-Scan Characteristics for a Large Nonlinear Phase Shift,” Journal of the Optical Society of American B, Vol. 22, No. 9, 2005, pp. 1911-1916. doi:10.1364/JOSAB.22.001911
- M. Sheik-Bahae, A. A. Said, T. H. Wei, D. J. Hagan and E. W. Van Stryland, “Sensitive Measurement of Optical Nonlinearities Using a Single Beam,” IEEE Journal of Quantum Electronics, Vol. 26, No. 4, 1990, pp. 760-769. doi:10.1109/3.53394
- J. F. Ready, “Industrial Application of Lasers,” 2nd Edition, Academic Press, San Diego, 1978.
- F. F. Alonso, P. Marovino, A. M. Paoletti, M. Righini and G. Rossi, “Third-Order Optical Non-Linearities in Titanium Bis-Phthalocyanine/Toluene Solutions,” Chemical Physics Letters, Vol. 356, No. 5-6, 2002, pp. 607-613. doi:10.1016/S0009-2614(02)00428-1
- F. Pschenitzka, “Patterning Techniques for Polymer LightEmitting Devices,” Ph.D. Thesis, Princeton University, Princeton, 2002.
- A. Yavrian, T. V. Galstian and M. Piche, “Photoinduced Absorption and Refraction in Azo Dye Doped PMMA Films: The Aging Effect,” Optical Materials, Vol. 26, No. 3, 2004, pp. 261-265.
- T. Q. Nguyena, R. Y. Yee and B. J. Schwartz, “Solution Processing of Conjugated Polymers: The Effects of Polymer Solubility on the Morphologyand Electronic Properties of Semiconducting Polymer Films,” Journal of Photochemistry and Photobiology A: Chemistry, Vol. 144, No. 1, 2001, pp. 21-30. doi:10.1016/S1010-6030(01)00377-X
- M. Sheik-Bahae and M. P. Hassaibeak, “Handbook of Optics IV,” McGraw-Hill, Boston, 2000.
- L. C. Oliveira and S. C. Zilio, “Chromium-Doped Saturable Absorbers Investigated by the Z-Scan,” Brazilian Journal of Physics, Vol. 24, No. 2, 1994, pp. 498-501.
- N. K. M. Naga Srinivas, S. Venugopal Rao and D. Narayana Rao, “Saturable and Reverse Saturable Absorption of Rhodamine B in Methanol and Water,” Journal of Optical Society American B, Vol. 20, No. 12, 2003, pp. 2470- 2479. doi:10.1364/JOSAB.20.002470