Open Journal of Animal Sciences
Vol. 2 No. 4 (2012) , Article ID: 23969 , 5 pages DOI:10.4236/ojas.2012.24035
Changes in protein tyrosine phosphatase activity in Spontaneously Diabetic Torii (SDT) rats
![]()
1Biological/Pharmacological Research Laboratories, Central Pharmaceutical Research Institute, Japan Tobacco Inc., Osaka, Japan; *Corresponding Author: takeshi.ota@jt.com
2Laboratory of Animal Reproduction, Graduate School of Agricultural Science, Tohoku University, Sendai, Japan
Received 8 August 2012; revised 13 September 2012; accepted 24 September 2012
Keywords: Fat; PTPase; SDT Rat
ABSTRACT
The Spontaneously Diabetic Torii (SDT) rat is a nonobese type 2 diabetic model, showing the overt hyperglycemia after about 16 weeks of age. In this study, we investigated the protein tyrosine phosphatase (PTPase) activities in insulin-sensitive tissues in SDT rats. PTPase activities in the liver, muscle, and fat were examined at 8 weeks (pre-diabetes), 16 weeks (onset-diabetes), and 24 weeks (diabetes). SDT rats showed glucose intolerance at 8 weeks and hyperglycemia after 16 weeks. The PTPase activities in fat increased at 8 weeks and the increase was sustained to 24 weeks. In the liver, PTPase activities increased only at 24 weeks. On the other hand, the PTPase activities in muscle did not change. The increase of PTPase activity in fat might be related to progression of glucose intolerance and diabetes in SDT rats.
1. INTRODUCTION
The hyperglycemia is attributed to two major defects, namely insulin resistance in insulin-sensitive tissues and depletion of glucose-stimulated insulin secretion (GSIS) from the pancreas. As a result of these abnormalities, patients with type 2 diabetes develop elevated fasting blood glucose levels and excessive glucose fluctuations after meals [1,2]. The molecular mechanism underlying insulin resistance is considered to be complex, but some evidence points to a defect in the insulin-signaling pathway [3-5]. The activation of insulin receptor (IR) tyrosine kinase following insulin binding, and the subsequent tyrosyl phosphorylation of intracellular proteins in the insulin signaling cascade, are essential for insulin action. In a steady state, the intracellular phosphotyrosyl phosphorylation levels proteins in signal chains will reflect the balance of activities of phosphotyrosine kinases and phosphotyrosine phosphatases (PTPase). It has been speculated that a specific PTPase is involved in the dephosphorylation and inactivation of IR, thus attenuating insulin signaling, and disequilibrium between IR and the PTPase could be a contributing factor to the insulin resistance observed in type 2 diabetes mellitus [6-8].
The Spontaneously Diabetic Torii (SDT) rat is a model for nonobese spontaneous diabetes, developed by Torii Pharmaceutical Co., Ltd. (Tokyo, Japan) [9,10]. Male SDT rats develop diabetes mellitus from about 20 weeks of age and diabetic complications, such as ocular lesions and nephropathy, from about 40 weeks of age [11,12]. Moreover, SDT rats show glucose intolerance before the onset of diabetes. The IGT was investigated at 12 and 16 weeks of age [13-15]. SDT rats show remarkable hyperglycemia after the onset of diabetes mellitus.
In this study we investigated the PTPase activities in liver, muscle, and fat in SDT rats at 8 (pre-diabetes), 16 (onset-diabetes), and 24 (diabetes) weeks of age.
2. MATERIALS AND METHODS
2.1. Animals
Male SDT rats and Sprague-Dawley (SD) rats (Clea Japan, Tokyo, Japan) were used for the study. SD rat was used as a control. Rats were housed in suspended bracket cages and given a standard laboratory diet (CRF-1, Oriental Yeast Co., Ltd., Tokyo, Japan) and water ad libitum in a room with controlled temperature, humidity, and lightning. All procedures were conducted according to the Japan Tobacco Animal Care Committee’s guidelines.
2.2. Biophysiological Parameters
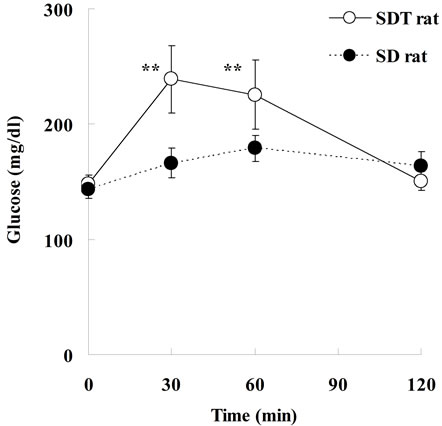
Body weight and blood chemical parameters, such as glucose, insulin, triglyceride (TG), and total cholesterol (TC) levels, were examined at 8, 16, and 24 weeks of age (n = 6). Blood samples were collected from the tail vein of non-fasted rats. Serum glucose, TG, and TC levels were measured using commercial kits (Roche Diagnostics, Basel, Switzerland) and an automatic analyzer (Hitachi, Tokyo, Japan). Serum insulin level was measured with a rat-insulin enzyme-linked immunosorbent assay (ELISA) kit (Morinaga Institute of Biological Science, Yokohama, Japan). Oral glucose tolerance test (OGTT) was performed at 8 weeks of age (n = 6). Glucose solution (2 g/kg) was administered to 4 h-fasted rats. Blood samples were collected before, and 30, 60, and 120 min after glucose loading. Serum glucose and insulin levels were measured as described earlier.
2.3. Preparation of Tissue Extract
Six animals at each age were sacrificed, and the livers, soleus muscles, and epididymal fat were harvested immediately. After weighing of harvested tissues, they were immediately frozen in liquid nitrogen. Three times the tissue weight of homogenizing buffer (20 mmol/l Tris, 130 mmol/l NaCl, 5 mmol/l EDTA, protease inhibitor cocktail) was added and the mixture was homogenized in a Polytron homogenizer (Ultra-Turrax T8, Ika Labortechnik). The homogenate obtained was left for one hour on ice and then separated by centrifugation at 10,000 × g and 4˚C for 30 min and the supernatant obtained was used as the tissue sample.
2.4. Tissue PTPase Activity
PTPase activity was estimated according to the method of Pellegrini et al. [16] with slight modifications. In brief, PTPase activity was measured using a Malachite Green color reagent to detect release of inorganic phosphate from p-Nitrophenyl Phosphate (pNPP). The Malachite Green reagent was prepared as a 3:1 mixture of 0.045% malachite green and 4.2% ammonium molybdate supplemented with 0.01% TritonX-100. Reaction mixtures (100 µl) containing the tissue extract and pNPP in buffer (50 mM Tris, pH 7.5, 50 mM NaCl, and 3 mM DTT) were incubated for 15 min at 37˚C with gentle shaking and then quenched with 200 µl Malachite Green reagent. After 60 min at room temperature with gentle shaking, the absorbance at 405 nm (OD) was measured using a VERSAmax microplate reader (Molecular Devices).
2.5. Statistical Analysis
Results are expressed as the mean ± standard deviation. Statistical analysis was performed using StatLight 1998(c) (Yukms Corp.). Comparisons between two groups were made as follows: when equality of variances was indicated by an F test, statistical analysis was performed using a Student’s t-test; when equality of variances was not indicated by an F test, statistical analysis was performed using Aspin-Welch’s t-test. Differences were defined as significant at P < 0.05.
3. RESULTS AND DISCUSSION
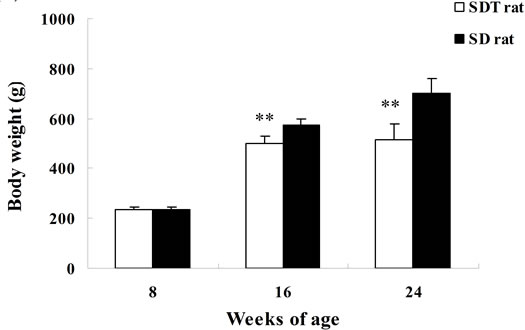
Biological parameters in SDT rats are shown in Figure 1. Body weight in SDT rats at 8 weeks of age was comparable with those in SD rats, but the body weight in SDT rats decreased at 16 and 24 weeks of age. The decrease of body weight is considered to be caused by the progression of diabetes mellitus in SDT rats. The blood glucose level in SDT rats at 8 weeks of age was comparable with that in SD rats, but the two types of rat showed increases of blood glucose levels at 16 weeks of age. In SDT rats at 24 weeks of age, the overt hyperglycemia was observed (Figure 1). The onset of diabetes mellitus in SDT rats was about 16 weeks of age in this experiment. At 8 weeks of age, the basal blood glucose level in SDT rats did not show an increase, but the SDT rats showed glucose intolerance (Figure 2). Although insulin levels after glucose-loading in SDT rats did not change as compared with those in SD rats, the glucose levels after glucose-loading significantly increased. Since the GSIS in SDT rats was not deteriorated, the glucose intolerance was considered to be caused by a decrease of insulin sensitivity.
PTPase activities in insulin-target organs were examined as an index of insulin sensitivity. PTPase activities in fat in SDT rats significantly increased at 8 and 24 weeks of age as compared with those in SD rats, and the PTPase activity at 16 weeks of age tended to increase (Table 1). The rate of increase at each age was 17%, 23%, and 22%, respectively. In the liver, PTPase activity increased only at 24 weeks of age in SDT rats. On the other hand, PTPase activities in muscle in SDT rats did not change as compared with those in SD rats. In SDT rats, PTPase activities in fat increased at pre-diabetic stage.
It is reported that PTPase may be involved in the pathogenesis of insulin resistance. PTPases are considered to play an integral role in the regulation of insulin signal transduction [17]. Insulin resistance in adipose tissue in human obesity was associated with increased PTPase activity, and the improvement of insulin sensitivity following weight loss was accompanied by reduced PTPases in adipose tissues [18]. In skeletal muscle, PTPase activities in subcellular fractions from the obese subjects were increased to 140% - 170% of the level in lean controls [19]. Insulin infusion produced a rapid suppression of PTPase activity in muscle of insulin-sensitive subjects, but this response was severely impaired in subjects who were insulin resistant [20]. In ob/ob mice, an obese diabetic model, hepatic PTPase activities were elevated as compared with lean controls [21]. These abnormal characteristics of PTPase activities
 (a)
(a)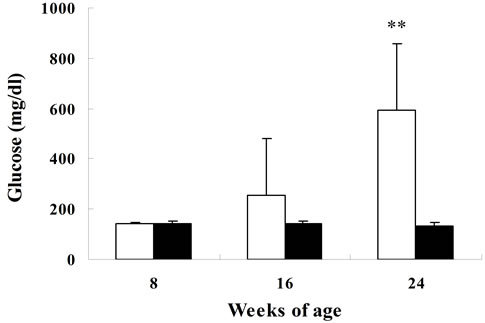 (b)
(b)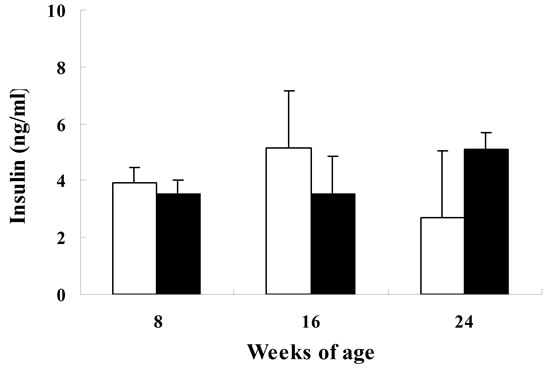 (c)
(c)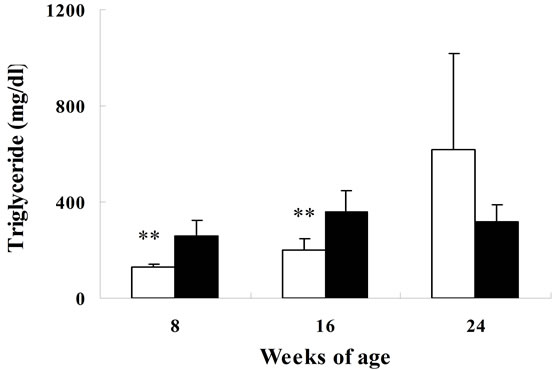 (d)
(d)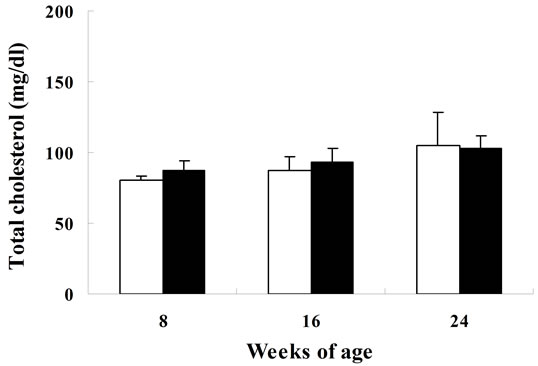 (e)
(e)
Figure 1. Body weights (a); serum glucose (b); insulin (c); triglyceride (d); and total cholesterol (e) levels in SDT and SD rats. Data represent means ± standard deviation (n = 6). **P < 0.01; significantly different from age-matched SD rats.
 (a)
(a)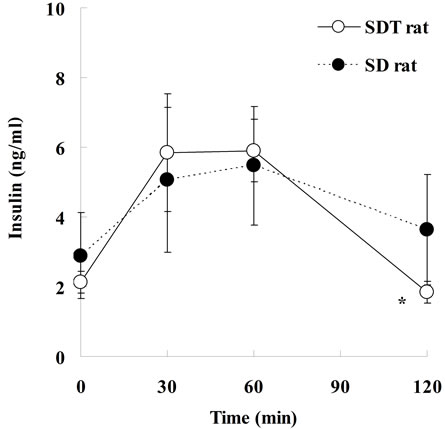 (b)
(b)
Figure 2. Changes of serum glucose and insulin levels after glucose-loading in SDT and SD rats at 8 weeks of age. Blood samples were taken via the tail vein before, and 30, 60, and 120 min after glucose loading. Data represent means ± standard deviation (n = 6). *P < 0.05, **P < 0.01; significantly different from the SD rat.
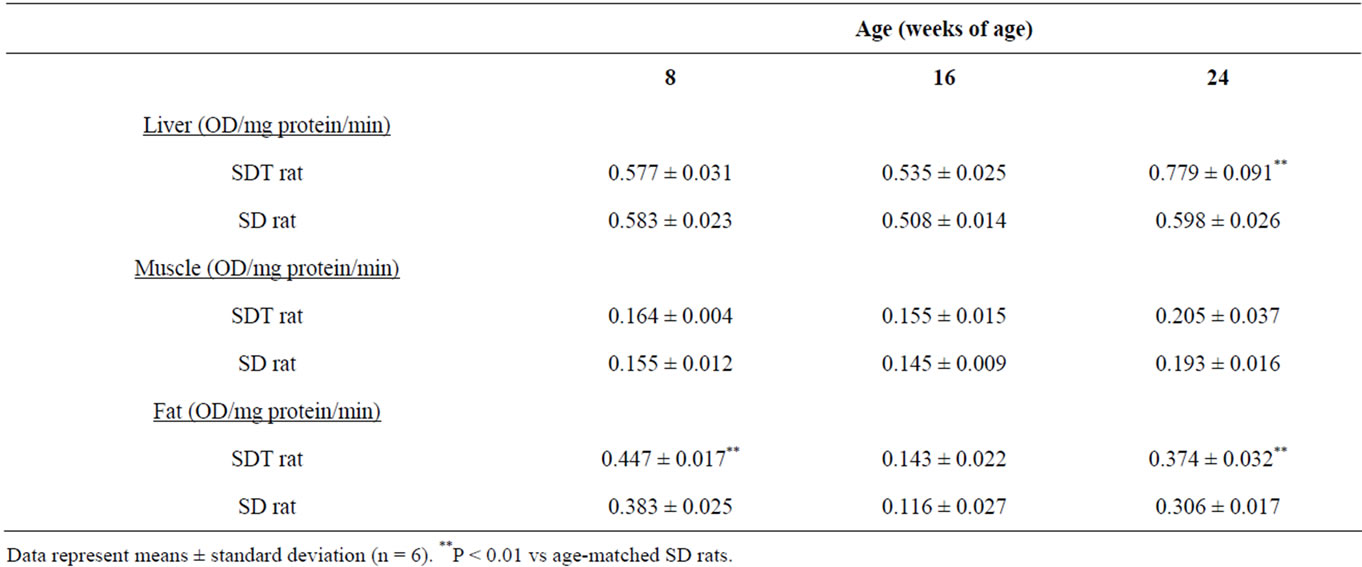
Table 1. PTPase activities in SDT rats and SD rats.
could be central to the cause of insulin resistance and type 2 diabetes.
In this study, in SDT rats, PTPase activity in fat was elevated from pre-diabetic stage. The increase of PTPase activity might be related to progression of glucose intolerance and diabetes in SDT rats.
REFERENCES
- Taylor, S.I., Clore, E.T., Zmachinski, C.J. and BonnerWeir, S. (1994) Insulin resistance or insulin deficiency. Diabetes, 43, 735-740.
- Kelly, D., Mokan, M. and Veneman, T. (1994) Impaired postprandial glucose utilization in non-insulin-dependent diabetes mellitus. Metabolism, 43, 1549-1557. doi:10.1016/0026-0495(94)90015-9
- Saltiel, A.R. and Kahn, C.R. (2001) Insulin signaling and the regulation of glucose and lipid metabolism. Nature, 414, 799-806. doi:10.1038/414799a
- Pessin, J.E. and Saltiel, A.R. (2000) Signaling pathways in insulin action: Molecular targets of insulin resistance. Journal of Clinical Investigation, 106, 165-169. doi:10.1172/JCI10582
- Shulman, G.I. (2000) Cellular mechanisms of insulin resistance. Journal of Clinical Investigation, 106, 171-176. doi:10.1172/JCI10583
- Lau, K.H.W., Farley, J.R. and Baylink, D.J. (1989) Phosphotyrosyl protein phosphatases. Biochemical Journal, 257, 23-36.
- Tonks, N.K. and Neal, B.G. (2001) Combinatorial control of the specificity of protein tyrosine phosphatases. Current Opinion in Cell Biology, 13, 182-195. doi:10.1016/S0955-0674(00)00196-4
- Wu, X., Hardy, V.E., Joseph, J.I., Jabbour, S., Mahadev, K., Zhu, L. and Goldstein, B.J. (2003) Protein-tyrosine phosphatase activity in human adipocytes is strongly correlated with insulin-stimulated glucose uptake and is a target of insulin-induced oxidative inhibition. Metabolism, 52, 705-712. doi:10.1016/S0026-0495(03)00065-9
- Masuyama, T., Komeda, K., Hara, A., Noda, M., Shinohara, M., Oikawa, T., Kanazawa, Y. and Taniguchi, K. (2004) Chronological characterization of diabetes development in male Spontaneously Diabetic Torii rats. Biochemical and Biophysical Research Communications, 314, 870-877. doi:10.1016/j.bbrc.2003.12.180
- Shinohara, M., Masuyama, T., Shoda, T., Takahashi, T., Katsuda, Y., Komeda, K., Kuroki, M., Kakehashi, A. and Kanazawa, Y. (2000) A new spontaneously diabetic nonobese Torii rat strain with severe ocular complications. International Journal of Experimental Diabetes Research, 1, 89-100. doi:10.1155/EDR.2000.89
- Ohta, T., Matsui, K., Miyajima, K., Sasase, T., Masuyama, T., Shoda, T., Koizumi, K., Shinohara, M. and Matsushita, M. (2007) Effect of insulin therapy on renal changes in Spontaneously Diabetic Torii rats. Experimental Animals, 56, 355-362. doi:10.1538/expanim.56.355
- Sasase, T., Ohta, T., Ogawa, N., Miyajima, K., Ito, M., Yamamoto, H., Morinaga, H. and Matsushita, M. (2006) Preventive effects of glycaemic control on ocular complications of Spontaneously Diabetic Torii rats. Diabetes Obesity and Metabolism, 8, 501-507. doi:10.1111/j.1463-1326.2005.00535.x
- Matsui, K., Oda, T., Nishizawa, E., Sano, R., Yamamoto, H., Fukuda, S., Sasase, T., Miyajima, K., Ueda, N., Ishii Y., Ohta, T. and Matsushita, M. (2009) Pancreatic function of Spontaneously Diabetic Torii rats in pre-diabetic stage. Experimental Animals, 58, 363-374. doi:10.1538/expanim.58.363
- Ohta, T., Miyajima, K. and Yamada, T. (2010) Changes in glycolipid metabolism during a high-sucrose feeding in Spontaneously Diabetic Torii (SDT) rats, a genetic model of nonobese type 2 diabetes. Journal of Animal and Veterinary Advances, 9, 2883-2889. doi:10.3923/javaa.2010.2883.2889
- Ohta, T., Miyajima, K. and Yamada, T. (2011) Pathophysiological changes in pre-diabetic stage of Spontaneously Diabetic Torii (SDT) rats. Journal of Animal and Veterinary Advances, 10, 813-817. doi:10.3923/javaa.2011.813.817
- Pellegrini, M.C., Liang, H., Mandiyan, S., Wang, K., Yuryev, A., Vlattas, I., Sytwu, T., Li, Y.-C. and Wennogle, L.P. (1998) Mapping the subsite preferences of protein tyrosine phosphatase PTP-1B using combinatorial chemistry approaches. Biochemistry, 37, 15598-15606. doi:10.1021/bi981427+
- Goldstein, B.J. (1996) Protein-tyrosine phosphatases and the regulation of insulin action. In: LeRoith, D., Olefsky J.M. and Taylor, S.I., Eds, Diabetes Mellitus: A Fundamental and Clinical Text, Lippincott, Philadelphia, 174-186.
- Ahmad, F., Considine, R.V., Bauer, T.L., Ohannesian, J.P., Marco, C.C. and Goldstein, B.J. (1997) Improved sensitivity to insulin in obese subjects following weight loss is accompanied by reduced protein-tyrosine phosphatase in adipose tissue. Metabolism, 46, 1140-1145. doi:10.1016/S0026-0495(97)90206-7
- Ahmad, F., Azevedo, J.L., Cortright, R., Dohm, G.L. and Goldstein, B.J. (1997) Alterations in skeletal muscle protein-tyrosine phosphatase activity and expression in insulin-resistant human obesity and diabetes. Journal of Clinical Investigation, 100, 449-458. doi:10.1172/JCI119552
- McGuire, M.C., Fields, R.M., Nyomba, B.L., Raz, I., Bogardus, C., Tonks, N.K. and Sommercorn, J. (1991) Abnormal regulation of protein tyrosine phosphatase activities in skeletal muscle of insulin-resistant humans. Diabetes, 40, 939-942. doi:10.2337/diabetes.40.7.939
- Sredy, J., Sawicki, D.R., Flam, B.R. and Sullian, D. (1995) Insulin resistance is associated with abnormal dephosphorylation of a synthetic phosphopeptide corresponding to the major autophosphorylation sites of the insulin receptor. Metabolism, 44, 1074-1081. doi:10.1016/0026-0495(95)90107-8