Open Journal of Animal Sciences
Vol.4 No.2(2014), Article ID:44835,11 pages DOI:10.4236/ojas.2014.42013
Characteristics of Lactation Curves of the Kenya Alpine Dairy Goats in Smallholder Farms
Andrew Gitahi Marete1*, Reuben Oyoo Mosi2, Joshua Oluoch Amimo1,3, Joseph Owino Jung’a1
1Department of Animal Production, University of Nairobi, Nairobi, Kenya
2School of Agriculture, Food Security and Biodiversity, Bondo University College, Bondo, Kenya
3Department of Food Animal Health Research Program, The Ohio State University, Columbus, USA
Email: *gitahimart@gmail.com
Copyright © 2014 by authors and Scientific Research Publishing Inc.
This work is licensed under the Creative Commons Attribution International License (CC BY).
http://creativecommons.org/licenses/by/4.0/


Received 28 February 2014; revised 2 April 2014; accepted 11 April 2014
ABSTRACT
Lactation curves are a graphical representation of the milk production profile of a doe from parturition to drying up. Their shape provides information about the productivity of the doe and offers a means of explaining features of the milk production patterns of each animal. A total of 2732 daily morning milk records from 610 does of the Kenyan Alpine dairy goats’ genetic groups (50% Alpine, 75% Alpine, 87.5% Alpine and > 87.5% Alpine) and local goats (0% Alpine) kept in smallholder farms were used to evaluate factors affecting milk yield and to examine the characteristics of their lactation curve. A nonlinear mixed model was used to fit the lactation curves to all does simultaneously. The Wood’s (1967) equation was fitted within each genetic group and parity to generate genetic group and parity lactation curves. The mean lactation period was 218 ± 46 days and the model accounted for 88% of the total variation. Significant differences (P < 0.05) between genetic groups were observed in their lactation curve parameters. The estimated week of peak milk yield post kidding was: 2, 4, 6, 6 and 8 weeks; and peak yield was 0.32, 0.75, 0.91, 0.99 and 1.02 Kg/day, for 0% Alpine, 50% Alpine, 75% Alpine, 87.5% Alpine and >87.5% Alpine genetic groups respectively. Genetic group did not significantly affect rate of increase to peak yield (P > 0.05) and rate of decline from peak (P > 0.05) or persistency (P > 0.05). Parity significantly affected rate of increase to peak, rate of decrease from peak and persistency (P < 0.01). The month of kidding significantly affected the rate of increase to peak (P < 0.05) and persistency, but not rate of decrease from peak. The synchronization of breeding with season has a practical implication for the maximization of lactation yield when considered in combination with other biological and economic constraints. The superior production of the pedigree animals supports the development of composite breed types in Kenya to take advantage of the fitness of indigenous breeds, the productivity of imported dairy breeds, heterosis, and the potential for selection within the composite to improve productivity in later generations.
Keywords:Kenya Alpine Dairy Goat; Lactation Curve; Smallholder Farms

1. Introduction
The term “lactation curve” is used to refer to the curve representing the rate of milk yield with advance in lactation. Goats can lactate from kidding to kidding; the challenge would therefore be to estimate the lactation curve which would indicate the days in milk (DIM) up to peak during the lactation period. Woods model has been used in majority of studies to characterize parameters of lactation curves since it had a residual low fluctuation around zero ([1] -[3] reported characteristics of goats lactation curve (maximum yield and time of maximum yield) separately by parity groups (first, second and third or greater)). [4] analyzed performance data of goats raised in a stall-fed system in northern Mexico in order to compare high grade goats with low grade crosses of Alpine, Granadina, Nubian, Saanen and Toggenburg sires with local Mexican goats. Alpine, Saanen and Toggenburg crosses had greater milk production, lactation length and efficiency (milk production/post-kidding body weight) than Granadina and Nubian crosses or local does. Average increase for milk production, lactation length and efficiency over local goats for low-grade Alpine was reported to be 46%. Effects of year of kidding, season of kidding and age were reported to be most significant with goats having two or more kids at birth having greater milk production efficiency and body weight than goats with one kid. As reported by [5] , daily milk yield increased rapidly from kidding to a peak in 35 days, followed by a gradual decline until milking was no longer practical. An abrupt decline in milk yield after the peak increases production costs because yield was distributed less equally over the complete lactation [5] .
[6] characterized lactation curves among crosses of Galla and East African with Toggenburg and Anglo Nubian goats and found that Wood’s equation fitted well the lactation curves of the different breed groups with R2 values ranging from 85% to 92%. There were differences in lactation curve parameters among the genetic groups. The four-way cross had the highest average peak morning milk yield (1.116 kg/d) and estimated total morning milk yield (112.582 kg).
In developing countries, the performance of high-yielding breeds imported from countries with highly advanced production systems is often negatively affected due to genotype-environment interactions ([7] -[10] ). This study provides the basic framework needed for the future development of computationally feasible techniques to evaluate the dairy potential of a Kenya Alpine dairy goat given the initial milk production and a future time, t. The aim of this study was to use an appropriate mathematical model to obtain parameter estimates that would allow a better understanding of the biological nature of the different shapes of lactation curves of dairy goats in Kenya.
2. Materials and Methods
2.1. Animals
The Kenya Alpine dairy goat was used in this study. The breed was developed by crossing and grading-up of the East African goat using German Alpine buck in an effort to providing alternative source of income to smallholder farmers’ in Kenya and to improve nutrition at household level. For over 10 years now, Kenya Alpine dairy goats were bred through natural service, a process characterized by buck rotation facilitated by the Dairy Goat Association of Kenya (DGAK). The goats were usually stall-fed and every household kept between 3 - 6 goats on average. Milking was usually done in the morning after kids have suckled. The goats were housed and fed in a shed. Currently there are four genetic groups of the Kenya Alpine dairy goats and include:
1) 50% Alpine-F1: Pedigreee Alpine Buck (PAB) × Local doe.
2) 75% Alpine-Back cross 1 (R1): PAB × F1 Females.
3) 87.5% Alpine-Back cross 2 (R2): PAB × R1 Females.
4) >87.5% Alpine:
a) Interse mating of Back cross 2: R2 Male × R2 Female.Offspring will remain 87.5% or more.
b) PAB × R2 Female—Grading-up. Offspring will be 93.25% or more.
There has been stabilization of the genetic group with >87.5% alpine genes through breeding, intense selection and culling to form the Kenya Alpine goat breed. Kenya Alpine dairy goats are usually found in the Central and Eastern highlands of Nyeri and Meru districts respectively. Central province was located at 0˚45'S 37˚0'E and in the study period (1999-2009), this area’s districts experienced a closely related climatic pattern with a daily temperature range of 18.0˚C ± 5.1˚C and an annual rainfall ranging from between 607.8 mm to 1701.0 mm per annum. Generally, the long rains were between March to May, while the short rains were from October to December. There were two dry periods which occurred between June to September and January to February. Eastern Province was located at 0˚0'N 38˚0'E and areas around Mt. Kenya experience cold climate all year round due to its high altitude. Meru Central was in the humid zone of Eastern while Embu district was in the sub-humid zone. The annual rainfall ranges from 701.0 mm to 1800.0 mm with a mean diurnal temperature range of 19.5˚C to 24.5˚C. The vegetation was mainly forested land in parts of Meru to agricultural lands in Embu district.
In recent years, the Kenya Alpine goats have spread to lower potential areas (Thika and Murang’a Districts) compared to the original entry areas. These areas are characterized by a humid to sub-humid climate with long, wet and cold wet seasons. Though they are zero-grazed, the kidding season is usually not synchronized but rather depends on conditions of pasture.
2.2. Data
A total of 610 lactating goats were examined over a period of five lactations. As presented in Table 1, 2732 daily morning milk records from the 610 lactating goats were used to fit each individual curve because the does usually nurse their kids in the late afternoon. The age at first kidding (AFK) in days, was calculated as the difference between the date of first kidding (DoK) and the doe’s date of birth (DoB). The age at first service (AFS) in days, was estimated as the difference between the date of first service (DoS) and the doe’s date of birth (DoB). The open days (OD) was estimated as the difference between the date of second service (DoS2) and the date of first kidding (AFK) i.e. ODn = DoSn+1 – AFKn where n was the parity.
2.3. Statistical Analysis
Lactation records made by 610 goats over a period of five lactations were used to characterize the lactation curve. Two analyses were conducted: The first analysis was to estimate lactation curves of each genetic group represented in the data using Wood’s (1967) equation. Morning milk yields during each week of lactation within each genetic group were used to fit genetic group lactation curves separately using the gamma function:

where Yt, is the average morning yield (kg) in week t of lactation; “a” is a scaling factor representing initial average morning yield; “b” is the rate of increase to peak production; “c” is the rate of decline after peak production; and “e” is the exponential. The model parameters were estimated by nonlinear least squares using PROC NLIN of SAS (SAS, 2002).

Table 1. Distribution of lactation records by genetic group and parity.
Peak yield was defined as: a(b/c)be−b and time of peak yield was: (b/c)
The log transformed gamma function was used to estimate persistency (s) as:

The second analysis involved fitting Wood’s equation results for each genetic group to obtain individual status curve parameters. A total of 2732 daily morning milk records were used to fit individual curves because the does were allowed to nurse their kids in the late afternoon. Different factors affecting lactation curve parameters within the genetic groups and parities were assessed. The statistical model used is as shown in model I below:
Model I: 
where, Yiiklm represents the model parameter a, b, c, or persistency defined as s = −(b + 1)ln(c) of doe 1, of breed type k, that kidded in season j, in year i
µ is the underlying constant in each observation;
YRi is year of kidding (1999-2009);
Sj is season of kidding (wet = April, May, June, October, and November; cold dry = July, August, and September; hot dry = December, January, February, and March);
Bk is the genetic group of doe; and V1 and V2 are linear and quadratic partial regression coefficients, respectively, on age of dam (Aijkl) at kidding.
eijklm is the effect of random effects, assumed to be normally distributed with a mean 0 and a variance σ2 = 1
3. Results
3.1. Lactation Curve Parameter Estimates by Genetic Group
Lactation curve parameter estimates for each genetic group are presented in Table 2. Wood’s equation fitted well the lactation curves of the different genetic groups with R2 values ranging from 85% to 91%. There were differences in lactation curve parameters among the genetic groups. Genetic group with >87.5% Alpine genes had the highest average peak morning milk yield (0.813 ± 0.045 kg/d) and estimated total morning milk yield (108.8 kg @ 120 d). Peak milk yield for genetic group with 50% Alpine was at week 3 of lactation which was earlier than for 87.5% Alpine and 75% Alpine genetic group which peaked in week 4 of lactation.
Figure 1 shows the estimated lactation curves for each of the genetic groups. The lactation curves were consistent with earlier findings that goats have flatter and more persistent curves than cattle ([11] ). Persistency of lactation yield was measured from the log transformed gamma function which explained 89% of variation in daily yields, similar to that reported by [6] ; effects of month of kidding (P < 0.05) and parity (P < 0.0001), were significant for the various lactation curve traits. Peak and lactation yields were lower, but persistency was higher during first lactation.
3.2. Lactation Curve Parameter Estimates by Parity
The effect of parity number on lactation curve parameters “a” and “b” was highly significant (P < 0.001 and P < 0.01 respectively) whilst parity had no significant effect on parameter “c”. Does which kid for the first time had
Table 2. Lactation curve parameters by genetic group.
ns = not significant (P > 0.05), *P < 0.05, **P < 0.001.
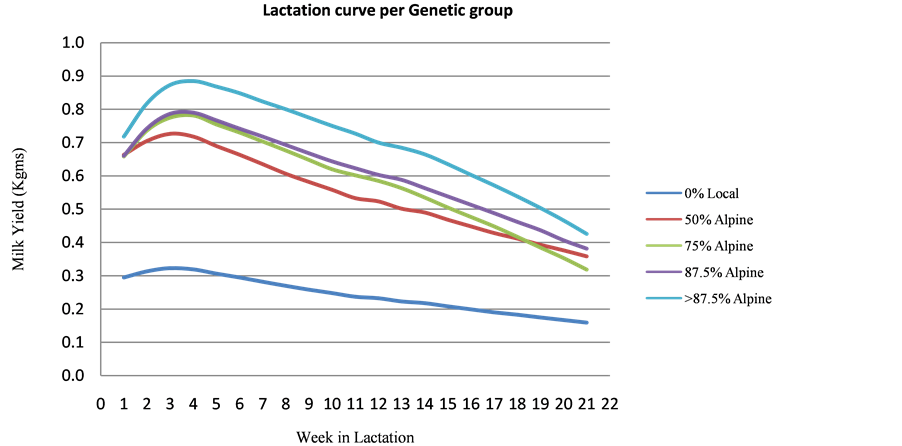
Figure 1. Lactation curve by genetic group.
the lowest initial milk yields, which increased gradually till fourth lactation and then decreased thereafter (Figure 2). The analysis of the lactation curve showed the highest value of “a”, was observed in the third lactation and it was significantly (P < 0.01) different from all other lactations except those in the fourth parity (Table 3). The highest value for “b” was observed in the second and fifth parities and was significantly (P < 0.05) different from the third parity. The value for “c” was lowest in the third parity but was not significantly different from any other parity.
Parity had a significant effect on lactation parameters as shown in Table 3 above. Higher parity animals had higher intercept values; a greater incline parameter (b) while the effect on the declining parameter (c) was not significant in parity 3 and parity 5 (P > 0.05). [12] concluded that the milk secretory tissue in primiparous animals takes longer to reach its peak activity. In the present study, third and fourth parity goats had a longer duration to peak production compared to animals in first and second parity. Goats in the third parity had the highest initial milk yield but lowest rate of increase up to the peak milk yield. This result can be related to the higher milk yield of animals in this group. [13] reported a progressively greater incline between kidding and peak milk production for milk yield with increasing parity number. Similar results for the lactation curve parameter were reported by [6] [14] -[16] .
3.3. Factors Affecting Lactation Curve Parameters
Genetic group of the animal did not have a significant effect on rate of increase to peak yield (P > 0.05), rate of decline from peak (P > 0.001) and persistency (P > 0.001). The lactation number (parity) had significant effect on rate of increase to peak, rate of decline from peak and persistency (P < 0.01) maybe related to development and maturity of mammary glands and acclimatization to tropical environment.
As presented in Table 4, the month of Kidding (an indication that there is seasonal variation) had a significant effect on the rate of milk increase to peak (P < 0.05) and persistency; however it did not have any significant effect from the rate of decrease from peak. The month of kidding and parity have a significant effect in milk production, (P < 0.05). The area of birth, the age at first service and the year of kidding do not have any significant effect on the lactation, (P > 0.05).
Goats kidding between November to December produced the highest milk yield followed by those that kid between January to March and finally those that kid between May to July. [6] reported different shapes of lactation for season of kidding which may be due to constrains in feed availability. [17] and [18] concluded that a clear separation cannot be found among lactation curves pertaining to different seasons of birth. The effect of season of kidding is largely dependent on the availability of green fodder and management practices adopted to protect the animals against adverse climatic conditions. The cropping pattern in Eastern and central parts of
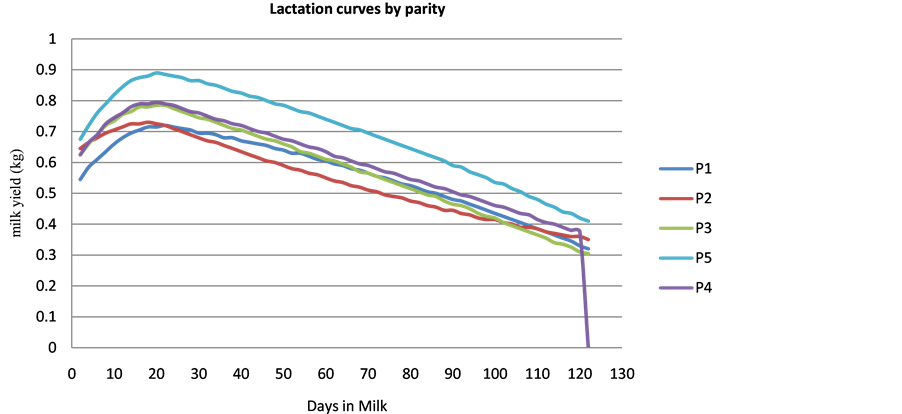
Figure 2. Pooled lactation curves by parity.
Table 3. Lactation curve parameters by parity.
ns = not significant (P > 0.05), *P < 0.05, **P < 0.01.
Table 4. Mean squares of variables from ANOVA of lactation curve traits for Kenya Alpine dairy goats.
ns = not significant (P > 0.05), *P < 0.05; **P < 0.01, ***P < 0.001.
Kenya highlands is such that during certain parts of the year e.g. December to March, abundant green fodder is available but there is an acute shortage from April to June due to dry and hot weather. Goats kidding in May were probably in higher body condition at the time of kidding, had the advantage of abundant green fodder in early lactation and therefore rapidly rose to a high peak yield.
4. Milk Yield
The outstanding efficiency of the Wood model in this study further emphasizes why the model has been used in most lactation curve studies. [6] used the model to provide a good fit to goat lactation data in Galla, East African and Toggenburg goats. It was also used to understand the main factors that influence production levels and general forms of lactation curves ([19] [20] ). Wood’s equation fitted well the lactation curves of the different genetic groups with R2 values ranging from 85% to 91%. The Kenya Alpine goat averaged at least twice as much milk yield as the indigenous breeds for both peak and total yields. The peak yield observed in this study agrees with earlier reports on tropical goats ([11] [21] [22] ). Also, the observed peak day conforms to the range reported for tropical goats ([6] ) and sheep ([23] [24] ). The observed total yield agrees with an earlier report on the same breed of goat ([22] ) but it was higher than those of Adal goats ([25] ), East African and Galla goats ([6] ) and Nigerian Sahel and West African Dwarf goats ([26] ). Though all curve parameters differed with respect to genetic group of doe, year, and age of doe, season of kidding significantly affected the rate of decline from peak (parameter c). This was due to changes in pasture availability over the seasons, consistent with that reported by [18] . Since season effects are related to the amounts of rainfall and hence the availability of pasture, these effects could be explained in terms of body condition of the animals if and when supplementations were started. Similar to findings by [6] on East African and Galla goats raised under similar environment, supplementation played a role in observed higher 120-day milk yields.
The persistency over the 120-day lactation period in the Kenya Alpine dairy goats was high (14.38 days) and signifies the ability of these does to maintain their milk production throughout the lactation period. This is far higher than the ones reported for East African goats and their crosses (2.87 to 4.50 days) with the same 120-day lactation period ([6] ). The strong negative correlation between parameters “a” and “c” suggests that Kenya Alpine dairy goats selected for high initial milk yield may be highly persistent in milk production. This is because lactation persistency is negatively correlated with rate of decline. A similar trend to that observed in the lactation curve characteristics of Kenya Alpine dairy goats has been reported by other workers on goats ([27] ) and sheep ([24] [28] ). The described pattern also agrees with reports that lactation curves of goats are flatter and more persistent than those of cattle ([6] [29] ). Two reasons, management and within-herd improvement, may be advanced for the effect of herd on the shape of lactation curves in Kenya Alpine dairy goats. Although the zerograzed Alpine herd is generally characterized by stall feeding on a daily basis, there are between herd differences in the nature and timing of food supplementation to the animals. Also, the Kenya Alpine dairy goat farmers practice some level of selection based on the individual farmers’ acquired knowledge through personal experience; thus leading to differences in productivity between the herds.
Effects of season of kidding on lactation curve parameters and shape in goats have also been reported in other studies ([6] [30] ) and suggest that strategic seasonal breeding is important to maximize milk yield per doe ([6] ). The high persistence of the early dry season lactation may be explained by the fact that the declining phase of milk production coincided with the period of low or minimal nutritional stress due to the onset of availability of varieties of crop residues resulting from crop harvest.
According to Table 5, seasonal effect (reflected by the month of kidding) was significant and this contributed to the criss-crossing pattern as seen in Figure 2. [20] obtained a criss-crossing pattern of lactation curves when the parameters describing the ascending or descending phases were significantly influenced by any given factor of consideration due to different curve shapes. They also observed that factors affecting only the parameter describing the level of production resulted in curves having similar shapes but on different levels. Similarly, parity effects have been reported for lactation curves of East African goats by the same authors. In this study, parity 5 had the highest level of production, followed by parties 3 and 4. The lowest production level was for does of parity 1. Parities l, 2 and 3 had their production peaks at week 3.5 while parities 4 and 5 had theirs at week 2. All these point to the fact that it may not be necessary to cull does purely on the basis of performance before parity 5. However, preliminary culling for herd replacement can make use of lactation performance at parity 3 in Kenya Alpine dairy goats. In the ANOVA calculations (Table 5), the findings of the non-significant effects of parity could be ascribed to the processes of accelerated cell proliferation of the milk producing udder tissues, which have been shown to influence the shape of the lactation curves. This was because at the beginning of lactation of the first parity, only a small proportion of milk secretion tissues had developed which might have been too few to result into significant differences between the parity ([31] ).
Although found non-significant in this study, higher litter size gave rise to a lower level of milk production. This differed from most other reports on lactating goats ([32] -[34] ), but was in agreement with the reports of [35] and [20] support the present observed trend. The curves developed from the gamma-type model as influenced by the various factors encountered in the present study, suggest that the nature of the curves could provide a basis
Table 5. Analysis of variance for the parameters of lactation milk yield.
CV: coefficient of variation; DIM: days in milk; RMSE: root mean square error.
for planning and adjustment in the management of herds, particularly with regards to culling and assessment of the nutritional and health status of animals. These findings may also provide a basis for developing unbiased methods of comparison among animals with incomplete lactation records for genetic evaluation purposes ([36] ).
5. Milk Yield
The different genetic groups had different milk yields. Goats in the pedigree genetic group (>87.5% pure) produced the most amount of milk at peak week with a yield of 1.0184 kg/d with a 120 day total milk yield of 122.2 kg. Compared to previous studies by [6] , cross-breds were shown to have higher peak morning milk yield of 1.116 kg/d and estimated total morning milk yield of 112.58 kg at 122 days. The high milk production of the pedigree was attributed to high contribution of milk production genes of German Alpine origin during grading-up. Appendix performed similar to Pedigree and took 6 weeks to reach peak yield and had a daily peak yield of 0.9855 kg/d with total peak morning milk yield of 118.3 kg at 120 days. This was because of the two classes, none was given preference in terms of feed supplementation hence the only limiting factor was genetic.
Seasonality in milk production was not evident although there were fluctuations in the trait over the study period. It must be recalled that milking was carried out after the kids had suckled hence the total milk production per lactation would be much higher. The smallholder environment did not thus adversely affect milk productivity. The yields obtained in this study were comparable to those observed by [14] for exotic dairy goats under research station conditions in Kenya, but were higher than those reported by [16] for the same breed raised in tropical environments. An over-emphasis on pedigree information and actual weight of an animal at sale as the main determinants of the value placed on an animal by the farmers’ association led to most of the smallholder farmers not keeping records on individual animal milk production, but rather they tended to pool together information on total milk sold. Despite the Kenya Alpine goat population having expanded greatly in the region, production and fertility records were few. The value of keeping individual animal records to the farmers could only be evident if the records centrally collected were processed and analyzed, with feedback on progress achieved thereafter being given to the farmers. This would need to be addressed for improved productivity of the Kenya Alpine on smallholder farms.
For all genetic groups, milk yield increased gradually from first parity to fifth similar to previous studies by [15] and [16] , where high lactation yields increased with parity, and since all the genetic group were in similar environments with relatively high rainfall, the comfort zones of the Alpines was surpassed.
6. Conclusion
The results demonstrate that the Kenya Alpine goat can perform and thrive reasonably well under low-input farmers’ conditions in Kenya. The goats were able to adapt, grow well and produced reasonably high quantities of milk when fed locally available feed resources. Wood’s model for the lactation curve in cattle closely fitted lactation curves of the goats. Lactation curve parameters differed by genetic group, season of kidding and age of dam at kidding. >87.5% Alpine genetic group had the highest peak yield and produced the greatest 17 wk total lactation yield. Indigenous breeds peaked in week 2 of lactation and were the least persistent. The superior production of the >87.5% Alpine genetic group supports the development of composite breed types in Kenya to take advantage of the fitness of indigenous breeds, the productivity of imported breeds. Further improvement after the composite breed is stabilised can be based on selection. Significant seasonal effects may have practical implications in determining optimal season of breeding to maximize total lactation yield. However, a high demand for the perceived good quality animal from the resource poor farmers negatively influences any possible selection for improved milk productivity as sale of live animals fetches premium prices. The goat “breeders” need to be encouraged to keep records on individual animal’s milk production, and price of animals should be based on potential milk production rather than registration status, supported by regular genetic evaluation of the animals with feedback to the producers on the important traits. A successful recording system must be based not only on the selection goal (genetics has long-term results, especially in harsh conditions), but must also foresee extension services as a means to send a technician to the herd and to give advice to the farmers ([37] ). Future developments should focus on the deliverance of an affordable and practical scheme aimed at the requirements of both small scale and commercial goat producers hence the registration of the different classes needs to be vetted at different levels, to avoid erroneous registration of animals in classes that they do not belong.
Acknowledgements
The authors wish to acknowledge the German International Development (GIZ) Promotion of Private sector development in Agriculture (PSDA) for funding this study. We also acknowledge the Dairy Goat Association of Kenya (DGAK) for support and availing data collected through their association; the smallholder farmers in Nyeri, Murang’a, Embu, Kirinyaga and Vihiga for availing data on their animals, and the Department of Animal production in the University of Nairobi for the provision of facilities to carry out the study and data analysis.
References
- Wood, P.D.P. (1967) Algebraic Models of the Lactation Curves for Milk, Fat and Protein Production with Estimates of Seasonal Variation. Animal Production, 22, 35. http://dx.doi.org/10.1017/S000335610003539X
- Falagán, A., González, C., Pérez, S.J., Goicoechea, A. and Romero, C. (1991) Composition and Production Curve in the Goat’s Milk. Chemie, Mikrobiologie, Technologie der Lebensmittel, 13, 76-82.
- Fernández, C., Sánchez, A. and Garcés, A. (2002) Modelling the Lactation Curve for Test-Day Milk Yield in Murciano-Granadina Goats. Small Ruminant Research, 46, 29-41. http://dx.doi.org/10.1016/S0921-4488(02)00179-7
- Montaldo, H., Almanza, A. and Juiirez, A. (1995) Genotype, Age and Season Effects on Lactation Curve Shape in Goats. Journal Small Ruminant Research, 24, 195-202. http://dx.doi.org/10.1016/S0921-4488(96)00946-7
- Muhammad, A., Philip, J., Peter, R., Muhammad, S., Muhammad, A. and Maroon, E. (2009) Factors Affecting the Shape of the Lactation Curve in Nile-Ravi Buffaloes in Pakistan. Pakistan Journal of Zoology, 9, 201-220.
- Ruvuna, F., Kogi, J.K., Mkuu, S.M. and Taylor J.F. (1995) Lactation Curves among Crosses of Galla and East African with Toggenburg and Anglo Nubian Goat. Small Ruminant Research, 16, 1-6. http://dx.doi.org/10.1016/0921-4488(94)00043-7
- Bondoc, O.C., Smith, C. and Gibson, J. (1989) A Review of Breeding Strategies for Genetic Improvement of Dairy Cattle in Developing Countries. Animal Breeding, 57, 819-829.
- Rege, J.E.O. (1991) Genetic Analysis of Reproduction and Productive Performance of Cattle in Kenya. Journal of Animal Breeding and Genetics, 108, 412-423. http://dx.doi.org/10.1111/j.1439-0388.1991.tb00203.x
- Smith, L.A., Cassell, B. and Pearson, R.E. (1988) The Effect of Inbreeding on the Lifetime Performance of Dairy Cattle. Journal of Dairy Science, 81, 2729-2737. http://dx.doi.org/10.3168/jds.S0022-0302(98)75830-8
- Ojango, J.M.K., Ducrocq, V. and Pollott, G.E (2005) Short Communication Survival Analysis of Factors Affecting Culling Early in the Productive Life of Holstein-Friesian Cattle in Kenya.
- Devendra, C. and McLeroy, G.B. (1982) Goat and Sheep Production in the Tropics. Longman, Harlow, Essex, UK.
- Akpa, G.N., Asiribo, O., Oni, O.O. and Alawa, J.P. (2001) The Influence of Non-Genetic Factors on the Shape of Lactation Curves in Red Sokoto Goats. Animal Science, 72, 233-239.
- Gipson, T.A. and Grossman, M. (1990) Lactation Curves in Dairy Goats: A Review. Small Ruminant Research, 3, 383. http://dx.doi.org/10.1016/0921-4488(90)90019-3
- Odenya, W.O. (1984) Milk Production Yields from Toggenburg and Black Bedouin Goats under Medium Rainfall Zone. Ministry of Livestock Development, Kenya: Sheep and Goats Development Project, Technical Note No. 21, 5.
- Andonov, S., Ødegård, J., Boman, I.A., Svendsen, M., Holme, I.J., Adnøy, T., et al. (2007) Validation of Test-Day Models for Genetic Evaluation of Dairy Goats in Norway. Journal of Dairy Science, 90, 4863-4871. http://dx.doi.org/10.3168/jds.2006-626
- Gipson, T.A. (2002) Preliminary Observations: Inbreeding in Dairy Goats and Its Effects on Milk Production. In: Proceedings of 17th Ann. Goat Field Day, Langston, 51-56.
- Tekerli, M., Akinci, Z., Dogan, I. and Akcan, A. (2000) Factors Affecting the Shape of Lactation Curves of Holstein Cows from the Balikesir Province of Turkey. Journal of Dairy Science, 83, 1381-1386. http://dx.doi.org/10.3168/jds.S0022-0302(00)75006-5
- Catillo, G., Macciotta, N.P.P., Carretta, A. and Cappio-Borlino, A. (2002) Effects of Age and Calving Season on Lactation Curves of Milk Production Traits in Italian Water Buffaloes. Journal of Dairy Science, 85, 1298-1306. http://dx.doi.org/10.3168/jds.S0022-0302(02)74194-5
- Wahome, R.G. (1987) Milk Production Potential of Free Ranging Small East African Goats. Thesis, University of Nairobi, Nairobi.
- Wahome, R.G., Carles, A.B. and Schewartz, H.J. (1994) An Analysis of Variation of Lactation Curves of Small East African Goats. Small Ruminant Research, 15, 1-7. http://dx.doi.org/10.1016/0921-4488(94)90053-1
- Morand-Fehr, P. and Sauvant, D. (1978) Nutrition and Optimum Performance of Dairy Goats. Livestock Production Science, 5, 203-212. http://dx.doi.org/10.1016/0301-6226(78)90046-5
- Osinowo, O.A. and Abubakar, B.Y. (1989) Appropriate Breeding Strategies for Small Ruminant Production in West and Central Africa. In: Adeniji, K.O., Ed., Proceedings of the Workshop on the Improvement of Small Ruminants in West and Central Africa, Ibadan, 21-25 November 1988, 71-84.
- Lloyd, D.H. (1963) The Milk Production of Merino Ewes at Pasture. Australian Journal of Agricultural Research, 14, 824-838. http://dx.doi.org/10.1071/AR9630824
- Hassan, H.A. (1995) Effect of Crossing and Environmental Factors on Production and Some Constituents of Milk in Ossimi and Saidi Sheep and Their Crosses with Chios. Small Ruminant Research, 18, 165-172. http://dx.doi.org/10.1016/0921-4488(95)00684-D
- Awgichew, K., Yacob, Y. and Fletcher, I. (1991) Productivity of Pure-Bred Adal and Quarter Bred Saanen 5 Adal goats in Ethiopia. Dairy Science Abstracts, 53, 4951.
- Egwu, G.O., Onyeyili, P.A., Chibuzo, G.A. and Ameh, J.A. (1995) Improved Productivity of Goats and Utilization of Goat Milk in Nigeria. Small Ruminant Research, 16, 195-201. http://dx.doi.org/10.1016/0921-4488(95)00630-4
- Mukundan, G. and Bhat, P.N. (1983) Lactation Curve in Malabari Goats and Their Saanen Halfbreds. Indian Journal of Animal Science, 53, 666-669.
- Sakul, H. and Boylan, W.J. (1992) Lactation Curves for Several US Sheep Breeds. Animal Production, 54, 229-233. http://dx.doi.org/10.1017/S0003356100036849
- Devendra, C. (1980) Milk Production in Goats Compared to Buffalo and Cattle in Humid Tropics. Journal of Dairy Science, 63, 1755-1767. http://dx.doi.org/10.3168/jds.S0022-0302(80)83135-3
- Gipson, T.A. and Grossman, M. (1989) Diphasic Analysis of Lactation Curves in Dairy Goats. Journal of Dairy Science, 72, 1035-1044. http://dx.doi.org/10.3168/jds.S0022-0302(89)79199-2
- Dijkstra, J., France, J., Dhanoa, M.S., Maas, J.A., Hanigan, M.D., Rook, A.J. and Beever, D.E. (1997) A Model to Describe Growth Patterns of the Mammary Gland during Pregnancy and Lactation. Journal of Dairy Science, 80, 2340- 2354. http://dx.doi.org/10.3168/jds.S0022-0302(97)76185-X
- Ehoche, O.W. and Buvanendran, V. (1983) Yield and Composition of Milk and Preweaning Growth Rate of Red Sokoto Goats in Nigeria. World Review of Animal Production, 19, 19-24.
- Mavrogenis, A.P., Constantinou, A. and Louca, A. (1984) Environmental and Genetic Causes of Variation in Production Traits of Damascus Goats. 1. Pre-Weaning and Post-Weaning Growth. Animal Production, 38, 91-97. http://dx.doi.org/10.1017/S0003356100041398
- Mourad, M. (1993) Reproductive Performance of Alpine and Zaraibi Goats and Growth of Their First Cross in Egypt. Small Ruminant Research, 12, 379-384. http://dx.doi.org/10.1016/0921-4488(93)90073-Q
- Madrid-Bury, N., Gonzalez-Stagnara, C. and Fiqueron, L. (1982) Milk Production of Native Goats in a Tropical Zone. Proceedings of the 3rd International Conference on Goat Production and Diseases, Tucson, 10-15 January 1982, 84.
- Guo, Z. and Swalve, H. (1995) Modeling of the Lactation Curve as a Sub-Model in the Evaluation of Test-Day Records. Proceedings of the Interbull Annual Meeting, Prague, 7-8 September 1995, Bulletin no. 11. Department of Animal Breeding and Genetics, SLU, Uppsala.
- Moioli, B., Astruc, J.M. and Sanna, S. (2000) Successful Establishment of Small Ruminant Recording Systems in the Mediterranean Countries. In: Development of Successful Animal Recording Systems for Transition and Developing Countries. Proceedings of the FAO/ICAR Seminar, Interlaken, 27 May 2002, 155.
NOTES

*Corresponding author.