Open Journal of Physical Chemistry
Vol. 2 No. 1 (2012) , Article ID: 17539 , 11 pages DOI:10.4236/ojpc.2012.21007
CdSxSey/TiO2 Solar Cell Prepared with Sintered Mixture Deposition
Institute of Physical Chemistry, Heinrich Heine University, Duesseldorf, Germany
Email: *kleinermanns@uni-duesseldorf.de
Received October 18, 2011; revised November 21, 2011; accepted December 23, 2011
Keywords: Solar Cells; Nanocomposites; Cadmium Selenosulphide; Titanium Dioxide
ABSTRACT
Grätzel cells were prepared by using CdSeand CdSxSey-nanoparticles as sensitizer. The quantum dots were incorporated in various sizes and concentrations in a TiO2 nanoparticle layer by a simple mixing procedure. The advantage of this method compared to anchoring of nanoparticles to TiO2 by linker molecules or chemical bath deposition is that we are able to control the ratio between TiO2 and CdSe or CdSxSey more precisely and over a larger range of concentrations. TiO2 solar cells sensitized by this technique achieved photon-to-current conversion efficiencies (IPCE) of ~40% in the range of 300 - 500 nm with a maximum IPCE of ~70% at 400 nm (sulphide/sulphate electrolyte). The best results at wavelengths above 500 nm were achieved with CdSxSey/TiO2 cells at a molar ratio of 6:1 (S:Se) with IPCE of 40% at 500 nm and still 15% at 800 nm. Quantum efficiencies obtained with iodine/iodide electrolyte were lower and lead to an overall efficiency of 0.32%. The CdSxSey sensitized solar cells show enhanced stability compared to CdSe based systems and the use of the iodine/iodide electrolyte increases cell endurance further.
1. Introduction
About 20 years ago Grätzel and O’Regan demonstrated their concept of dye sensitized solar cells (DSC), as a promising alternative to p-n junction silicon cells [1]. While the growth of the photovoltaic market over the last decade has been impressive, the cost of the photovoltaic electricity production is still too high to be competitive with fossil fuels. Dye-sensitized nano-porous TiO2 photoelectrochemical cells with high IPCE and low cost are possible alternatives to silicium solar cells in a solar powered future [2]. The working cycle of this cell type consists of dye excitation, electron injection into the conduction band (CB) of titanium dioxide-a wide-bandgap semiconductor used for electron transport-and fast reduction of the oxidized dye by a redox couple. Ruthenium dye sensitized TiO2 cells reached overall solar (standard AM 1.5) to current conversion efficiencies of 10% with stabilities of several months [1,3]. Long term cell degradation due to corrosion caused by the redox electrolyte could be reduced using for example ionic liquid electrolytes [4].
During the last years different types of quantum dots (QD) like InP [5], PbS [6,7], Bi2S3 [6,8], InAs [9], CdS [6,10] and CdSe [11,12] have been investigated for their possible use as photo sensitizer [13]. Semiconductor QDs such as CdSe have several advantages as solar cell sensitizers. The working principle of the QD-sensitized solar cell (QDSC) is explained in Figure 1 and very similar to DSC. The energy gap of the QDs can in principle be controlled by the change of quantum confinement at different quantum dot size so that the absorption
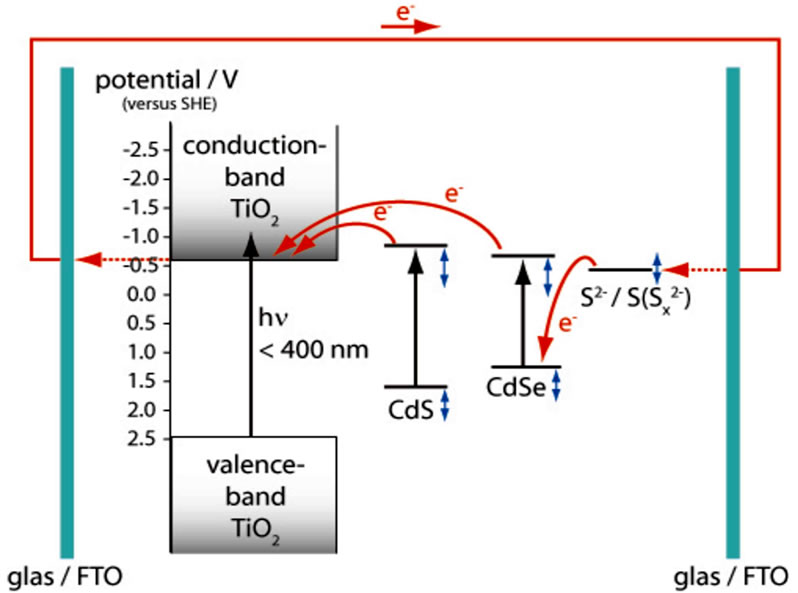
Figure 1. Scheme of the quantum dot solar cell. The working cycle consists of CdS or CdSe excitation, electron (e-) injection into the conduction band (CB) of titanium dioxide and fast reduction of the oxidized sensitiser h+ by a Na2S/ Na2SO4 redox couple. Redox potentials are given in Volts [V] against Standard Hydrogen Potential [SHE]. Variation of redox potentials due to NC size and preparation conditions as well as electrolyte concentration are indicated by vertical arrows.
spectra can be tuned to match the spectral distribution of sunlight [14]. QDs have large absorption cross sections accompanied by large dipole moments upon electronic excitation facilitating ultrafast charge separation. Quantum yields higher than unity are possible due to hot electron impact ionisation leading to secondary electrons [15-18].
Efficient electron injection from the photoexcited QD into the TiO2 conduction band requires close QD-TiO2 contact. Deposition of CdSe-QD layers on a conducting transparent substrate (usually fluorine doped tin oxide— FTO) covered with nano-crystalline(NC)-TiO2 by using simple dipping has been reported to be applicable (direct absorption—DA) [19-23]. Anchoring QDs on TiO2 by linker molecules containing both carboxylate and thiol functional groups is another approach to achieve close and stable contact (linker technique) [12,21,24]. Direct or in layer reaction of the cationic and anionic QD precursors in the TiO2 pores is a further preparation method called chemical bath deposition (CBD) [25-27]. Electrodeposition of NC-semiconductor films by cathodic reduction [28-32], co-evaporation [29,33,34] and screen printing [35-37] are techniques for photo-sensitizing conducting electrodes with semiconductor QDs.
In this paper we introduce an alternative approach to achieve close QD-TiO2 contact. We mix size-defined CdSe and CdS NCs as well as CdSxSey nanocomposites with TiO2 gel in defined volume ratios, deposit the mixture on FTO at defined thickness and anneal the sample at 450˚C. We call this technique “sintered mixture deposition” (SMD) and found it to be more simple, versatile and reproducible than DA or anchoring by linker molecules. In particular it is possible to optimise IPCE by independently adjusting the QD size and volume ratio of the mixture. This technique however requires the development of QDs which are thermally stable and do not react with the electrolyte. Much of this paper describes our development and control of suitable QDs for SMD. Using SMD we attained optimum IPCE of 15% - 60% over an extended wavelength range in the visible spectral region which was not achievable before with single junction QDSCs to the best of our knowledge.
2. Experiments
Two routes to synthesize CdSe nanoparticles suitable for SMD were followed. The size of the CdSe nanoparticles made by route 1 was in the range of 2 - 50 nm [20]. As selenium source a 80 mM aqueous solution of sodium selenosulphate (Na2SeSO3) was prepared by stirring elemental selenium powder (63.2 mg, 0.8 mmol, Aldrich) with an excess of sodium sulfite (252 mg, 2 mmol, Aldrich) in 10 ml H2O at 70˚C for several hours until the Se˚ powder was completely dissolved. The cadmium source was obtained by mixing 10 ml of a 80 mM aqueous cadmium sulphate solution (CdSO4·8/3H2O, Fluka) with 120 mM nitrilotriacetic acid trisodium salt (Aldrich) dissolved in 10 ml H2O. After combining the Se and Cd solution under rapid stirring, a light green colour appeared, which increased to an intense yellow colour within the next 10 minutes, then changed to orange within 48 hours and finally shifted to red after one week. The CdSe suspension was centrifuged for 5 minutes at 13,000 rmp, the aqueous phase was discarded and the residual solid was dried for 1 week in an exsiccator.
As first step of the synthesis route 2 [38] we dissolved Cd(ClO4)2·6H2O (985 mg, 2.35 mmol, Aldrich) in 125 mL water. Afterwards 5.7 mmol of the thiol-stabiliser 1-thioglycerol (TG, Aldrich), thioglycolic acid (TGA, Aldrich) or 3-mercaptopropionic acid (MPA, Aldrich)) were added during stirring and the pH of the solution was adjusted between 11.2 and 11.8 by dropwise addition of 1 M NaOH (Aldrich). Another three neck flask with Al2Se3 lumps (134 mg, 0.46 mmol, Aldrich) was connected and flushed with N2 for about 30 minutes. The cadmium solution was deaerated in the same way. Subsequently 10 - 20 ml of 0.5 M H2SO4 (Aldrich) was added to the Al2Se3 lumps via a septum and the generated H2Se gas was passed to the solution via a slow nitrogen flow for about 20 minutes. Depending on the stabiliser the colour of the solution changed due to the formation of CdSe particles (TG: yellow; TGA: orange; MPA: red). The CdSe precursors grew to CdSe nanocrystals under reflux (100˚C, 24 hours). For precipitation of the CdSe NCs isopropanol (Fluka) was added. The suspension was centrifuged for 5 minutes at 13,000 rmp, the aqueous phase was discarded and the residual solid was dried in an exsiccator for 1 week. This route gave particles with a size of 1 - 2 nm (TG), 2 - 4 nm (TGA) and 3 - 5 nm (MPA).
For comparison cadmium sulphide NCs were prepared with a size distribution of 2 - 4 nm [39]. 1-thioglycerol (TG, 1.87 ml, 22 mmol, Aldrich) was added to 30 ml of a 80 mM aqueous cadmium sulphate solution (CdSO4·8/3H2O, Fluka). During constant stirring for 5 minutes ammonium sulphide (12.4 ml, 36 mmol, 20% aqueous solution, Aldrich) was added. An intense yellow solution with yellow precipitation was obtained thereafter, which was centrifuged and dried for 1 week.
Cadmium selenosulphide nanocomposites were prepared according to route 3 [40]. In specific molar ratios 1:1 to 24:1 (S:Se) cadmium sulphide NCs and selenium powder were suspended in methanol. After 1 hour of stirring methanol was evaporated at 80˚C. The resulting CdS:Se solid was sintered at 550˚C for 15 minutes. Depending on the molar ratio the colour of the CdSxSey composites ranged from yellow (24:1) to dark violet (1:1).
TiO2 nanopowder (5 g Aearosil TiO2 P25, Evonik) was suspended in nitric acid (1 N, Fluka) to prepare a suitable TiO2 paste. This suspension was heated at 80˚C for 24 hours. Afterwards the nitric acid was evaporated and the TiO2 solid was dried for 3 days at 100˚C. Finally the TiO2 solid was treated with 25 ml water, acetylacetone (2.5 g, 24.97 mmol, Merck), Triton-X-100 (1.25 g, 1.92 mmol, Avocado) and polyethylene oxide (M.W. 100,000, Alfa Aesar).
A colourless and clear solution of TiO2 nanoparticles was prepared as follows [41]. Titanium(IV)butoxide (8.5 ml, 0.025 mmol, Aldrich) was dissolved in ethanol (19 ml, Aldrich) and diethanolamine (2 ml, 20.8 mmol, Fluka). Subsequently 19 ml ethanol and 0.5 ml H2O were added very slowly. The solution was stirred over night.
The SMD technique used for fabrication of QDSC will now be described in detail. For each type of CdSe-NP three different volume ratios of the solid QD-samples were mixed with the TiO2-suspension (1:1, 1:3 and 1:5 QD:TiO2). In the case of CdSxSey 20 mg of the solid nanocomposite sample were mixed with 0.5 ml of the TiO2 suspension. We used aluminoborosilicate glass coated with fluorine doped tin oxide (SnO2:F) as conducting transparent substrate (resistivity ~10 ohm/cm2; Solaronix SA, Switzerland). The active area was masked with scotch tape and was coated with CdSe/TiO2, CdS/TiO2 or CdSxSey/TiO2 suspension by use of a glass scraper and dried at 80˚C for 10 min. After removal of the scotch tape we measured ~11 mm deposit thickness. This primed photoelectrode was sintered in a muffle furnace for ~45 min at 450˚C. A thin platinium layer was spread on the FTO coating of the counter electrode (Platisol; Solaronix SA, Switzerland). Few drops of an aqueous electrolyte mixture of 0.1 M Na2S (Alfa-Aesar) and 0.01 M Na2SO4 (Aldirch) were added to the photoelectrode for reduction of the oxidized QDs. In case of the I-V measurements the active redox couple iodine/iodide (0.1 M lithium iodide (Fluka), 0.05 M iodine (Aldrich), 0.6 M tetrabutylammonium iodide (Aldrich) and 0.5 M 4-tert-butylpyridine (Aldrich) in acetonitrile (Aldrich)) was used. Finally the counter electrode was clamped to the photoelectrode/electrolyte system.
Measurements of the wavelength dependence of the short circuit current (jsc) were carried out in a light-proof box with a 70 W Xenon lamp (Oriel, Germany) and a grating monochromator (Zeiss, Germany) in the spectral range of 300 - 800 nm at 1 nm resolution. Data were transmitted to a computer and processed there. The light intensity incident on the electrode (Iinc) was measured with a power meter (Coherent, USA). The IPCE is defined by the following expression [42]:
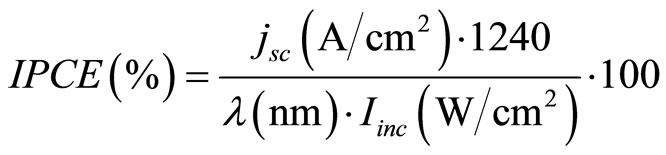 (1)
(1)
The photocurrent-voltage (I-V) curves were measured using a 120 W Xenon lamp (Oriel, Germany) and a special filter, which was focused to give 100 mW/cm² (1 sun) at Air Mass (AM) 1.5 at the surface of the solar cell. The fill factors ff and overall efficiencies  were calculated according to Equations (2) and (3). Here MPP is the “maximum power point” and Uoc the open-circuit voltage [43].
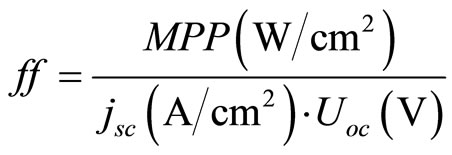 (2)
(2)
 (3)
(3)
Optical absorption spectra of the synthesis products were recorded by using a Cary 300 UV-Vis spectrophotometer operated at a resolution of 1 nm. The absorption spectra of the electrodes were measured in a reflection arrangement. The particle size distribution was investigated by Transmission Electron Microscopy (HITACHI TEM 7500) at the Max-Planck institute for coal research (MPI Mülheim a.d. Ruhr).
3. Results and Discussion
CdSe NCs synthesized via route 1 exhibited nearly complete sulphide-selenide exchange with the electrolyte in QDSCs prepared with SMD, see Supplementary Material. We investigated CdSe NCs synthesized via route 2 for their stability against the electrolyte. Their TEM images are given in Figure 2. The size distribution dependent on the stabiliser is shown in the insets of Figure 2. Based on our electron microscope images we propose Ostwald ripening to be responsible for the formation of the nanoparticles.
Figure 3 shows the absorption spectra of CdSe NCs protected with different stabilisers in solution. As expected the absorption shifts to the red with increasing particle size [44]. The size of the CdSe-NPs influences the performance of the QDSCs significantly and thus the size distribution is a decisive factor to prepare QDSCs with high efficiencies.
For solar cells the absorption of the sintered mixture is more important than the absorption spectra of the QDs in aqueous solution. Figure 4 shows the absorption spectra of the mixtures of TGA-stabilised CdSe NCs with TiO2 on FTO coated glass as obtained by reflection spectroscopy. The absorption of pure TiO2 nanoparticles is already subtracted here. Before annealing the characteristic absorption of CdSe/TGA NCs is in the range of 400 - 600 nm.
After annealing the orange coloured CdSe/TiO2 sheets change its colour to purple. In contrast to the reflection spectrum of the CdSe NPs synthesized by route 1 (Figure S3) there is still considerable absorption in the range up to 700 nm. Obviously, after contact with the Na2S/
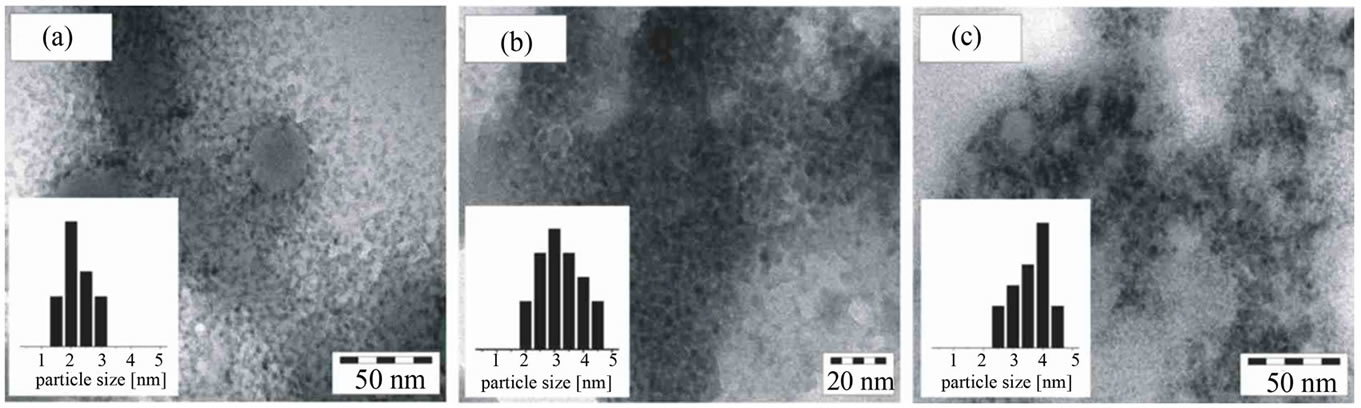
Figure 2. TEM images of CdSe NCs stabilised with three different reagents. Their synthesis is described in the experimental section (route 2). The insets indicate the size distribution as obtained from diameter measurements of 20-40 particles. Typical size ranges are 2 nm for the particles stabilised by TG, 2-4 nm by TGA and 4 nm by MPA. (a) TG; (b) TGA: (c) MPA.
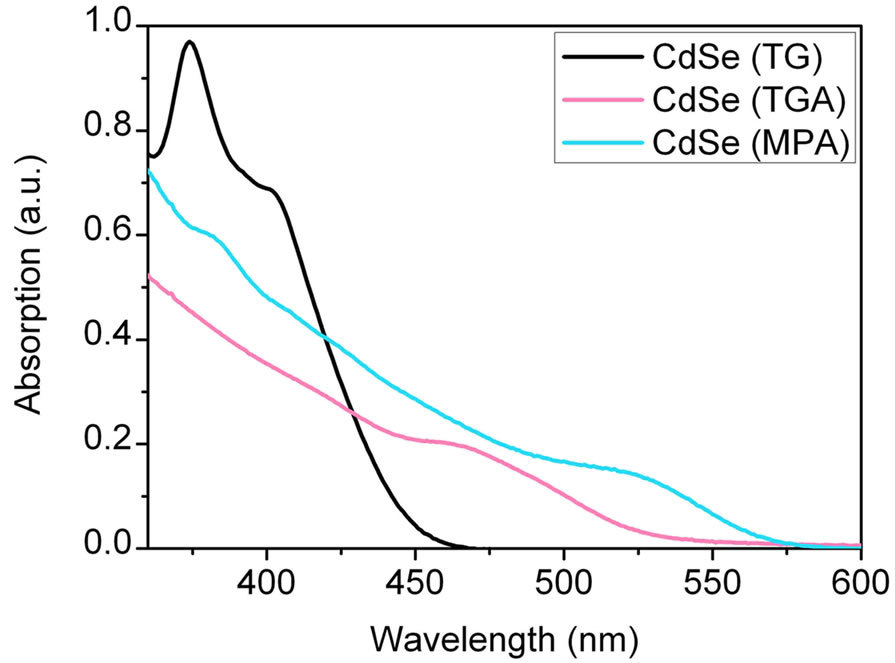
Figure 3. Absorption spectra of CdSe NCs (route 2) of different size measured in solution (after 24 hours heating).
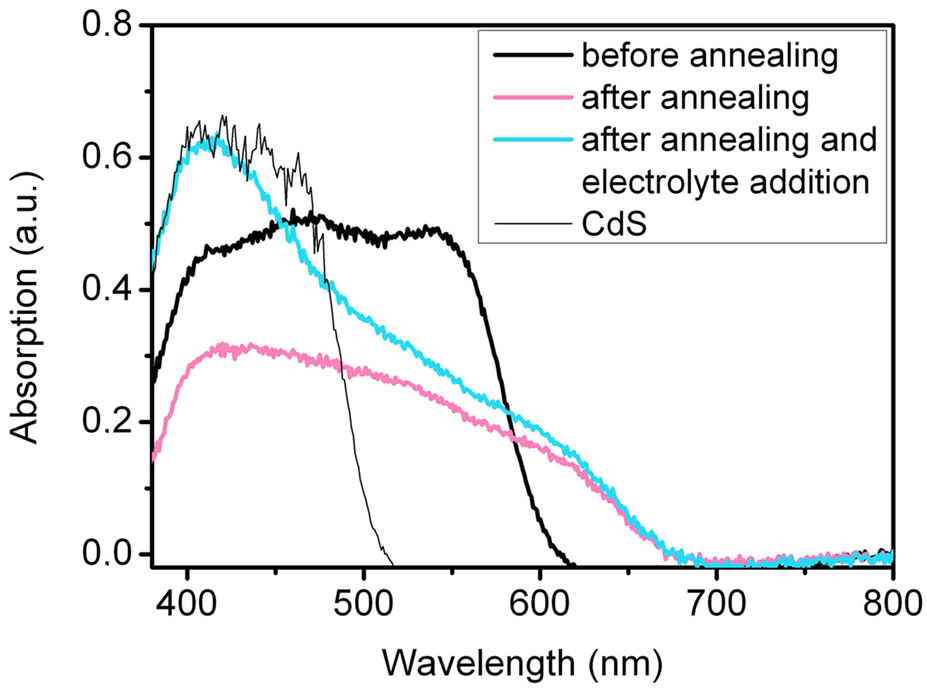
Figure 4. Absorption spectra of CdSe NCs (route 2) stabilised by TGA and CdS NCs measured in reflection before or after annealing at 450˚C and electrolyte (Na2S/Na2SO4) contact. After contact with the Na2S/Na2SO4 electrolyte only very little selenide-sulphide exchange can be observed.
Na2SO4 electrolyte only very little selenide-sulphide exchange takes place. The main difference between route 1 and 2 is the use of sulphur-containing stabilisers in route 2. Probably CdS layer is formed on the surface of route 2 QDs during the sintering process at 450˚C leading to core-shell particles. This CdS layer prevents a large selenide-sulphide exchange. The CdSe particles stabilised by TG and MPA show the same behaviour. Hence route 2 QDs are promising candidates for SMD coated QDSCs.
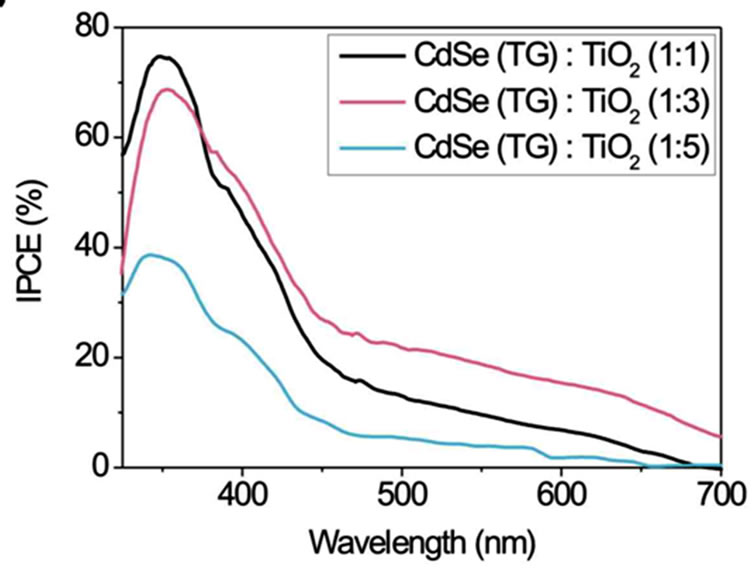
Figure 5 displays IPCE curves of CdSe particles stabilised with TG, TGA and MPA in volume ratios of 1:1, 1:3 and 1:5 (CdSe:TiO2) and Na2S/Na2SO4 as redox couple. The smallest CdSe particles with a size of 2 nm (stabilised with TG) in a 1:1 volume ratio with TiO2 exhibit the highest IPCE (Figure 5(a)).
In the range of 350 - 450 nm the IPCE reaches a value over 70%. But for the more interesting range of 500 - 700 nm a volume ratio of 1:3 shows the best result. Here an IPCE of about 20% is observed. The volume ratio 1:5 is only photoelectrically sensitive up to ~470 nm. For TGA as stabiliser the spectra in Figure 5(b) show an opposite behaviour in the range up to 500 nm. The IPCE increases with increasing volume ratio of TiO2. A 1:5 volume ratio shows a maximum IPCE of 65% at ~370 nm and 10% - 20% in the range 450 - 600 nm. Figure 5(c) shows IPCEs when MPA stabiliser is used. Volume ratios of 1:3 and 1:5 have IPCE values of 45% at about 370 nm and 5% - 10% at 450 - 700 nm. In summary the smaller NCs obtained by use of TG stabiliser show the best IPCE. Probably they are more easily intercalated between the TiO2 nanoparticles and therefore homogeneously mixed in large quantities with TiO2. A possible however speculative explanation is that larger NCs do not fit into the TiO2 lattice cavities. In larger quantities they might form NC layers which electrically isolate TiO2. Whereas the smallest NCs show the best IPCE their absorption in the visible spectral range is limited due to their size (quantum confinement).
We therefore looked for small NCs which absorb further to the red and simultaneously show good temperature and electrolyte stability for effective sintered mixture deposition.
Cadmium selenosulphide CdSxSey nanocomposites proved to be an excellent alternative. Because of their synthesis at 550˚C in route 3 they are stable during the
 (a)
(a)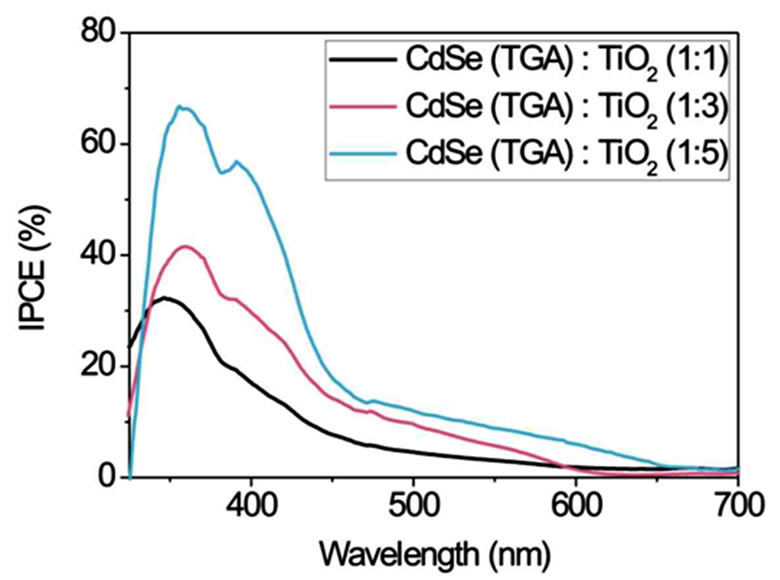 (b)
(b)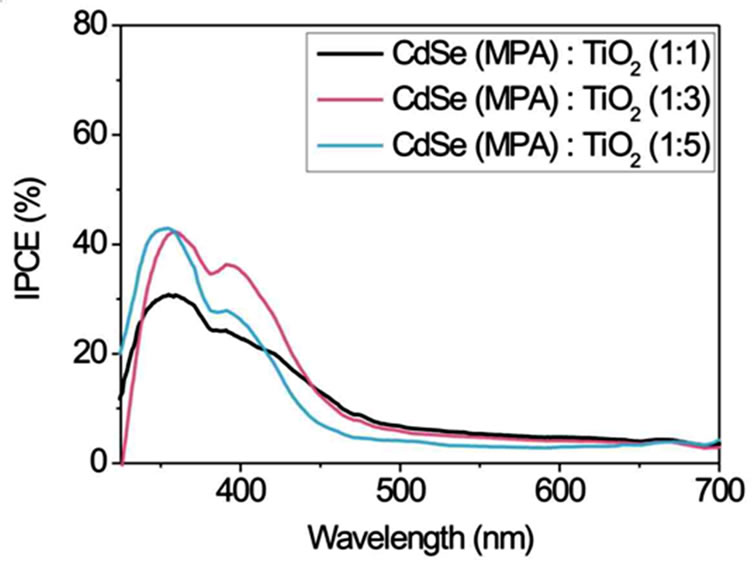 (c)
(c)
Figure 5. Comparison of the incident photon-to-current efficiencies (IPCE) of CdSe solar cells working with Na2S/ Na2SO4 redox couple. CdSe NCs of different size (depending on the stabiliser (a) TG; (b) TGA and (c) MPA (route 2)) and different NC/TiO2 volume ratios of 1:1, 1:3 and 1:5 were used.
preparation of the CdSxSey/TiO2 solar cells with SMD. In contrast to CdSe NCs CdSxSey nanocomposites are not soluble in standard solvents. This impedes the analysis of their size distribution and composition by TEM. Due to the high affinity of CdSxSey to TiO2 a part of them however binds to the surface of TiO2 NPs in a colourless, clear ethanolic TiO2 solution, see Experiments. Now it is possible to obtain meaningful TEM images. Figure 6 displays images of the CdS12Se1 particles in contact with TiO2. The composite particles exhibit a size of about 50 nm. Elemental analysis by local energy dispersive X-ray spectroscopy (EDX) indeed showed that the composite particles contain Ti, Cd, S and Se.
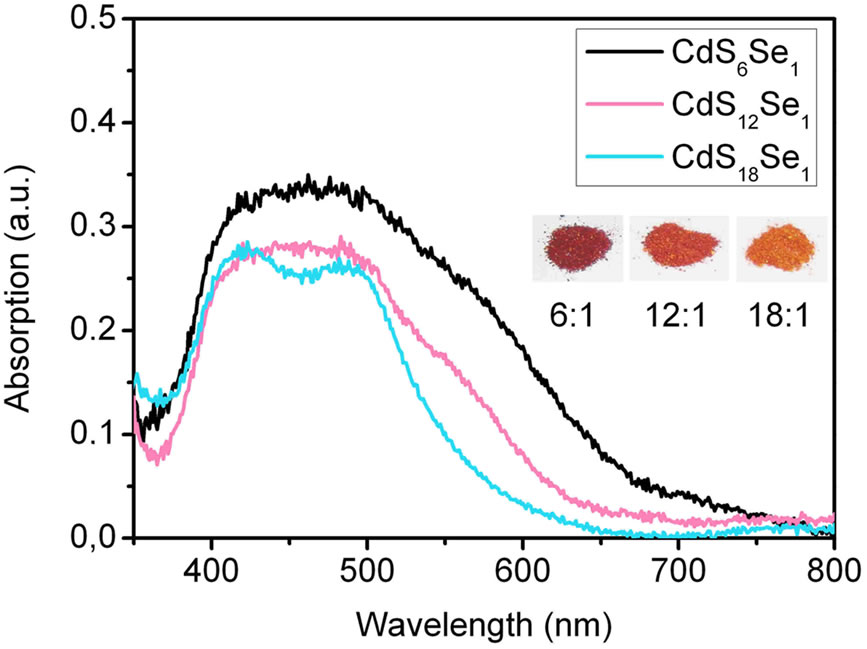
Figure 7 displays the absorption spectra of CdSxSey particles with different S:Se ratios mixed with TiO2 paste
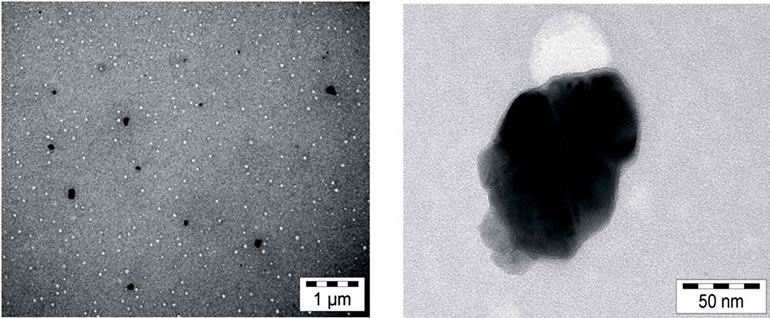
Figure 6. TEM images of CdS12Se1/TiO2 nanocomposites obtained from dispersion of CdS12Se1 QDs in a colourless, clear TiO2 solution (black spots in the left image; one of the spots is magnified in the right image).
 (a)
(a)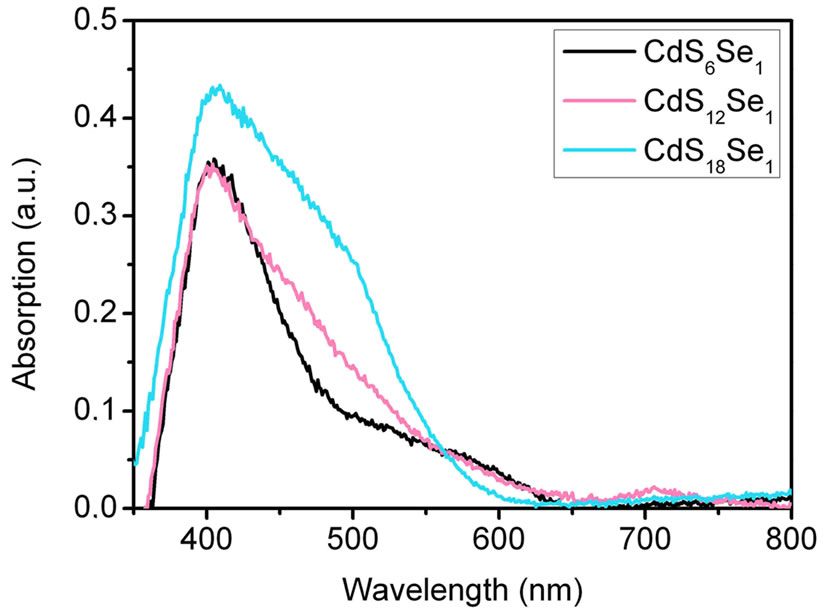 (b)
(b)
Figure 7. (a) Absorption spectra of CdSxSey particles (route 3) of different molar ratios measured in reflection before annealing at 450˚C. The inset shows the photograph of three samples with different S:Se molar ratios; (b) Absorption spectra of CdSxSey NCs (route 3) of different molar ratios measured in reflection after annealing at 450˚C and electrolyte (Na2S/Na2SO4) contact.
on FTO coated glass as obtained by reflection spectroscopy. The absorption of pure TiO2 nanoparticles was subtracted. Before sintering (Figure 7(a)) a broad absorption band in the range of 400 - 700 nm is observed. In the case of the 6:1 and 12:1 ratios (S:Se) absorption extends up to 800 nm. After annealing at 450˚C and contact with the Na2S/ Na2SO4 electrolyte the samples still show some absorption up to 800 nm (Figure 7b)). Only very little selenide-sulphide exchange could be observed. With increasing ratio of sulphur the absorption spectra are more similar to the spectrum of pure CdS-NCs (Figure 4). The CdS-NCs exhibit absorption only up to 500 nm.
Figure 8 compares the different TiO2 sensitizers using SMD for cell preparation. Clearly the CdS6Se1 sensitizer shows the best results. At shorter wavelengths (400 - 600 nm) an IPCE of ~40% (520 nm) is observed. IPCE values in the visible range up to 800 nm are higher compared to the CdSe sensitizer.
Figure 8 shows that the sulphide/sulphate electrolyte leads to approximately two times higher IPCE values than the iodine/iodide electrolyte. When however using sulphide/sulphate as electrolyte the photocurrent decreases rapidly under irradiation at AM 1.5. A record of the I-V curves is not possible. During the irradiation the sulphate/sulphide electrolyte decomposes. The sheets show yellow coloured parts from elemental sulphur.
Figure 9 presents the I-V curves of CdS and CdSxSey based QDSCs measured with an iodine/iodide redox system. The resulting fill factors and overall efficiencies are shown in Table 1.
Solar cells prepared with CdSe-NP’s by using the SMD method show only the typical TiO2 IPCE-spectrum. We have achieved a best efficiency  of 0.32% with a fill factor of 0.34 for QDSCs based on CdS6Se1-NCs and the iodine/iodide electrolyte. The order of the short-circuit photocurrent densities are in agreement with the trends of the IPCE-values (CdS6Se1 > CdSe12Se1 > CdS18Se1). The open-circuit photovoltages of these nanocomposites are similar. In comparison with QDSCs based on CdS the overall efficiences and the photocurrents of CdSxSey sensitized QDSCs are substantially higher because CdS nanoparticles absorb only in a small range of the solar spectrum.
4. Conclusions
We synthesized thiol-stabilised cadmium selenide nanocrystals by passing selenium hydrogen gas in an aqueous solution of cadmium ions, precipitation and drying in order to get a solid CdSe nanopowder. In contrast to other preparation methods for QDSC we are able to control the ratio between titanium dioxide and CdSe more precisely in a large range by mixing them in defined quantities using SMD. In order to enlarge the absorption range of the solar cells we investigated nanoparticles of
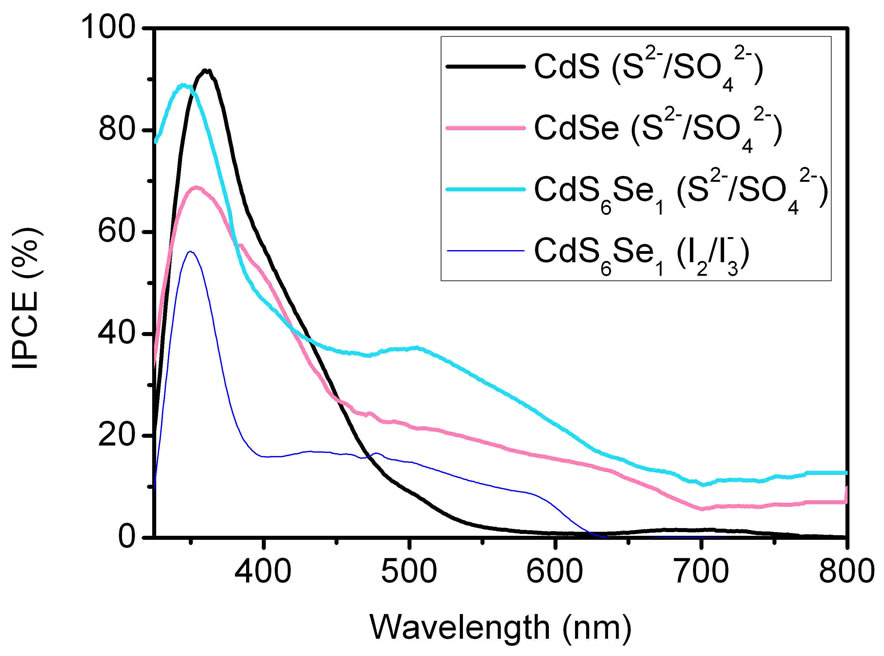
Figure 8. Comparison of the incident photon-to-current efficiencies (IPCE) of CdS6Se1, CdSe and CdS sensitized solar cells measured with Na2S/Na2SO4. In the case of CdS6Se1  /
/ were also used as electrolyte.
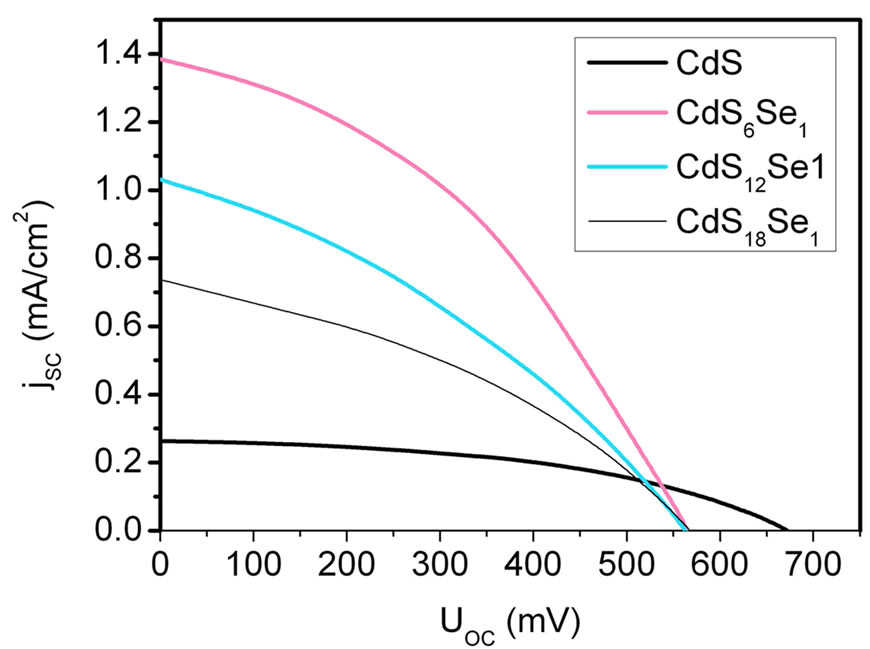
Figure 9. Photocurrent density vs voltage curves for QDSCs based on CdSand CdSxSey-NCs with iodine/iodide electrolyte under irradiation at AM 1.5 simulated solar light (100 mW/cm²).
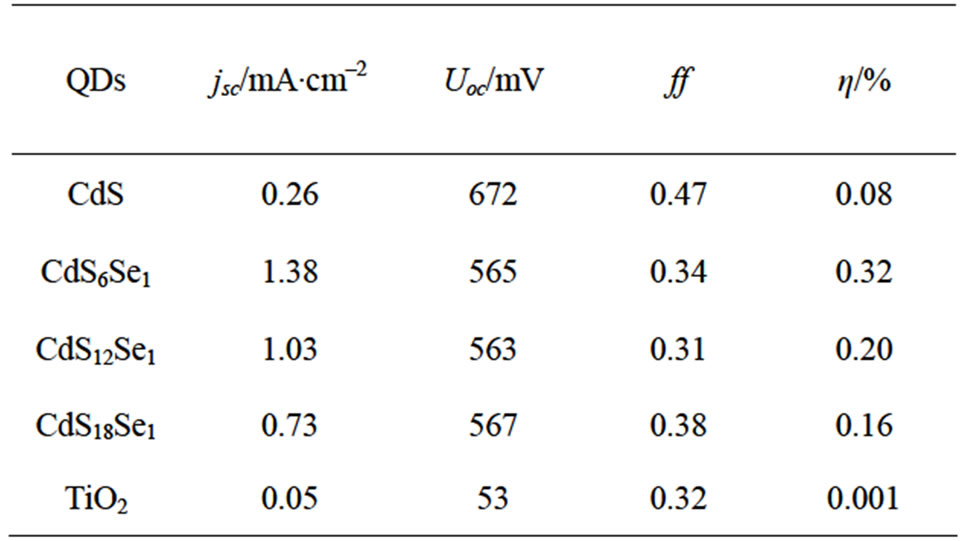
Table 1. Photovoltaic performance of QDSCs based on CdSxSey.
CdSxSey type, which are quite promising. The best results were achieved with CdS6Se1/TiO2 solar cells. These cells show reasonable IPCE values up to 800 nm. However, the overall efficiencies of our QDSCs are quite low in comparison with cells, which were prepared by the linker method. Nevertheless our SMD method is a great alternative for unsolvable sensitizers, which are not suitable for the common techniques.
5. Acknowledgements
The authors gratefully acknowledge Dr. Christian W. Lehmann and his group for the implementation of the TEM measurements at the Max-Planck Institut für Kohlenforschung, Mülheim/Ruhr.
REFERENCES
- B. O’Regan and M. Grätzel, “A Low-Cost, High-Efficiency Solar Cell Based on Dye-Sensitized Colloidal TiO2 Films,” Nature, Vol. 535, No. 6346, 1991, pp. 737-740. doi:10.1038/353737a0
- M. Grätzel, “Photovoltaic and Photoelectrochemical Conversion of Solar Energy,” Philosophical Transactions of the Royal Society a-Mathematical Physical and Engineering Sciences, Vol. 365, No. 1853, 2007, pp. 993-1005. doi:10.1098/rsta.2006.1963
- M. Grätzel, “Conversion of Sunlight to Electric Power by Nanocrystalline Dye-Sensitized Solar Cells,” Journal of Photochemistry and Photobiology A: Chemistry, Vol. 164, No. 1-3, 2004, pp. 3-14. doi:10.1016/j.jphotochem.2004.02.023
- D. B. Kuang, C. Klein, Z. P. Zhang, S. Ito, J. E. Moser, S. M. Zakeeruddin and M. Gratzel, “Stable, High-Efficiency Ionic-Liquid-Based Mesoscopic Dye-Sensitized Solar Cells,” Small, Vol. 3, No. 12, 2007, pp. 2094-2102. doi:10.1002/smll.200700211
- A. Zaban, O. I. Micic, B. A. Gregg and A. J. Nozik, “Photo-Sensitization of Nanoporous TiO2 Electrodes with InP Quantum Dots,” Langmuir, Vol. 14, No. 12, 1998, pp 3153-3156. doi:10.1021/la9713863
- R. Vogel, P. Hoyer and H. Weller, “Quantum-Sized PbS, CdS, Ag2S, Sb2S3, and Bi2S3 Particles as Sensitizers for Various Nanoporous Wide-Bandgap Semiconductors,” Journal of Physical Chemistry B, Vol. 98, No. 12, 1994, pp. 3183-3188. doi:10.1021/j100063a022
- R. Plass, S. Pelet, J. Krueger and M. Grätzel, “Quantum Dot Sensitization of Organic-Inorganic Hybrid Solar Cells,” Journal of Physical Chemistry B, Vol. 106, No. 31, 2002, pp. 7578-7580. doi:10.1021/jp020453l
- L. M. Peter, K. G. U. Wijayantha and J. P. Waggett, “Band-Edge Tuning in Self-Assembled Layers of Bi2S3 Nanoparticles Used to Photosensitize Nanocrystalline TiO2,” Journal of Physical Chemistry B, Vol. 107, No. 33, 2003, pp. 8378-8381. doi:10.1021/jp030334l
- P. Yu, K. Zhu, A. G. Norman, S. Ferrere, A. J. Frank, A. J. Nozik, “Nanocrystalline TiO2 Solar Cells Sensitized with InAs Quantum Dots,” Journal of Physical Chemistry B, Vol. 110, No. 50, 2006, pp. 25451-25454. doi:10.1021/jp064817b
- L. M. Peter, D. J. Riley, E. J. Tull, K. G. U. Wijayantha, “Photosensitization of Nanocrystalline TiO2 by Self-Assembled Layers of CdS Quantum Dots,” Chemical Communication, Vol. 10, 2002, pp. 1030-1031. doi:10.1039/b201661c
- O. Niitsoo, S. K. Sarkar, C. Pejoux, S. Rühle, D. Cahen and G. Hodes, “Chemical Bath Deposited CdS/CdSe- Sensitized Porous TiO2 Solar Cells,” Journal of Photochemistry and Photobiology a-Chemistry, Vol. 181, No. 2-3, 2006, pp. 306-313. doi:10.1016/j.jphotochem.2005.12.012
- I. Robel, V. Subramanian, M. Kuno and P. V. Kamat, “Quantum Dot Solar Cells. Harvesting Light Energy with CdSe Nanocrystals Molecularly Linked to Mesoscopic TiO2 Films,” Journal of the American Chemical Society, Vol. 128, No. 7, 2006, pp. 2385-2393. doi:10.1021/ja056494n
- S. Rühle, M. Shalom and A. Zaban, “Quantum-Dot-Sensitized Solar Cells,” Journal of Chemical Physics and Physical Chemistry, Vol. 11, 2010, pp. 2290-2304. doi:10.1002/cphc.201000069
- W. W. Yu, L. Qu, W. Guo and X. Peng, “Experimental Determination of the Extinction Coefficient of CdTe, CdSe, and CdS Nanocrystals,” Chemistry of Materials, Vol. 15, No. 14, 2003, pp. 2854-2860. doi.:10.1021/cm034081k
- R. D. Schaller, V. M. Agranovich and V. I. Klimov, “High-Efficiency Carrier Multiplication through Direct Photogeneration of Multi-Excitons via Virtual Single- Exciton States,” Nature Physics, Vol. 1, No. 3, 2005, pp. 189-194. doi:10.1038/nphys151
- M. C. Beard, K. P. Knutsen, P. R. Yu, J. M. Luther, Q. Song, W. K. Metzger, R. J. Ellingson and A. J. Nozik, “Multiple Exciton Generation in Colloidal Silicon Nanocrystals,” Nano Letters, Vol. 7, No. 8, 2007, pp. 2506-2512. doi:10.1021/nl071486l
- A. J. Nozik, “Quantum Dot Solar Cells,” Physica E-Low- Dimensional Systems & Nanostructures, Vol. 14, No. 1-2, 2002, pp.115-120. doi:10.1016/S1386-9477(02)00374-0
- V. I. Klimov, “Spectral and Dynamical Properties of Multiexcitons in Semiconductor Nanocrystals,” Annual Review of Physical Chemistry, Vol. 58, No. 1, 2007, pp. 635-673. doi:10.1146/annurev.physchem.58.032806.104537
- K. C. Mandal and O. Savadogo, “Chemically Deposited n-CdSe Thin Film Photo-Electrochemical Cells: Effects of Zn2+-Modification,” Journal of Materials Science, Vol. 27, No. 16, 1992, pp. 4355-4360. doi:10.1007/BF00541566
- Q. Shen, T. Sato, M. Hashimoto, C. C. Chen and T. Toyoda, “Photoacoustic and Photoelectrochemical Characterization of CdSe-Sensitized TiO2 Electrodes Composed of Nanotubes and Nanowires,” Thin Solid Films, Vol. 499, No. 1-2, 2006, pp. 299-305. doi:10.1016/j.tsf.2005.07.019
- N. Fuke, L. B. Hoch, A. Y. Koposov, V. W. Manner, D. J. Werder, A. Fukui, N. Koide, H. Katayama and M. Sykora, “CdSe Quantum-Dot-Sensitized Solar Cell with ~100% Internal Quantum Efficiency,” ACS Nano, Vol. 4, No. 11, 2010, pp. 6377-6386. doi:10.1021/nn101319x
- S. Gimenez, I. Mora-Sero, L. Macor, N. Guijarro, T. Lana-Villareal, R. Gomez, L. J. Diguna, Q. Shen, T. Toyoda and J. Bisquert, “Improving the Performance of Colloidal Quantum-Dot-Sensitized Solar Cells,” Nanotechnolgy, Vol. 20, No. 29, 2009, Article ID: 295304. doi:10.1088/0957-4484/20/29/295204
- J. Chen, J. L. Song, X. W. Sun, W. Q. Deng, C. Y. Jiang, W. Lei, J. H. Huang and R. S. Liu, “An Oleic Acid- Capped CdSe Quantum-Dot Sensitized Solar Cell,” Applied Physics Letters, Vol. 94, No. 15, 2009, Article ID: 153115. doi:10.1063/1.3117221
- H. J. Lee, D. Y. Kim, J. S. Yoo, J. Bang, S. Kim and S. M. Park, “Anchoring Cadmium Chalcogenide Quantum Dots (QDs) onto Stable Oxide Semiconductors for QD Sensitized Solar Cells,” Bulletin of the Korean Chemical Society, Vol. 28, No. 6, 2007, pp. 953-958. doi:10.5012/bkcs.2007.28.6.953
- S. Gorer and G. Hodes, “Quantum Size Effects in the Study of Chemical Solution Deposition Mechanisms of Semiconductor Films,” The Journal of Physical Chemistry, Vol. 98, No. 20, 1994, pp. 5338-5346. doi:10.1021/j100071a026
- Y. Lee and Y.-S. Lo, “Highly Efficient Quantum-Dot- Sensitized Solar Cell Based on Co-Sensitization of CdS/ CdSe,” Advanced Functional Materials, Vol. 19, No. 4, 2009, pp. 604-609. doi:10.1002/adfm.200800940
- T. Toyoda, K. Oshikane, D. Li, Y. Luo, Q. Meng and Q. Shen, “Photoacoustic and Photoelectrochemical Current Spectra of Combined CdS/CdSe Quantum Dots Adsorbed on Nanostructured TiO2 Electrodes, Together with Photovoltaic Characteristics,” Journal of Applied Physics, Vol. 108, 2010, Article ID: 114304. doi:10.1063/1.3517066
- T. Mahalingam, S. Thanikaikarasan, M. Raja, C. Sanjeeviraja, S. Lee, H. Moon, Y. D. Kim and P. J. Sebastian, “Studies on Electrochemically Grown Cd-Fe-Se Thin Films,” Journal of New Materials for Electrochemical Systems, Vol. 10, 2007, pp. 33-37.
- R. Chandramohan, T. Mahalingam, J. P. Chu and P. J. Sebastian, “Preparation and Characterization of Semiconducting Zn1−xCdxSe Thin Films,” Solar Energy Materials and Solar Cells, Vol. 81, 2004, pp. 371-378. doi:10.1016/j.solmat.2003.11.013
- X. Mathew, N. R. Mathews, P. J. Sebastian and C. O. Flores, “Deep Levels in the Band Gap of CdTe Films Electrodeposited from an Acidic Bath—PICTS Analysis,” Solar Energy Materials and Solar Cells, Vol. 81, No. 3, 2004, pp. 397-405. doi:10.1016/j.solmat.2003.11.015
- X. Mathew, G. W. Thompson, V. P. Singh, J. C. McClure, S. Velumani, N. R. Mathews and P. J. Sebastian, “Development of CdTe Thin Films on Flexible Substrates—A Review,” Solar Energy Materials and Solar Cells, Vol. 76, No. 3, 2003, pp. 293-303. doi:10.1016/S0927-0248(02)00281-7
- T. Mahalingam, C. Sanjeeviraja and S. R. Srikumar, “Studies on Electrochemically Deposited CdSe Thin Films,” Bulletin of Electrochemistry, Vol. 12, 1996, pp. 148-150.
- P. Mahawela, G. Sivaraman, S. Jeedigunta, J. Gaduputi, M. Ramalingam, S. Subramanian, S. Vakkalanka, C. S. Ferekides and D. L. Morel, “II–VI Compounds as the Top Absorbers in Tandem Solar Cell Structures,” Materials Science and Engineering B-Solid State Materials for Advanced Technology, Vol. 16, 2005, pp. 283-291. doi:10.1016/j.mseb.2004.05.054
- S. Vakkalanka, C. S. Ferekides, D. L. Morel, “Development of ZnSexTe1−x p-Type Contacts for High Efficiency Tandem Structures,” Thin Solid Films, Vol. 515, No. 15, 2007, pp. 6132-6135. doi:10.1016/j.tsf.2006.12.160
- L. Y. Zeng, S. Y. Dai, W. W. Xu and K. J. Wang, “Dye- Sensitized Solar Cells Based on ZnO Films,” Plasma Science & Technology, Vol. 8, No. 2, 2006, pp. 172-175. doi:org/10.1088/1009-0630/8/2/10
- T. Aramoto, F. Adurodija, Y. Nishiyama, T. Arita, A. Hanafusa, K. Omura and A. Morita, “A New Technique for Large-Area Thin Film CdS/CdTe Solar Cells,” Solar Energy Materials and Solar Cells, Vol. 75, No. 1, 2003, pp. 211-217. doi:10.1016/FS0927-0248(02)00161-7
- H. Uda, H. Sonomura and S. Ikegami, “Screen Printed CdS/CdTe Cells for Visible-Light-Radiation Sensor,” Measurement Science & Technology, Vol. 8, No. 6, 1997, pp. 86-91. doi:10.1088/0957-0233/8/1/012
- A. L. Rogach, A. Kornowski, M. Gao, A. Eychmüller and H. Weller, “Synthesis and Characterization of a Size Series of Extremely Small Thiol-Stabilized CdSe Nanocrystals,” The Journal of Physical Chemistry B, Vol. 103, No. 16, 1999, pp. 3065-3069. doi:10.1021/jp984833b
- G. A. Martínez-Castañón, M. G. Sánchez-Loredo, J. R. Martínez-Mendoza, F. Ruiz, “Synthesis of CdS Nanoparticles: A Simple Method in Aqueous Media,” Azojomo, Vol. 1, 2005, pp. 1-2. doi:10.2240/azojomo00170
- V. G. Kulkarni and P. D. Garn, “Study of the Formation of Cadmium Sulfoselenide,” Thermochimica Acta, Vol. 99, 1986, pp. 33-36. doi:10.1016/0040-6031(86)85262-5
- J. Yu, X. Zhao, J. Du and W. Chen, “Preparation, Microstructure and Photocatalytic Activity of the Porous TiO2 Anatase Coating by Sol-Gel Processing,” Journal of Sol-Gel Science and Technology, Vol. 17, 2000, pp. 163-171. doi:10.1023/A:1008703719929
- S. Barazzouk and S. Hotchandani, “Enhanced Charge Separation in Chlorophyll a Solar Cell by Gold Nanoparticles,” Journal of Applied Physics, Vol. 96, No. 12, 2004, pp. 7744-7746. doi:10.1063/1.1811775
- A. Hagfeldt, G. Boschloo, L. Sun, L. Klo, H. Pettersson, “Dye-Sensitized Solar Cells,” Chemical Reviews, Vol. 101, No. 11, 2010, pp. 6595-6663. doi:10.1021/cr900356p
- E. Raevskaya, A. L. Stroyuk and S. Ya. Kuchmiy, “Preparation of Colloidal CdSe and CdS/CdSe Nanoparticles from Sodium Selenosulfate in Aqueous Polymers Solutions,” Journal of Colloid and Interface Science, Vol. 302, No. 1, 2006, pp. 133-141. doi:10.1016/j.jcis.2006.06.018
Appendix
Figure S1 displays TEM images of the CdSe NCs synthesized as described in the experimental section (route 1). The size distributions and flourescence colours are indicated in the insets of Figure S1.
Figure S2 shows the absorption spectra of the CdSe NCs of different size measured in an aqueous solution.
Samples were taken from the same reaction batch at different reaction times. The particles grew with time, so 1 - 2 nm sized particles are obtained after 1 minute, particles with a size of 30 nm after 2 days. The absorption increases and shifts with larger particles to the red.
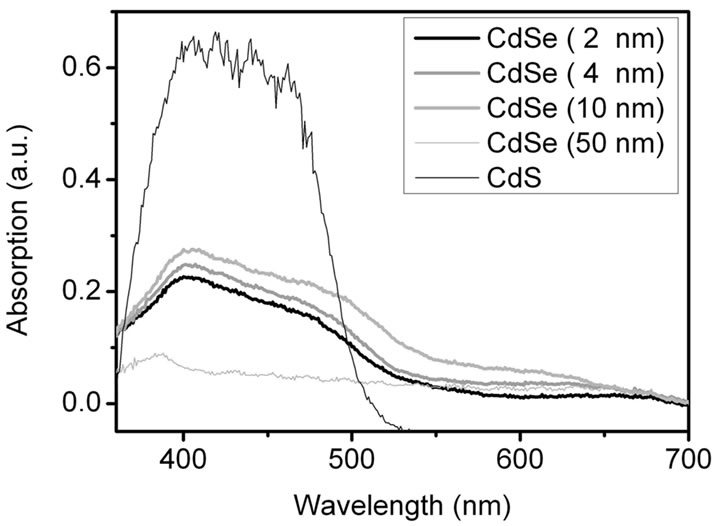
Figures S3(a) and (b) show the absorption spectra of mixtures of CdSe NCs of different sizes with TiO2 on FTO coated glass as obtained by reflection spectroscopy. The absorption of pure TiO2 nanoparticles is already subtracted here. Figure S3(a) exhibits the absorption spectra of the samples before annealing at 500˚C. The CdSe NCs up to a size of 10 nm show a fairly good absorption in the range from 350 to 650 nm. The CdS NCs which were prepared for comparison have a twice as large absorption in the range 350 - 500 nm compared to the CdSe samples. Figure S3(b) shows the situation after annealing at 500˚C and contact with the Na2S/ Na2SO4 electrolyte. All reflection spectra up to a particle size of 10 nm are similar to the CdS spectrum. The emergence of the 400 - 500 nm band demonstrates that a selenide-sulphide exchange had taken place in the smaller CdSe particles. After sintering the TiO2/CdSe sheets was colourless and they change to yellow upon addition of the electrolyte was visible to the naked eye. Presumably SeO2 was formed and evaporated during the annealing at 500˚C. The remaining cadmium ions reacted with the electrolyte to CdS. From these results we expect CdS to be the main TiO2-photosensitizer at >400 nm.
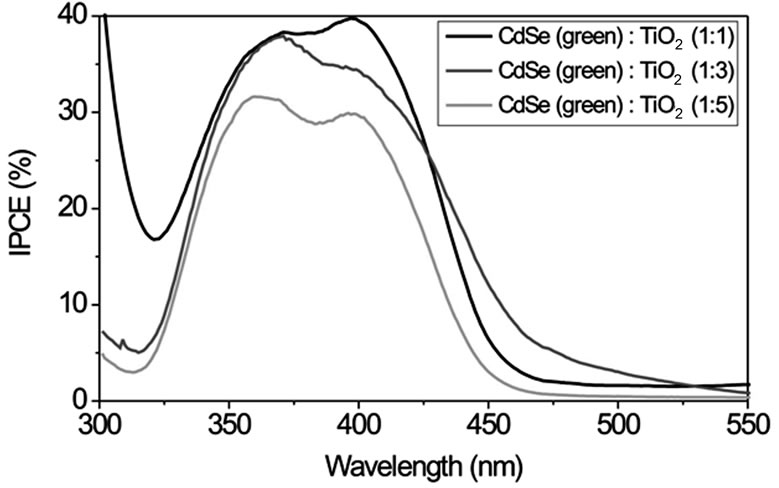
Figure S4 displays IPCE curves with CdSe particles of different size (route 1) in volume ratios of 1:1, 1:3 and 1:5 (CdSe:TiO2) and Na2S/Na2SO4 as redox couple. For smaller particle sizes (green and yellow samples) IPCE increases with increasing volume ratio of NCs while larger particles (orange and red samples) show an opposite behaviour. This can be explained by an easier intercalation of the smaller NCs between the TiO2 nanoparticles. Therefore these particles can be mixed homogeneously in great quantities into the TiO2 using the SMD procedure. Larger NCs do not fit into the free space between the TiO2 particles. In larger quantities they form NC layers which electrically isolate TiO2. The smallest CdSe particles of size 1 - 2 nm in a 1:1 volume ratio with TiO2 exhibit the largest IPCE of about 40% with a photoelectrical sensitivity up to λ ~ 500 nm.
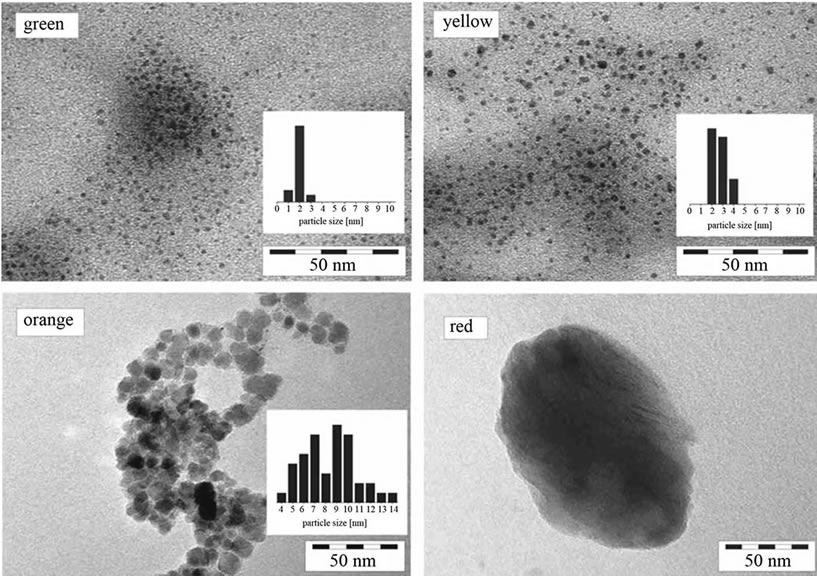
Figure S1. TEM images of CdSe NCs of different size and colour. Their synthesis is described in the experimental section (route 1). The insets indicate the size distribution as obtained from diameter measurements of 20 - 40 particles. Typical size ranges are 1 - 2 nm for the green fluorescing particles, 2 - 4 nm for the yellow, 6 - 12 nm for the orange and 30 - 50 nm for the red fluorescing particles.
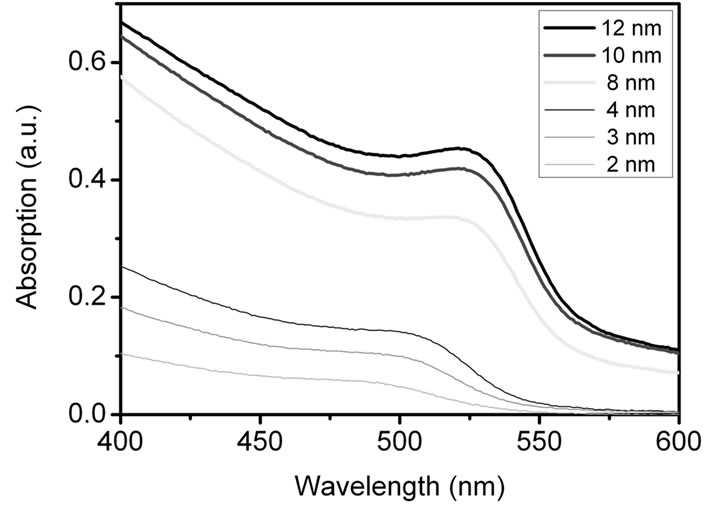
Figure S2. Absorption spectra of CdSe NCs (route 1) of different size measured in solution.
 (a)
(a)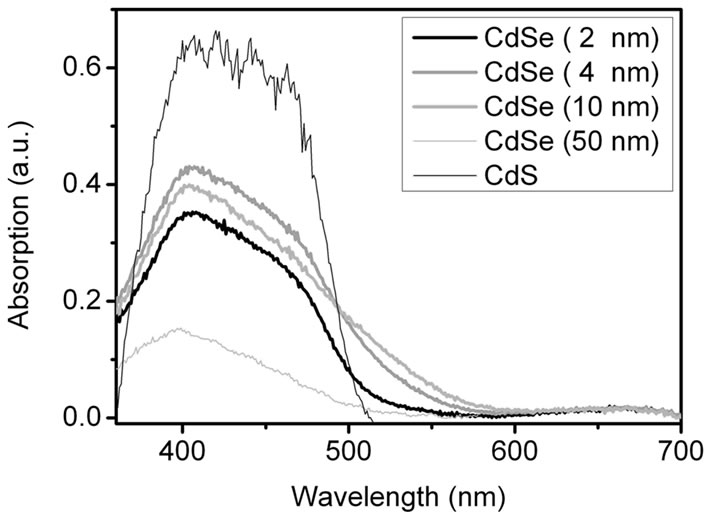 (b)
(b)
Figure S3. Absorption spectra of CdSe NCs (route 1) of different size and CdS NCs measured in reflection (a) before annealing at 500˚C and (b) after annealing at 500˚C and electrolyte (Na2S/Na2SO4) contact. Due to Se2− ↔ S2− exchange CdS is the main absorber in a CdSe/TiO2 sintered mixture with electrolyte contact.
 (a)
(a) 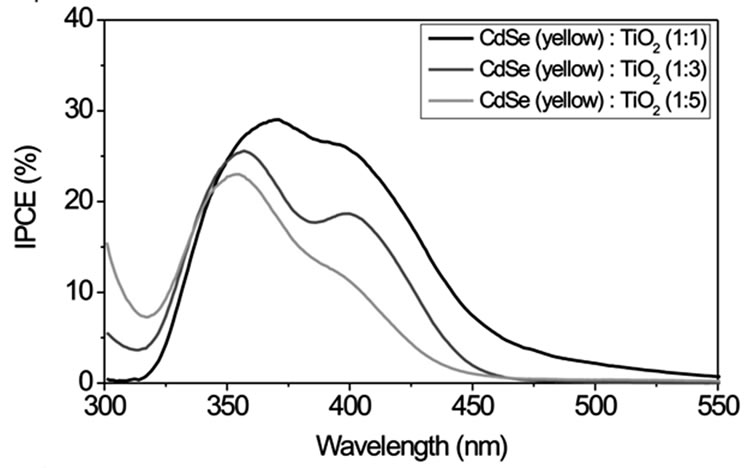 (b)
(b) 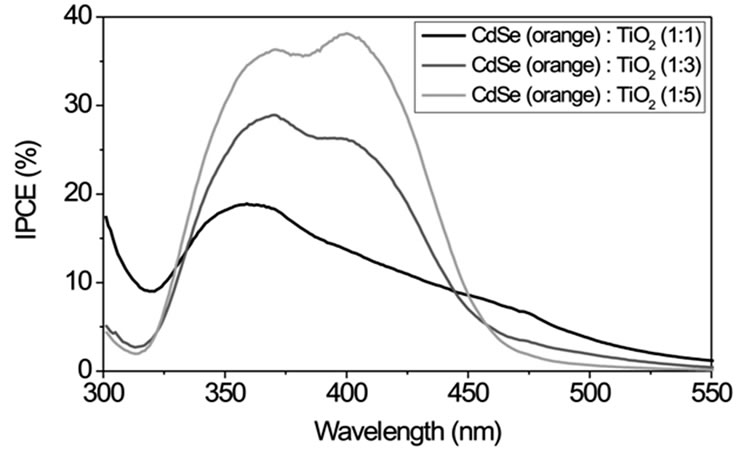 (c)
(c) 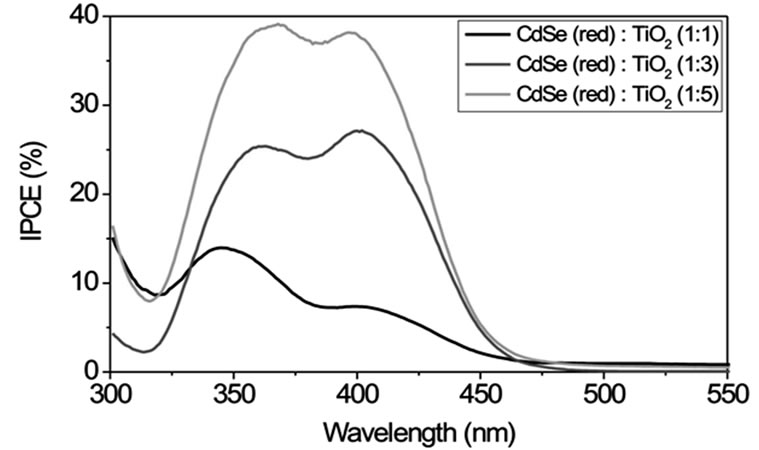 (d)
(d)
Figure S4. Comparison of the incident photon-to-current efficiencies (IPCE) of CdSe solar cells working with Na2S/ Na2SO4 redox couple and CdSe NCs of different size (route 1). NC/TiO2 volume ratios of 1:1, 1:3 and 1:5 were used.
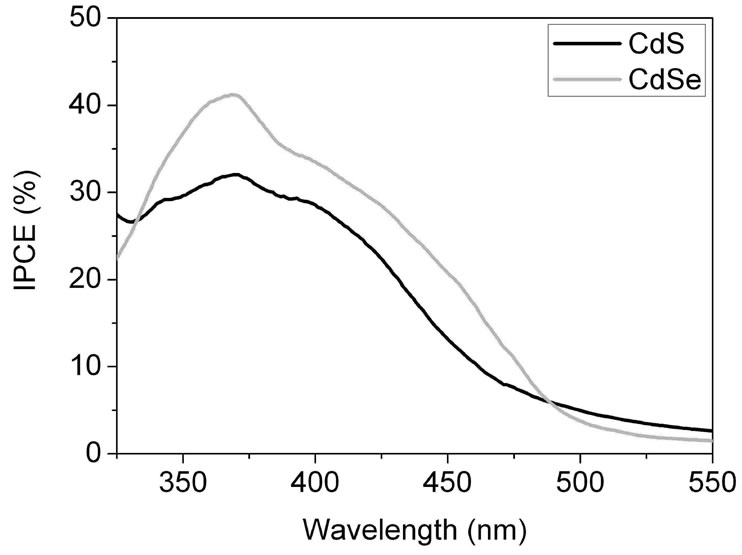
Figure S5. Comparison of the incident photon-to-current conversion efficiencies (IPCE) of CdSe and CdS solar cells working with a Na2S/Na2SO4 redox couple, 1 - 2 nm NCs and 1:1 NC/TiO2 volume ratio. Due to Se2− ↔ S2− exchange CdS is the main sensitizer in a CdSe/TiO2/Na2S, Na2SO4 solar cell fabricated by sintered mixture coating of the photocathode.
In Figure S5 the best IPCE spectrum of the TiO2/ CdSe samples is compared with a TiO2/CdS solar cell. The IPCE spectral developing reflects the wavelength dependence of the CdS absorption in Figure S3(a) pointing again to CdS Se2– ↔ S2– exchange and CdS as main sensitizer in a CdSe/TiO2/Na2S, Na2SO4 solar cell fabricated by sintered mixture coating. Synthesis of CdSe QDs via route 1 is therefore not suitable for SMD and we used route 2 synthesis for further work, see paper.
NOTES
*Corresponding author.