Optics and Photonics Journal
Vol.3 No.6A(2013), Article ID:38552,7 pages DOI:10.4236/opj.2013.36A007
Carbon Nanotubes/Metal Nanoparticle Based Nanocomposites: Improvements in Visible Photoluminescence Emission and Hydrophobicity
1Physics Department, University of Calabria, Rende (cs), Italy
2Biology, Ecolgy and Earth Science Department, University of Calabria, Rende (cs), Italy
Email: *marianna.barberio@fis.unical.it.
Copyright © 2013 M. Barberio et al. This is an open access article distributed under the Creative Commons Attribution License, which permits unrestricted use, distribution, and reproduction in any medium, provided the original work is properly cited.
Received June 8, 2013; revised July 11, 2013; accepted August 27, 2013
Keywords: Metal Nanoparticle; Carbon Nanotube; Nanocomposite; Laser Ablation; Photoluminescence
ABSTRACT
In this work, we present a study of growth and characterization of nanocomposites, based on multiwalled carbon nanotubes and metal nanoparticles (Al, Ag, Au, Co, Cu, Fe, Ni and Ti). We observe a very different behavior between noble and transitions metals. All the nanocomposites are characterized by a network of carbon nanotubes with randomly insertion of spherical metal particles with dimensions of about 100 nm (clearly visible in SEM images). In particular, in transition metal nanocomposites, each tube on sheet surface is covered by particles of about 40 - 50 nm and for all metals the XPS measurements indicate the absence of chemical bonds and the simply physisorption of nanoparticle on carbon nanotube buckypaper. Furthermore, the nanocomposites show very different properties respect to pure carbon nanotubes: they are hydrophobic, their roughness is about 50% smaller than carbon nanotube and they exhibit a strong visible photoluminescence, which is absent in pure nanotube.
1. Introduction
The strategy to incorporate in a single matrix two different nanostructures with specific properties is a versatile method to transfer and to integrate in a single material the different properties of two materials, enabling to realize multifunctional composites, for using in advanced applications like catalysis, energy storage, nanobiotecnology, optoelectronics, etc. [1-3].
In particular, a widely used approach is given by the combination of carbon nanotubes (in both configuration multi walled and single walled) and metals, semiconductors or insulators [4-6]. In effect, carbon nanotubes (CNT) are one of the most attractive nanomaterials because their unique physicochemical properties and wide potential applications in nanoelectronics [4], nanolithography [5] and photovoltaic [6]. Two approaches are commonly used to decorate CNT with organic and inorganic compounds: covalent and non covalent bonds formation [4-8]. The first, include mainly oxidation and formation of amide bonds [7], while non covalent approaches utilize van der Waals interactions between functional compounds and CNT [8]. Recently, non covalent approach has attracted more attention because permit to obtain nanocomposites with new properties, preserving all the properties of the nanotubes [9].
The combination between CNT and metal nanoparticles is much interesting because metal exhibits very important optical and electronic properties that can be improved by the mix with CNT [1,10,11]. In particular metal, decorated CNT (as example Ag/CNT composites) have gained extensive attention due to their potential applications as catalyst [12], optical limiters [13], advanced materials [14], etc.
The possibility to obtain composites with large visible photoluminescence for optoelectronic devices becomes particularly interesting. The study of optical properties of CNT based heterostructures in this framework assume considerable importance to try improve the luminescence properties of carbon nanotubes in the visible range (pure carbon nanotube not exhibit visible luminescence emission). For this purpose, our group carried out different studies on cathode-luminescence and photo-luminescence emission from CNT macroscopic samples [15-18]. We observed a luminescence signal in the visible region and showed that such emissions are extrinsic to nanotube structures. In fact, it originates from impurities (Ni, Al, Zn, gases) which are residual of materials used in the growing process or subsequently adsorbed in the sample [15-17]. While for the heterostructures samples growth with carbon nanotubes and insulators or semiconductors component (indicated by X component) shows a strong luminescence signal centered in visible [19-22] or UV [19] region. Here, we demonstrate the possibility to growth nanocomposites heterostructures based on carbon nanotubes and metal (transition or noble) nanoparticles which exhibits a luminescence emission in all visible region.
There are several methods of preparing metal/CNT materials including vapor depositions, surface chemical reduction and gamma irradiation [11]. However, all these methods cannot get satisfactory results because, in most cases, the metal nanoparticles can form micro—agglomerates that cause problems in samples homogeneity.
For this reason, we used a simple method to produce metal/CNT composites. The method is a sequence of mixing, evaporation and drying processes that lead to the formation of composites where a uniform network of metal nanoparticles is weaved on a CNT matrix. The metal nanoparticles are produced from pure metal by laser ablation. We use both noble (Au and Ag) and transition (Al, Co, Cu, Fe, Ni, Ti) metals to investigate the different interaction between tube and metals and the possible formation of chemical or van deer Waals interaction between tube and nanoparticles. The obtained nanocomposites were characterized by SEM and AFM microscopy, X-ray photoelectron spectroscopy and by measurements of contact angle and surface roughness. Moreover photoluminescence measurements demonstrate the realization of materials with luminescence emission in all visible region the entire journals, and not as an independent document. Please do not revise any of the current designations.
2. Materials and Methods
2.1. Materials
The MWCNTs buckypaper sample was purchased from Nanolab Co., with a nominal purity greater than 95%, a diameter of about 30 nm, and a length of 5 - 20 MWCNT is showed in Figure 1(a)). The sheet used for nanocomposites growth had a thickness of 0.1 mm and its dimension was 10 × 10 mm2.
Metal nanoparticles were produced by laser ablation (LA) of a metal plate in acetone (aqueous solution 99.5%). The metal plate (>99.99%) was vertically placed in a glass vessel filled with a 25 ml of acetone and irradiated for several minutes by the first harmonic (1064 nm) of a Quanta-Giant series 710 Nd:YAG laser operating at 10 Hz. The spot size of the laser beam on the surface of the metal plate is about 7 - 8 mm and the power of laser is fixed at 600 mJ/pulse. During irradiation of the laser beam, the solution, initially transparent, gradually turns
 (a)
(a)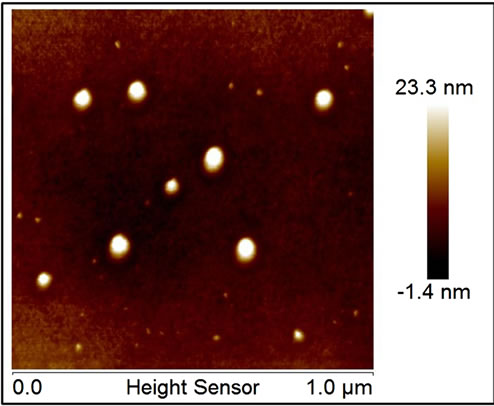 (b)
(b) (c)
(c)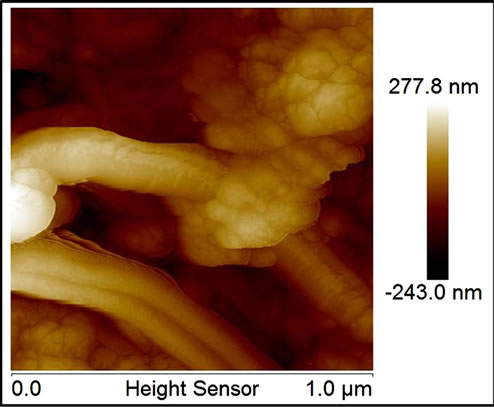 (d)
(d)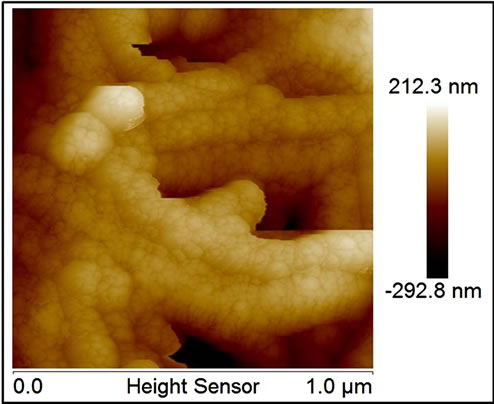 (e)
(e)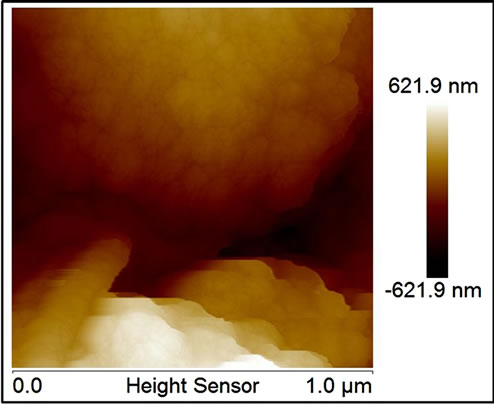 (f)
(f)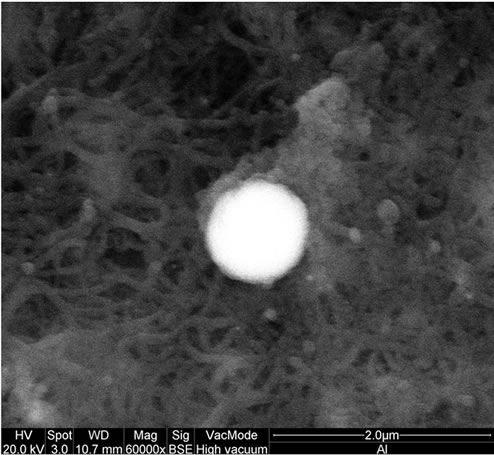 (g)
(g)
Figure 1. AFM images of (a) pure MWCNT; (b) pure nanoparticle deposed on a pure copper surface. SE-SEM; (c) and BSE-SEM (d) Al/MWNT nanocomposites as example of all transition metals nanocomposites. AFM images of silver/MWNT nanocomposites.
colored, indicating the formation of nanoparticles in solution [15]. After LA, the solution is sonicated for 30 minutes to prevent the self aggregation of the nanoparticles suspended in acetone and the formation of macrocluster. When the solution is sonicated immediately after laser ablation the dimensions of the deposited particles are identical to those produced in solution during LA (about 40 nm). In fact, the particle dimensions during LA were controlled monitoring the optical absorbance following the Kelly plasmonic theory [23] and subsequently verified by SEM and AFM microscopy (a drop of nanoparticles solution was deposed on a pure copper sheet (pure NP sample) and observed by microscopes). Figure 1(b) (AFM images) shows, as example, aluminum nanoparticles deposed on copper foil, the particles have dimensions of 40 nm and are perfectly diluted and dispersed on substrate without sign of aggregation.
Metal nanoparticles—carbon nanotubes composites (MNP/MWNT) were obtained positioning the MWCNT sheet in the vessel glass containing the solution after sonication, then the solution was heated up to complete solvent evaporation on a hot plate at 180˚C.
2.2. Methods
The transmitted spectrum, during LA, was obtained by a Horiba VS-140 VIS-NIR spectrometer working in the 350 - 1200 nm range. A white led has been used as light source to enlighten the samples (the vessel glass surface is completely transparent to white light). Transmittance (t (l)) and absorbance (a(l)) as function of wavelength are obtained with the well known relations:
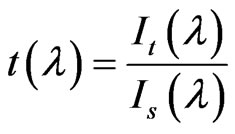 .
.
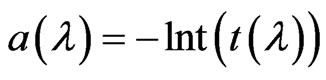
where It is the intensity of light transmitted across the solution and the Is is the intensity of light source.
The transmitted spectrum was monitored during the whole laser ablation process, taking spectra at regular intervals of 5 seconds. The integrated absorbance A(t) of each spectral transition was obtained by numerical integration, assuming a Gaussian distribution of the spectral bands.
Morphologic information of our composites has been obtained by both SEM and AFM microscopy. The SEM images were performed using a Cambridge Stereoscan SEM and taken by a 20 keV electron beam and a current of 3.4 mA, having a spot size of about 1 micron and working in either Secondary Electron acquisition mode (SE-SEM) and Back Scattering acquisition mode (BSE-SEM). AFM images were taken by a bruker AFM microscope (ICON Bruker) working in tapping mode.
Chemical and optical information on composites was obtained by Photoluminescence spectroscopy (PL), X-ray photoelectron spectroscopy (XPS), contact angle and roughness measurements.
Photoluminescence (PL) measurements were taken by an Olympus microscope (Horiba-Jobyn Yvon) mounting objectives of 10×, 50× and 100× magnifications. The microscope is equipped by a 375 nm-laser source with a power of 15 mW and by a Triax 320 (Horiba-Jobyn-Yvon) spectrometer working in the 200 - 1500 nm range.
XPS measurements, taken on the pure NP sample (drop deposed on Cu), were conducted in a UHV chamber equipped for standard surface analysis with a pressure in the range of 10−9 torr. Non monochromatic Mg-Ka X-ray (hn = 1253.64 eV) was used as excitation source. The XPS spectra were calibrated with the C1s peak of a pure carbon sample (energy position 284.6 eV). All XPS spectra have been corrected for analyzer transmission and the background has been subtracted using the straight line subtraction mode. Moreover the XPS data were fitted assuming a Gaussian distribution.
The contact angle images was obtained placing a small drop of distilled water (5 ml) on the sample surface and the equilibrium contact angle was determined by drop shape analysis, while sample roughness was measured under AFM conditions.
3. Results and Discussion
Conventionally metal nanoparticles are characterized by their extinction spectra (absorption and/or scattering spectra) [23]. The peaks observed in absorption or scattering spectra of particles under light excitation reveal resonant wavelengths of plasmon eigenmodes (called dipole plasmon resonance) of the particles as demonstrated in [23]. Secondary oscillations, called quadrupole plasmon resonances, appear at lower energy for larger particles [23 and references therein]. The plasmon oscillation frequency is determined by four factors: the density of electrons, the effective electron masses and size and shape of charge distribution (i.e. by shape and size of nanoparticles) [23].
We take the absorbance spectrum of acetone-nanoparticles solution during LA at regular time intervals of 5 seconds and observe the changes in its intensity and line shape for 700 seconds. Figure 2 shows the absorbance spectra acquired after 500 s of irradiation (as an example of typical measured spectra) for all used metals. We observe that all nanoparticles exhibit three bands, with center and Full Width at Half Maximum (FWHM) depending on particles chemical nature and dimensions. The three bands are centered, for all metals, in the region of 300 - 500 nm (P1 bands), 500 - 700 nm (P2 bands) and 930 nm (P3 bands). During the first 100 seconds, the
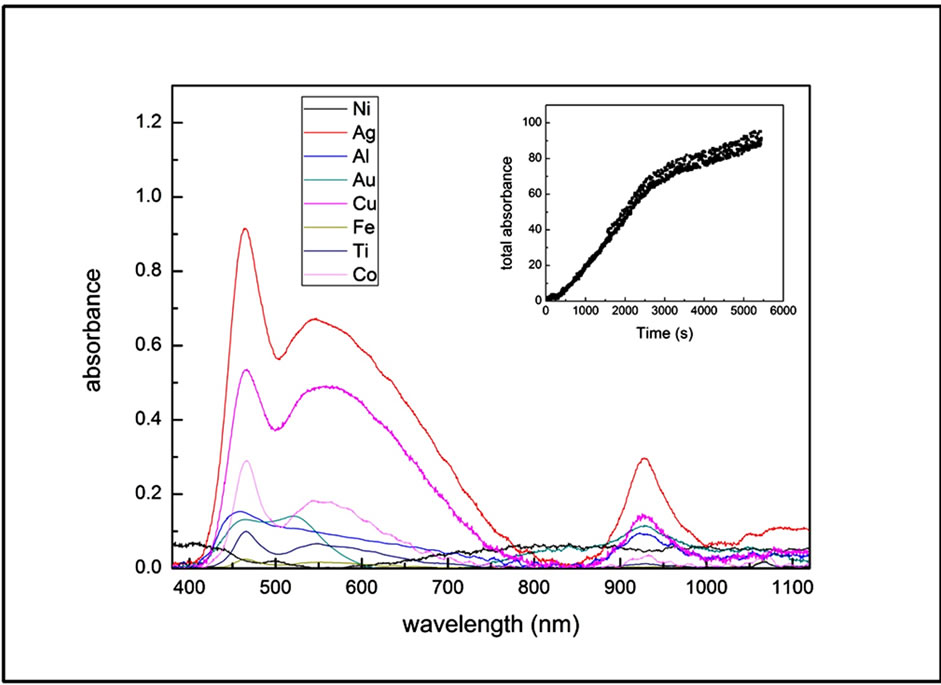
Figure 2. Absorbance spectra of nanoparticles/acetone solutions taken during laser ablation (500 s from LA starting). Inset: total absorbance as function of irradiation time for Al/MWCNT as example for all nanocomposites.
spectra, for all metals, exhibits only the P1 band and P3 with a FWHM of about 30 nm and 60 nm respectively while after the first 100 seconds the P2 band appears. The center and the FWHM of three bands are substantially unchanged during LA, while their intensities increase causing a rapidly increase of total absorption, which, after the first 150 s, is almost linear with LA time (see the Inset in Figure 2).
All the three bands can be associated to oscillating of surface plasmon in spherical or spheroid nanoparticles. Kelly et al. in their theoretical work [23] calculated, for silver nanoparticles, the plasmon absorption wavelength for both spherical and spheroid nanoparticles as function of particles dimensions. They demonstrated that spherical particles present two absorption bands centered at about 350 nm (dipole resonance) and at 440 - 450 nm (quadrupole resonance) for particles with dimensions of 60 nm. These positions change strongly with particles dimensions and shape. If the sphere diameter increases the bands red-shift and can reach the NIR region if the particles are large spheroids.
So, our absorption spectra (with three resonance bands) can be interpreted as superposition of signals from particles of different sizes in solution. In the first 100 seconds, LA produces spherical particles with low dimensions which generate the P1 resonance. The dimensions of these particles, from the comparison with numerical data in [23], range between 50 - 70 nm. Moreover, in the first phases, a little amount of spheroid particles are also present (P3 resonance). After the first 100 seconds, the particle concentration in solutions increases and several nanoparticles aggregates to form spherical particles with larger dimensions causing the P2 band appearance. As the LA time increases, several particles aggregate forming larger spheres (shift of both P1 and P2), while spheroid particles increase their concentration without changing size. SEM and AFM images of nanoparticles (produced in the first 100 s of LA) deposed on a pure copper surface confirm the prevision obtained by Kelly theories. Figure 1(b) shows an AFM images of nanoparticles with dimensions of 50 - 60 nm while SEM images shows also the presence of bigger particles (100 nm in diameter) also visible in SEM images of composites in Figure 1.
All MNP/MWNT composites at SEM images, at zoom level of then of microns, appears as a bulk of carbon nanotubes with random insertions of metal nanoparticles of dimensions of about 100 - 150 nm, as visible in SE-SEM and BSE-SEM of Figure 1(c) and (d) (the figure shows the images for Al/MWCNT as example for all composites). While details, taken by AFM (at zoom level of 500 nm), show a very different situation for noble and transitions metals. Transitions metal nanoparticle, as visible in fig. Figure 1(e) and (f) (for Co as example for all transition metals), are arranged either to form bigger particles (as visible in SEM images) or to cover the single tubes with little particles of 40 - 50 nm indicating the formation of a strictly bond between tubes and particles which don’t correspond to a simple MWCNT doping but at a growth of new materials. Noble metal particles, besides, show only the formation of bigger particles (Figure 1(g) for silver) randomly distributed on a sheet surface indicating a simple doping mechanism without new materials formation.
Moreover, for all samples, XPS data (not showed) indicate the absence of chemical bonds between carbon nanotubes and metals specifying the van deer Waals nature of bonding between particle and tubes and the phsysorption character of particle absorption on sheet surface. In fact, the survey spectra indicated in all sample the only presence of Carbon, Oxygen (carbon nanotubes are rich in oxygen which can be eliminate only after heating at very high temperatures [24]) and metal particles without presence of surface impurities. The main XPS lines for all elements, showed in Table 1, are these typical of carbon nanotubes (the C1s line exhibits three line at 284 eV (C main line), 287 eV (C-O bonds) and 303 eV which is due to plasma loss in carbon nantubes) and of used metals, all the metals exhibits the main atomic lines [25] without chemical shifts related to formation of chemical bonds between metal and C or O (excluding so also the presence of metal oxide formation). The elements percentage evaluated by XPS data (see Table 1) indicates very different behavior for different metals indicating a great presence on surface only for Al, Cu and Au. Absorbance spectra for these three elements indicate a greater presence of bigger particles (P2 band most intense respect those of other elements) which cannot intercalate in the sheet (covering the tubes in secondary layers) staying on surface.
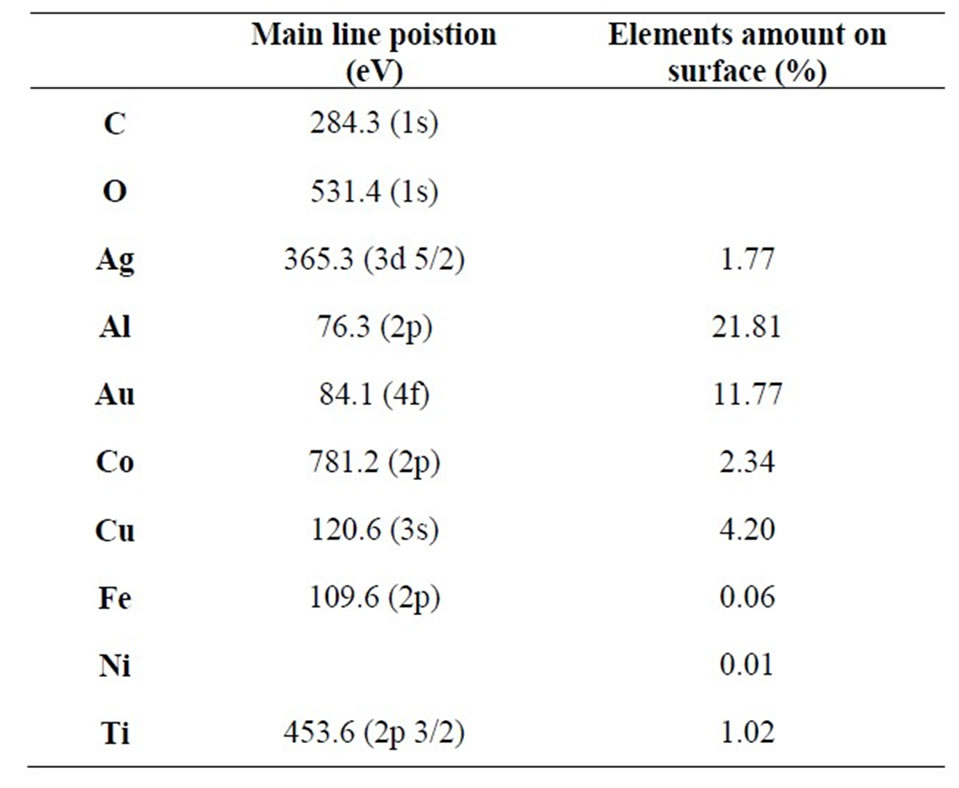
Table 1. XPS main line position for each element in composites (C 1s and O 1s are indicated for pure MWNT) and metal percentage on nanocomposites surface evaluated from XPS data.
The substantial changes on sample surfaces, observed in AFM images, are confirmed also by measurements of contact angle (Figure 3) and roughness, both showed in Table 2. These indicate, in all cases, a great improvement respect to pure MWCNT sheet. The composites are, in fact, hydrophobic with contact angle varying from about 40˚ for Cu to 77˚ for Ag and Ti, and exhibit a decreases in roughness of about 50%. Only for silver particles the roughness decreases is limited to 30%, confirming the different behavior of these metal observed in sample images.
Photoluminescence measurements indicate the comparison of a strong visible luminescence for all composites with a great effectiveness for samples obtained with copper; gold and titanium (see Figure 4). All the PL spectra (except Ag and Al whose intensity is too low to allow analysis Gaussian) present two main bands centered at about 2.2 eV and 2 eV (see Table 3 and inset in Figure 4 for Gaussian analysis) indicated that the interaction between tubes and metal nanoparticles causes changes in CNT electronics bands reducing the optical bands and favoring the visible transitions absent in pure CNT. We have already demonstrated in our previous work [22] the effectiveness in optical changes for metal doping of CNT, now we can confirm that and extend the results to transitions metals indicating, moreover, the formation of composites with hydrophobic properties and roughness reduced compared to pure carbon nanotubes.
4. Conclusions
In this work, we show the possibility to obtain new nanocomposites by carbon nanotubes and transition metal nanoparticles. The nanoparticles, obtained by laser abla-
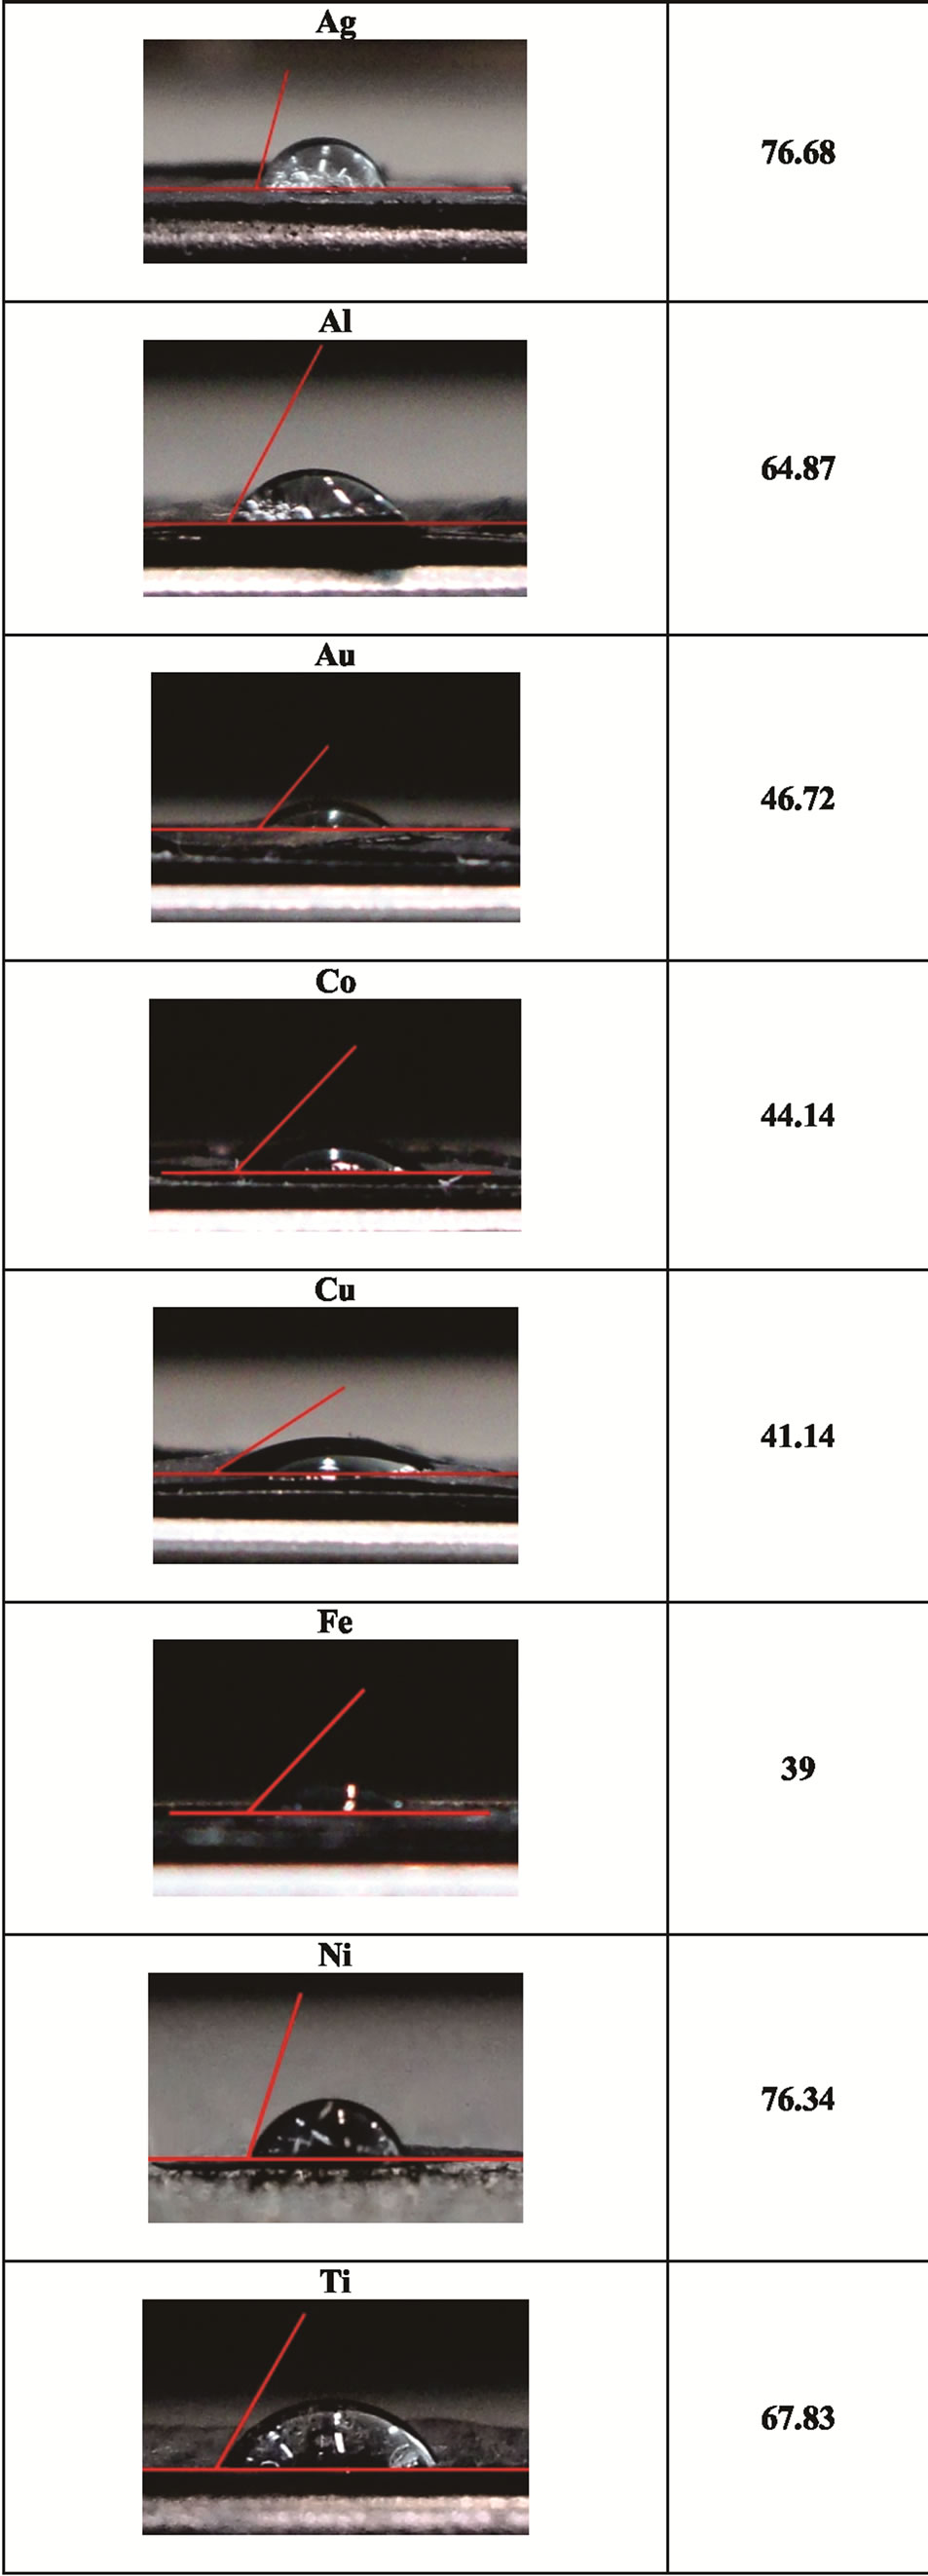
Figure 3. Contact angles for all nanocomposites.
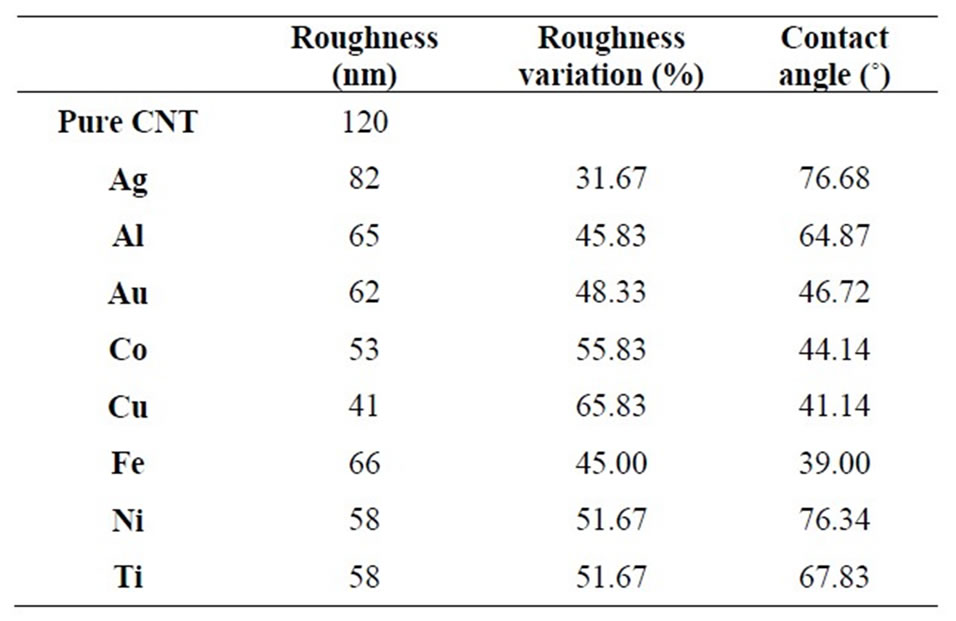
Table 2. Roughness and contact angle for nanocomposites (each nanocomposite is identified by its metal nanoparticle).

Figure 4. Photoluminescence spectra for all nanocomposites. Inset: example of Gaussian analysis.
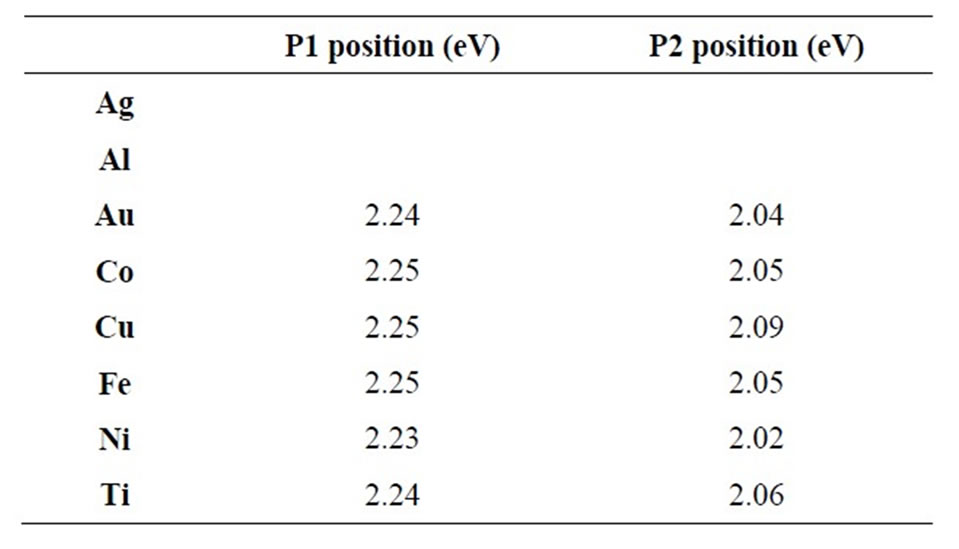
Table 3. PL peach position for each nanocomposites (each nanocomposite is identified by its metal nanoparticle—for Ag and Au the signal is too less for Gaussian analysis).
tion, are been physisorbed on multiwalled carbon nanotubes sheet in acetone solution. The AFM and SEM images of nanocomposites show a network of carbon nanotubes where each tube is completely covered by nanoparticle with dimensions of about 40 - 50 nm, while bigger particle (about 100 nm) is randomly dispersed on sheet surface. Noble metals show a different behavior, the nano-particle is aggregated in sphere with diameter of 100 nm dispersed on a sheet but the single tubes are not covered by nanoparticle indicating only a CNT doping.
The obtained nanocomposites show very different electronical and optical properties respect to pure carbon nanotubes. They are hydrophobic while CNT are hydrophilic, exhibit a strong visible photoluminescence which is completely quenched in carbon nanotubes and shows a decrease on surface roughness of about 50%. Besides, many efforts are necessary to understand the different behavior of transition and noble metals.
5. Acknowledgements
This work has been funded from the European project PON01_02140 “COMAS”. We thank Dr. Mariano Davoli of DiBEST Department, University of Calabria, for SEM images.
REFERENCES
- E. Fortunati, F. D’angelo, S. Martino, A. Orlacchio, J. M. Kenny and I. Armetnano, “Carbon Nanotubes and Silver Nanoparticles for Multifunctional Conductive Biopolymer Composites,” Carbon, Vol. 49, No. 7, 2011, pp. 2370-2379. http://dx.doi.org/10.1016/j.carbon.2011.02.004
- G. D. Liang and S. C. Tjong, “Microstructure and Properties of Polypropylene Composites Filled with Silver and Carbon Nanotube nanoparticles Prepared by Melt-Compounding,” Materials Science and Engineering: B, Vol. 142, No. 2-3, 2007, pp. 55-61. http://dx.doi.org/10.1016/j.mseb.2007.06.028
- P. C. Ma, B. Z. Tang and J. Kim, “Effect of CNT Decoration with Silver Nanoparticles on Electrical Conductivity of CNT-Polymer Composites,” Carbon, Vol. 46, No. 11, 2008, pp. 1497-1505. http://dx.doi.org/10.1016/j.carbon.2008.06.048
- J. Sandler, M. S. P. Shaffer, T. Prasse, W. Bauhofer, K. Schulte and A. Windle, “Development of a Dispersion Process for Carbon Nanotubes in an Epoxy Matrix and the Resulting Electrical Properties,” Polymer, Vol. 40, No. 21, 1999, pp. 5967-5971. http://dx.doi.org/10.1016/S0032-3861(99)00166-4
- L. B. D. Silva, S. B. Fagan and R. Mota, “Ab Initio Study of Deformed Carbon Nanotube Sensors for Carbon Monoxide Molecules,” Nano Letters, Vol. 4, No. 1, 2004, pp. 65-67. http://dx.doi.org/10.1021/nl034873d
- D. M.Guldi, G. M. A. Rahman, M. Prato, N. J. Jux, S. Qin and W. Ford, “Single-Wall Carbon Nanotubes as Integrative Building Blocks for Solar-Energy Conversion,” General & Introductory Chemistry, Vol. 44, No. 13, 2005, pp. 2015-2018 http://dx.doi.org/10.1002/anie.200462416
- H. C. Choi, M. Shim, S. Bangsaruntip and H. Dai, “Spontaneous Reduction of Metal Ions on the Sidewalls of Carbon Nanotubes,” Journal of the American Chemical Society, Vol. 124, No. 31, 2002, pp. 9058-9059. http://dx.doi.org/10.1021/ja026824t
- J. Chen, H. Liu, W. A. Weimer, M. D. Halls, D. H. Waldeck and G. C. Walker, “Noncovalent Engineering of Carbon Nanotube Surfaces by Rigid, Functional Conjugated Polymers,” Journal of the American Chemical Society, Vol. 124, No. 31, 2002, pp. 9034-9035. http://dx.doi.org/10.1021/ja026104m
- J. Du, L. Fu, B. Han, Z. li, Y. Liu, Z. Sun and D. Zhu, “Facile Route to Synthesize Multiwalled Carbon Nanotube/Zinc Sulfide Heterostructures: Optical and Electrical Properties,” The Journal of Physical Chemistry B, Vol. 109, No. 26, 2005, pp. 12772-12776. http://dx.doi.org/10.1021/jp051284i
- R. Sepahvand, M. Adeli, B. Astinchap and R. Kabiri, “New Nanocomposites Containing Metal Nanoparticles, Carbon Nanotube and Polymer,” Journal of Nanoparticle Research, Vol. 10, No. 8, 2008, pp. 1309-1318. http://dx.doi.org/10.1007/s11051-008-9411-2
- F. Xin and L. Li, Composites: Part A, Vol. 42, 2011, p. 961.
- D. J. Guo and H. L. Li, Carbon, Vol. 43, 2005, p. 1259.
- K. C. Chin, A. Gohel, W. Z. Chen, H. I. Elim, W. Ji, G. L. Chong, C. H. Sow and A. T. S. Wee, “Gold and Silver Coated Carbon Nanotubes: An Improved Broad-Band Optical Limiter,” Chemical Physics Letters, Vol. 409, No. 1-3, 2005, pp. 85-88. http://dx.doi.org/10.1016/j.cplett.2005.04.092
- H. P. Wu, X. J. Wu, M. Y. Ge, G. Q. Zhang, Y. W. Wang and J. Jiang, “Properties Investigation on Isotropical Conductive Adhesives Filled with Silver Coated Carbon Nanotubes,” Composites Science and Technology, Vol. 67, No. 6, 2007, pp. 1182-1186. http://dx.doi.org/10.1016/j.compscitech.2006.05.010
- M. Barberio, P. Barone, A. Bonanno, M. Camarca, A. Oliva,V. Pingitore and F. Xu, “Visible Cathodoluminescence from Carbon Nanotubes: The Role of Impurities,” Physica Status Solidi A, Vol. 205, No. 6, 2008, pp. 1391- 1393. http://dx.doi.org/10.1002/pssa.200778109
- M. Barberio, P. Barone, A. Bonanno, M. Camarca, A. Oliva and F. Xu, “Thermoand Iono-Luminescence on MWCNT Bundles,” Radiation Physics and Chemistry, Vol. 76, No. 3, 2007, pp. 492-494. http://dx.doi.org/10.1016/j.radphyschem.2005.11.034
- M. Barberio, D. Barca, P. Barone, V. Pingitore and A. Bonanno, “Cathode-Luminescence from Extrinsic Impurities in Bundles of Carbon Nanotubes: A Possible Role,” Journal of Nanoscience and Nanotechnology, Vol. 11, No. 10, 2011, pp. 9196-9201. http://dx.doi.org/10.1166/jnn.2011.4280
- M. Barberio, P. Barone, V. Pingitore and A. Bonanno, Super Lattice and Microstructures, Vol. 11, 2011, in Press.
- R. Plugaru, “Optical Properties of Nanocrystalline Titanium Oxide,” Thin Solid Films, Vol. 516, No. 22, 2008, pp. 8179-8183. http://dx.doi.org/10.1016/j.tsf.2008.04.039
- F. Gu, C. Li, S. Wang, “Solution—Chemical Synthesis of Carbon Nanotube/ZnS Nanoparticle Core/Shell Heterostructures,” Journal of Luminescence,” Inorganic Chemistry, Vol. 46, No. 13, 2007, pp. 5343-5348. http://dx.doi.org/10.1021/ic7004858
- R. M. Montereali, “Green-Red Photoluminescence from Colored LiF Films for Integrated Active Devices,” Vol. 72-74, 1997, pp. 4-6. http://dx.doi.org/10.1016/S0022-2313(96)00329-8
- M. Barberio, P. Barone, V. Pingitore, A. Bonanno, F. Xu, “Photoluminescence from Silver/Carbon Nanotubes Composites,” Superlattice and Microstructures, Vol. 57, 2013, pp. 129-138. http://dx.doi.org/10.1016/j.spmi.2013.02.004
- K. L. Kelly, E. Coronado, L. L. Zhao and G. C. Schatz, “The Optical Properties of Metal Nanoparticles: The Influence of Size, Shape, and Dielectric Environment,” The Journal of Physical Chemistry B, Vol. 107, No. 3, 2003, pp. 668-677. http://dx.doi.org/10.1021/jp026731y
- M. Barberio, P. Barone, V. Pingitore and A. Bonanno, “Optical Properties of TiO2 Anatase—Carbon Nanotubes Composites Studied by Cathodoluminescence Spectroscopy,” Superlattice and Microstructure, Vol. 51, No. 1, 2012, pp. 177-183. http://dx.doi.org/10.1016/j.spmi.2011.11.011
- NIST XPS data base, 2012. http://srdata.nist.gov/xps/selEnergyType.aspx
NOTES
*Corresponding author.