Optics and Photonics Journal
Vol. 3 No. 2 (2013) , Article ID: 32729 , 6 pages DOI:10.4236/opj.2013.32029
Variation of Trapping Strength with Size and Number of Particles in a Single Trap
1Department of Physics, University College of Science, Mohan Lal Sukhadia University, Udaipur, India
2Birla Institute of Technology & Science, Pilani - K K Birla Goa Campus, Goa, India
3Indian Institute of Technology, Guwahati, India
4Theoretical Physics Division, Physical Research Laboratory, Ahmedabad, India
Email: *jitendrabhattprl@gmail.com
Copyright © 2013 Jitendra Bhatt et al. This is an open access article distributed under the Creative Commons Attribution License, which permits unrestricted use, distribution, and reproduction in any medium, provided the original work is properly cited.
Received December 30, 2012; revised March 6, 2013; accepted March 15, 2013
Keywords: Optical Tweezers; Multiple Particles; Trapping Strength
ABSTRACT
Optical tweezers use the radiation pressure to trap and manipulate the microscopic particles. Using various algorithms multiple traps are being formed which can trap a number of particles simultaneously. In contrast to multiple traps, many particles can be trapped at a single trap position. It is known that when two or more particles are trapped in a single trap they align themselves in axial direction and it appears as if only one particle is trapped. We present a study of the dependence of the optical trapping force on the number of particles in a single trap using equipartition method; the study was carried out for particles of different sizes. The trapping force was first found to increase then decrease with number of particles in trap for all particle sizes. We feel that our studies will be useful in applications of optical tweezers involving trapping of multiple particles in a single trap.
1. Introduction
Since their invention in 1980s [1] optical tweezers have been used as one of the most important tools for investigation in micro and nano regimes without any mechanical contact. Optical tweezers have been used in a number of fields which are very diverse in nature [2] i.e. biology, chemical sciences, material sciences etc. with only one similarity that all of them are micro or nano in size regime. This versatility of optical tweezers has made them very popular in the scientific community.
Apart from single beam optical trap, scientists are using multiple optical traps for a diversity of applications [3]. A number of methods have been used for the generation of multiple traps e.g. time sharing of laser beam [4], holographic optical tweezers [3], and use of a beam splitter [5]. A number of algorithms are being written to produce desired and easily controllable multiple optical tweezers [3,6-9].
In contrast to it, multiple particles in a trap were not so much of a popular topic to study. In fact it was thought more of a nuisance. However some studies have been done on the multiple particles in a single trap [10,11]. It has been found that when two particles are trapped in an optical trap they do not move independently but there exists a binding between them [12]. It has also been studied that when two or more particles are trapped in a single optical trap, they align themselves in axial direction and it appears as if only one particle is trapped [11]. The variation of the trap strength with the size of the trapped particles has also been studied [13].
2. Experimental Setup
Our experimental setup has been shown in Figure 1. It is a typical inverted microscope based optical tweezer setup. It consists of a diode laser (785 nm, maximum power 46 mW) and inverted microscope from Nikon (TE-2000 U). The laser beam is directed to the oil immersion high numerical aperture (NA 1.40) 100X objective lens (Plan Apo vc 100X/1.40 oil, Nikon) using beam expanding assembly consisting of lenses L1, L2, periscopic mirrors (M1, M2) and the dichroic mirror.
The beam expanding assembly was used so that the laser beam could fill the back aperture of the objective lens completely. The refractive index of the immersion oil is 1.515. The laser power before the dichroic mirror is
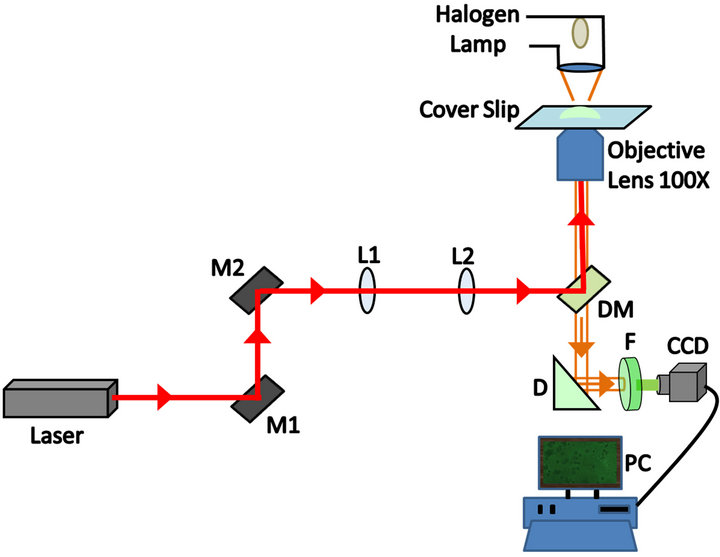
Figure 1. Experimental setup for studying multiple particles in a single trap. M1, M2: mirrors; L1, L2: lenses; DM: dichroic mirror; P: beam steering device; F: color glass filter; CCD: charge coupled device camera.
around 10.7 mW. The trap formed was elliptical in shape and trap size (1/e type) along its two axes is 0.8 µm (y-direction) and 0.62 µm (x-direction) respectively. The particles used in this experiment are silica latex beads (from Bang’s Laboratory). These particles are spherical in shape and they were suspended in double distilled water. We have used particles of different sizes (0.33 µm, 0.6 µm, 0.97 µm, 1.86 µm and 2.47 µm) in this experiment. The specimen sample was illuminated by a halogen lamp assembly. The light from illuminated particles was sent to the cooled color CCD camera (Evolution VF, Q-Imaging) connected to the computer through the objective lens, dichroic mirror and a beam steering prism. The same objective lens is used for the viewing and trapping of the particles. A color glass filter is used before the CCD camera to block the laser to avoid saturation of the camera. The stage movement with a knob was used to bring the trap at the different parts of the sample.
3. Experimental Results and Discussion
Upto three particles could be trapped stably in the trap. But stable trapping for four particles was not possible for all particle sizes. Though for particle size of 0.97 µm even four particles could be trapped, for other particle sizes especially 0.33 µm and 2.47 µm trapping of four particles in a single trap was not stable. The graphs for multiple particle trapping have been plotted for five different particle sizes viz. 0.33 µm, 0.6 µm, 0.97 µm, 1.86 µm, 2.47 µm (Figures 2 to 6). The plots show the variation of the trapping force with the number of particles in the trap as well as the variation of the trapping force with the size of particles. The method used for calculating the strength of the force is Brownian motion method (equipartition method). It is clear that the trapping force first
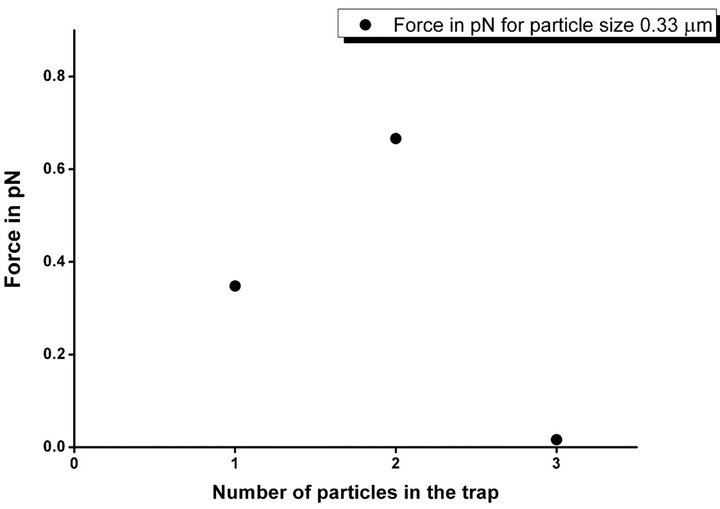
Figure 2. Variation of trapping force (in pN) with number of particles in a trap for a particle of size 0.33 µm.
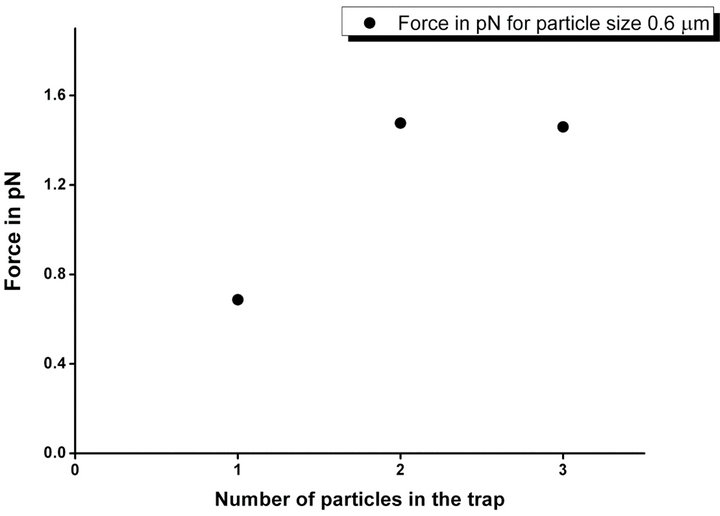
Figure 3. Variation of trapping force (in pN) with number of particles in a trap for a particle of size 0.6 µm.
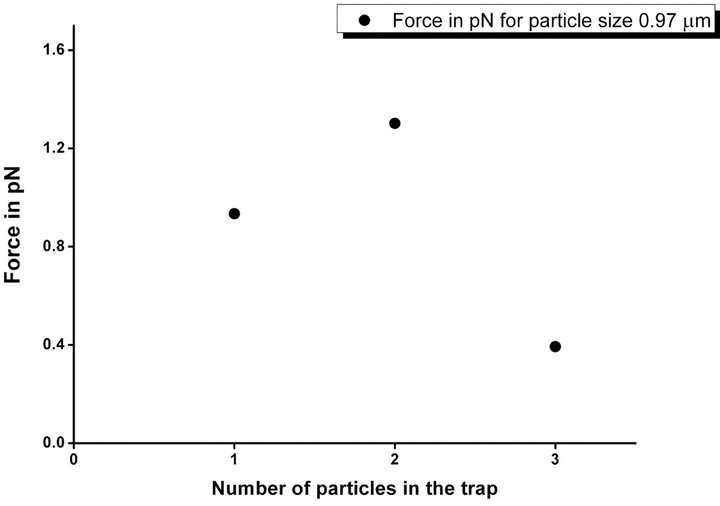
Figure 4. Variation of trapping force (in pN) with number of particles in a trap for a particle of size 0.97 µm.
increases with the number of particles in the trap, reaches a maximum and then decreases. The increase in the trap strength with the increase in the number of particles can be understood by looking into fundamental mechanism
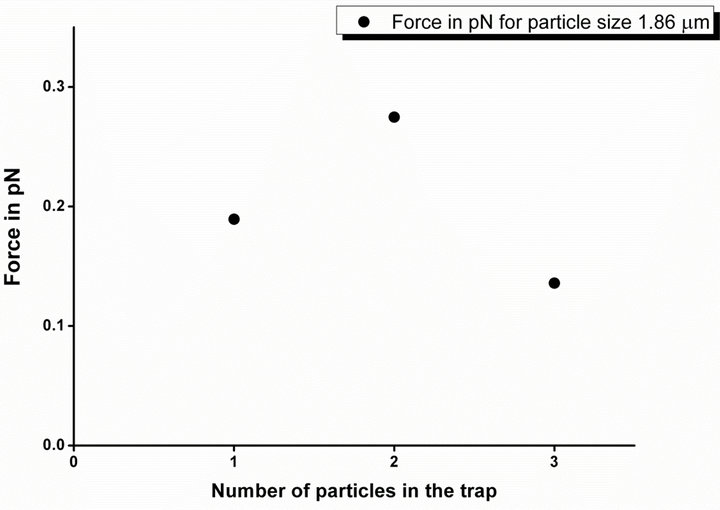
Figure 5. Variation of trapping force (in pN) with number of particles in a trap for a particle of size 1.86 µm.
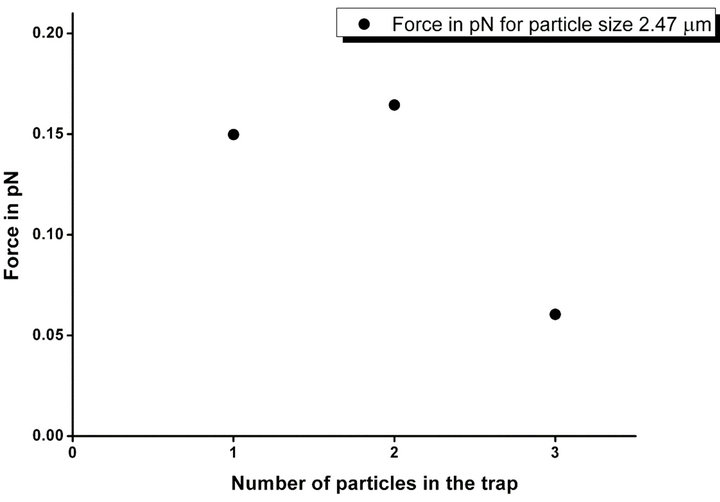
Figure 6. Variation of trapping force (in pN) with number of particles in a trap for a particle of size 2.47 µm.
of optical trapping which tells that trapping requires refraction of light, more the refraction of light from the particle the more will be trapping strength [13]. As the number of particles in the trap increases the light which could not be refracted due to first particle, could be refracted by second particle and third particle respectively. Additionally most of the light would be refracted by first and second particle only. Very small amount of light will remain for refraction by the third particle. Hence addition of the third particle in the trap will only destabilize the trap (will decrease the trapping strength). This accounts for first increase in trap strength as number of particles increases from one to two and again decrease in trap strength as number of particles changes from two to three. Figure 7 shows the variation of the trapping force with the size of particles in the trap. Figure 7 clearly shows that the value of trapping force first increases with size of particle, reaches maximum and then decreases. For beads of small diameter relative to the wavelength of the laser , stiffness is expected to rise with increasing diameter, as the amount of material in the beam increases
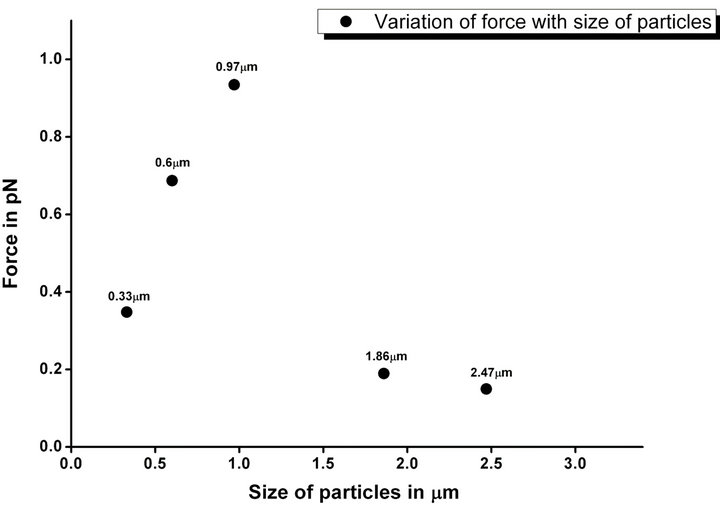
Figure 7. Variation of trapping force (in pN) with size of particles in the trap.
and so does the trapping power [14]. On the other hand, for large particles , where the ray optic regime holds, particles intercept all the converging rays at the laser focus, so the trapping force is the same, irrespective of diameter. However the trapping force are spread out over a larger distance the bigger the particle, so the stiffness should decrease with increasing diameter [13].
4. Theoretical Background
From Ashkin [14] we know that the force due to a single ray of power P hitting a dielectric sphere at an angle of incidence ![]() with incident momentum per second of
with incident momentum per second of  can be calculated as follows.
The total force on the sphere is the sum of contributions due to the reflected ray of power PR and infinite number of emergent refracted rays of successively decreasing power  The quantities R and T are the Fresnel reflection and transmission coefficients of the surface at θi. The net force acting through the origin can be broken into FZ and FY such that
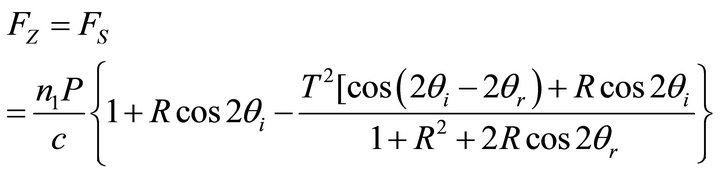 (1)
(1)
and
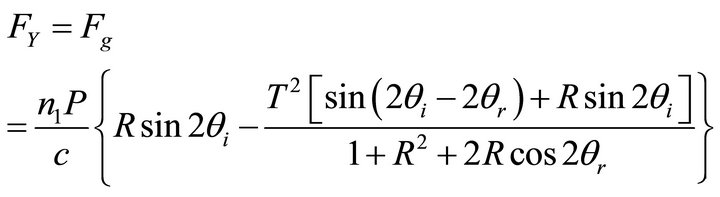 (2)
(2)
where θr is the angle of refraction.
If we consider the case of two particles trapped together and for simplicity consider that both the particles are of same size and are in contact and also trapping of 2nd particle is only due rays refracted through first particle.
Let any ray of power P falls on the 1st particle at an angle of incidence θi, (Figure 8) there will be infinite number of refracted rays of decreasing power 
 coming out of the 1st particle.
The 2nd outgoing ray which is the first outgoing refracted ray will make an angle  from the direction of the incident ray. And from the Figure 9 we can see
 .
.
Similarly nth ray coming out 1st particle will make an angle  from the direction of incident ray (Figure 10) and
Not all rays scattered from first sphere will hit 2nd sphere. If we consider the lower half of the second sphere (Figure 11) then only those rays for which the value of β is less than π/2 will pass through the 2nd sphere. This condition puts a constraint on the values of α for which the outgoing rays from first sphere will hit the second sphere.
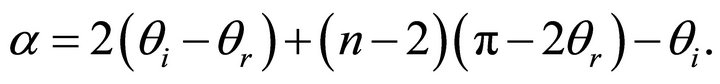
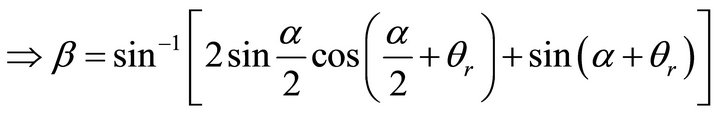
From trigonometry it can be shown that
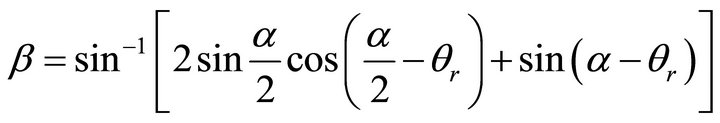
Figure 12 demonstrates the same for both lower and upper half. For upper half
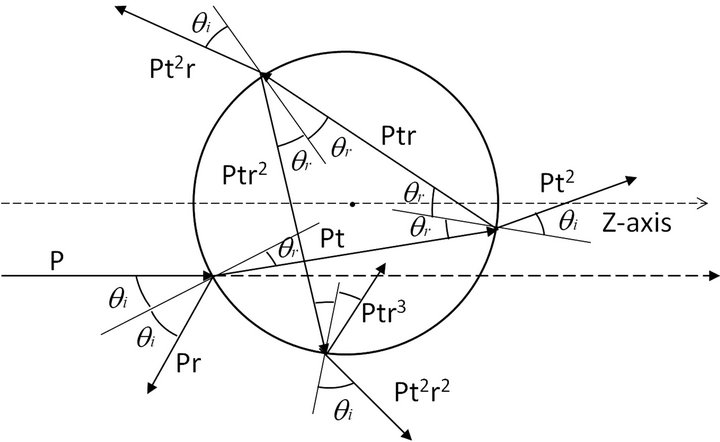
Figure 8. Schematic diagram for calculation of Gradient and Scattering force in Mie size regime.
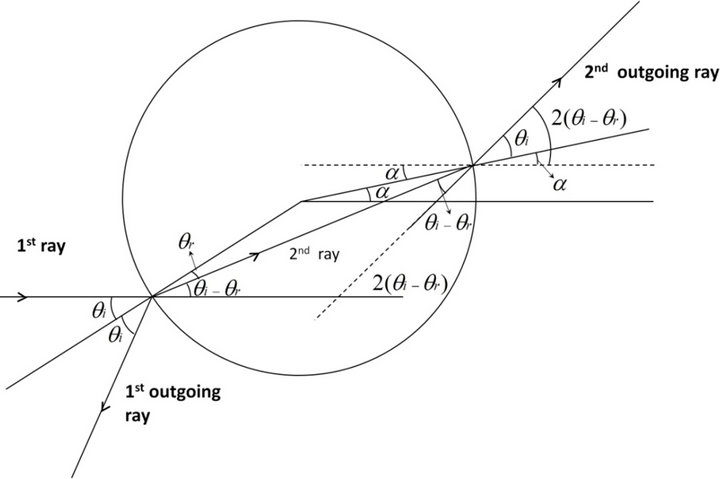
Figure 9. Schematic diagram showing 1st and 2nd outgoing ray from first particle.
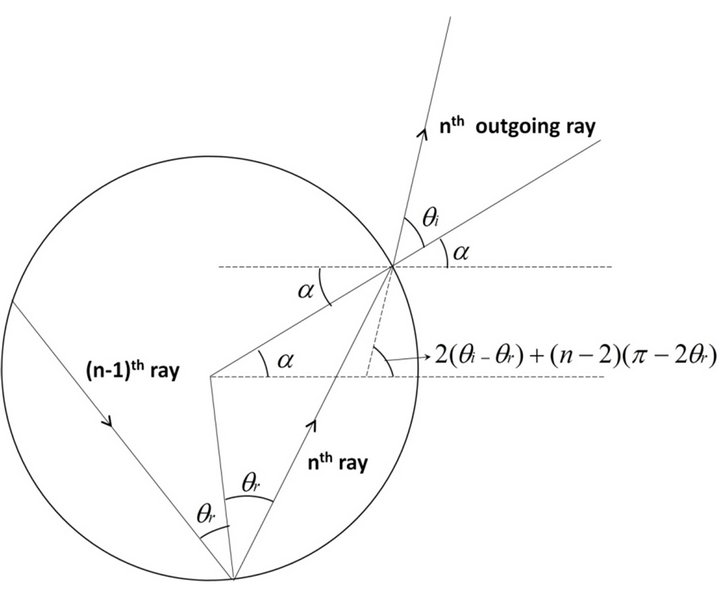
Figure 10. Schematic diagram showing nth outgoing ray from 1st particle.
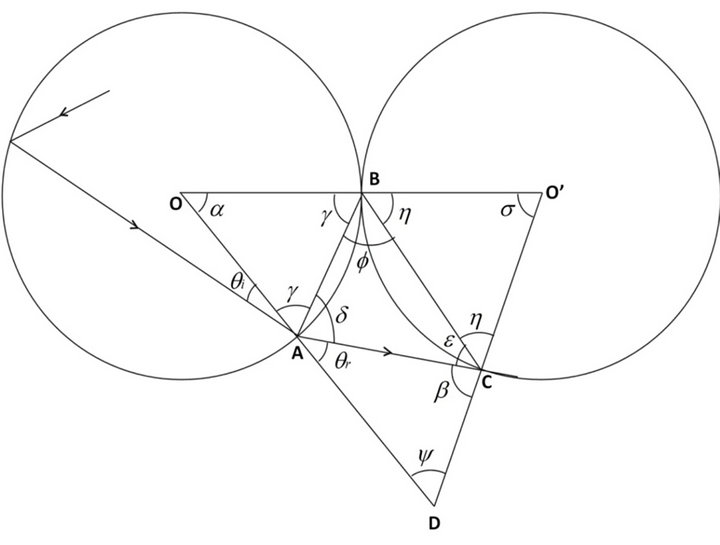
Figure 11. Schematic diagram showing ray paths in two particles.

Figure 12. Schematic diagram showing ray paths in two particles in both lower and upper half sphere.
Rest of the calculations remain the same, we only have to replace θr with −θr.
If we put value of β equal to 90 degrees in above two equations, we will get two critical values for α. The outgoing ray from first sphere will hit second sphere only if for that ray the value of α is between the two critical values. We have prepared a program for calculating the value of force for second and third sphere. The program first calculates the values of α for successive reflections. If the value of α is between two critical values it calculates the angle of incidence on 2nd sphere i.e. β. Then using Equations (1) and (2) it calculates the force on 2nd sphere due to that ray. It does this for all those rays for which the ratio of power to the incoming ray is greater than a specified value. Finally it adds the contribution of all such outgoing rays which hit the 2nd sphere. It should be noted that in our calculations we have not considered the effect of the rays which are reflected back from second particle and enter the first particle and also rays which are reflected back from third particle and enter the second particle. Therefore presence of second particle will not have any effect on trapping of first particle and trapping of third particle will have no effect on trapping of second particle which actually will not be the case.
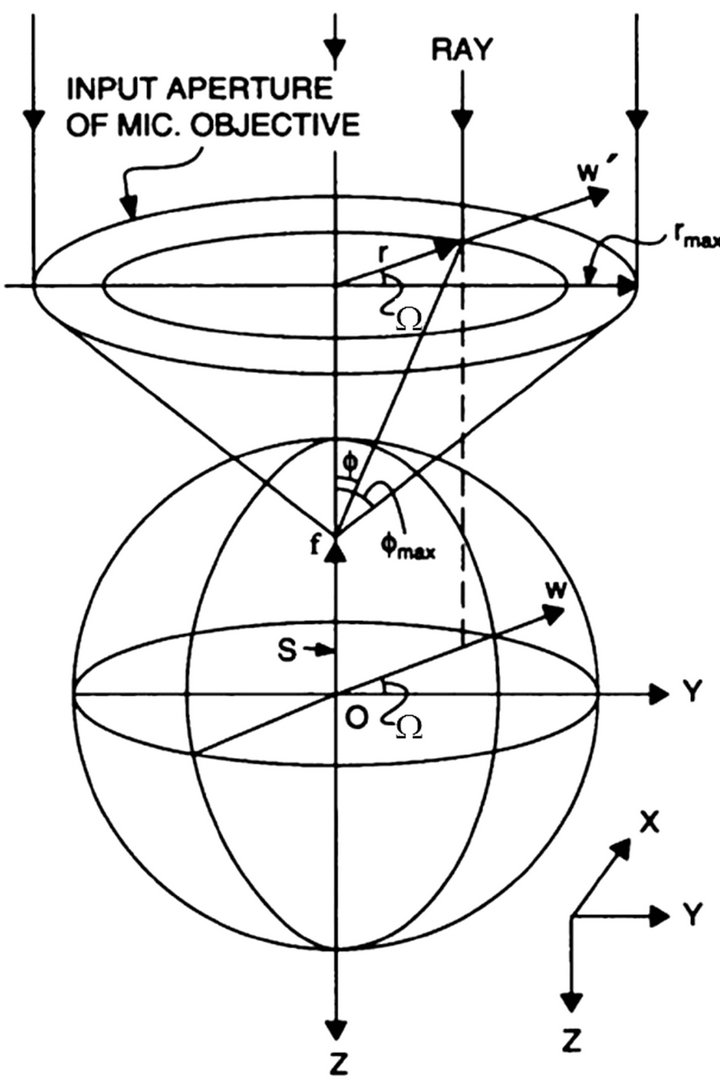
If we study the trapping force on a single particle from Ashkin [14] from focussing of rays as shown in Figure 13 (figure taken from Ashkin [14]), the gradient force component, the scattering force component, and the total force, expressed as , and
, and , for values of S above and (−S) below the centre of the sphere can be computed when the focus f of the trapping beam is located along the Z axis at a distance S above the centre of the sphere at O, as shown in Figure 13.
Using our program we have calculated the values of trapping force for one, two and three particles in a trap. Total trapping force (resultant of gradient and scattering force) for first particle with S has been plotted in Figure 14, whereas the variation of total trapping force for second and third particles in a trap with S has been shown in Figure 15. The results obtained for one particle in the trap (Figure 14) are qualitatively same as obtained by Ashkin [14]. It is clear from Figure 15 the trapping force for two particles always pulls the second particle towards trapping centre thus making trapping of two particles in a trap quite possible. However for three particles in a single trap the total trapping force on the third particle is always in one direction which shows that three particles should not be trapped simultaneously. Though we experimentally we found trapping of three particles simul-
 (a)
(a)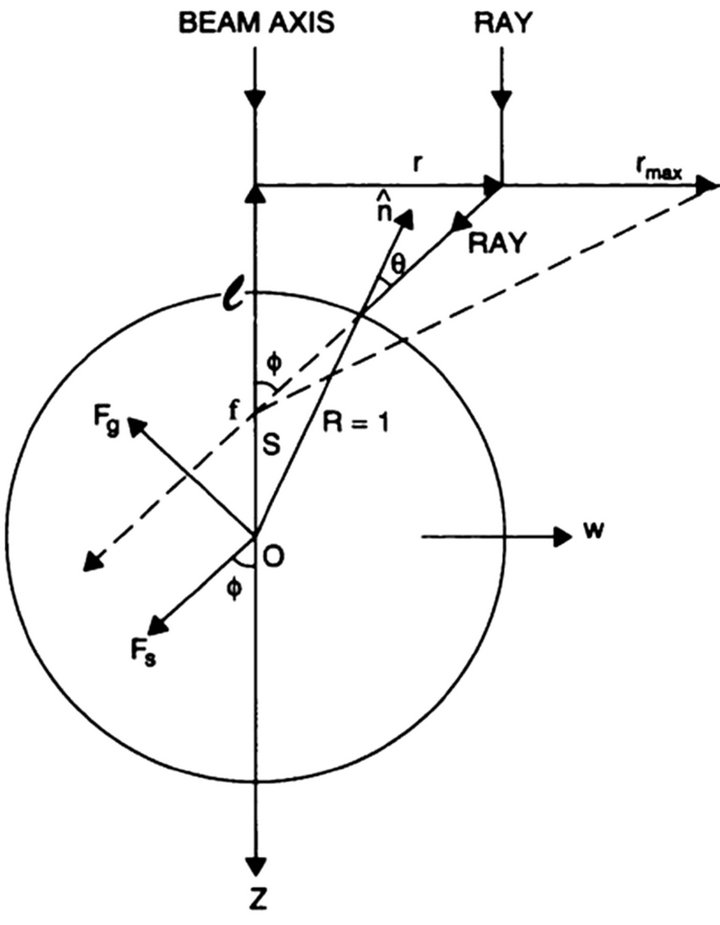 (b)
(b)
Figure 13. (a) Single beam gradient force trap in the ray optics model with beam focus located along the Z-axis of the sphere. (b) Geometry of an incident ray giving rise to gradient and scattering force contribution Fg and FS.
taneously is slightly unstable but possible.
5. Conclusions
We have experimentally and theoretically studied trapping of 1 to 3 particles in a single trap. Theoretical results for trapping of one particle are qualitatively same as obtained by Ashkin [14]. Trapping strength was found to increase experimentally when number of particles in the trap were increased from one to two and decrease as number of particles in the trap increased from two to three. Theoretically the trapping force on the first particle was
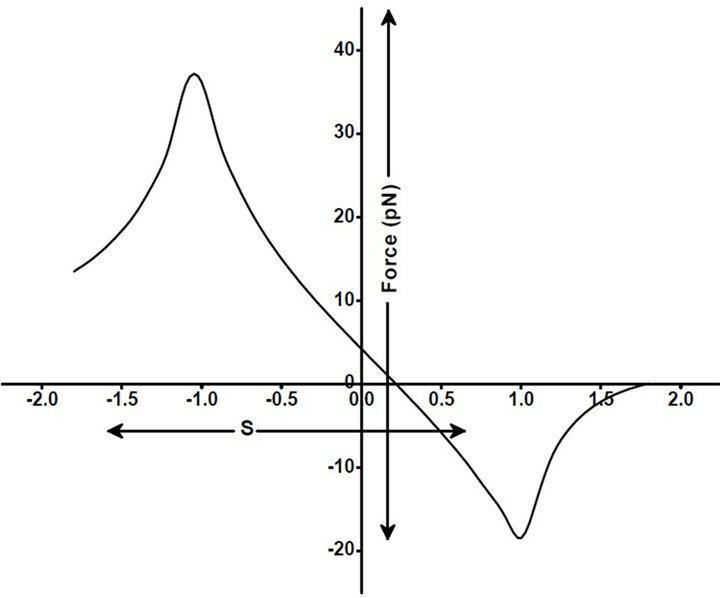
Figure 14. Values of total trapping force (in pN) (resultant of the scattering force and gradient force) exerted on a sphere of index of refraction n = 1.6 by a trap with a uniformly filled input aperture which is focused along the Z axis at positions +S above and −S below the centre of the sphere.
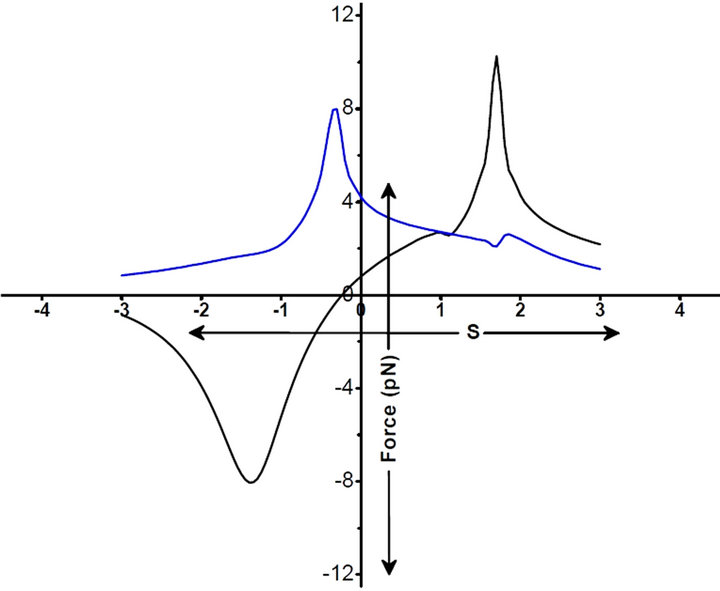
Figure 15. Total trapping force (in pN) on second and third particles for n = 1.6, black curve shows total trapping force for second particle, blue curve shows the same for third particle.
greater than that on the second particle, on the third particle it was unidirectional hence destabilizing.
It should be noted that in our calculations we have not considered the effect of the rays which are reflected back from second particle and enter the first particle and also rays which are reflected back from third particle and enter the second particle. Therefore by our calculations presence of second particle will not have any effect on trapping of first particle and trapping of third particle will have no effect on trapping of second particle which actually will not be the case. Considering the effect of all the rays will provide the clearer picture.
REFERENCES
- A. Ashkin, J. M. Dziedzic, J. E. Bjorkholm and S. Chu, “Observation of a Single-Beam Gradient Force Optical Trap for Dielectric Particles,” Optics Letters, Vol. 11, No. 5, 1986, pp. 288-290. doi:10.1364/OL.11.000288
- D. G. Grier, “A Revolution in Optical Manipulation,” Nature (London), Vol. 424, No. 6950, 2003, pp. 810-816. doi:10.1038/nature01935
- D. G. Grier and Y. Roichman, “Holographic Optical Trapping,” Applied Optics, Vol. 45, No. 5, 2006, pp. 880-887. doi:10.1364/AO.45.000880
- J. E. Molloy, “Optical Chopsticks: Digital Synthesis of Multiple Optical Traps,” Methods in Cell Biology, Vol. 55, 1998, pp. 205-215. doi:10.1016/S0091-679X(08)60410-0
- E. Fallman and O. Axner, “Design for Fully Steerable Dual-Trap Optical Tweezers,” Applied Optics, Vol. 36, No. 10, 1997, pp. 2107-2113. doi:10.1364/AO.36.002107
- E. R. Dufresne, G. C. Spalding, M. T. Dearing, S. A. Sheets and D. G. Grier, “Computer-Generated Holographic Optical Tweezer Arrays,” Review of Scientific Instruments, Vol. 72, No. 3, 2001, pp. 1810-1816. doi:10.1063/1.1344176
- M. Reicherter, T. Haist, E. U. Wagemann and H. J. Tiziani, “Optical Particle Trapping with Computer-Generated Holograms Written on a Liquid-Crystal Display,” Optics Letters, Vol. 24, No. 9, 1999, pp. 608-610. doi:10.1364/OL.24.000608
- M. Hacker, G. Stobrawa and T. Feurer, “Iterative Fourier Transform Algorithm for Phase-Only Pulse Shaping,” Optics Express, Vol. 9, No. 4, 2001, pp. 191-199. doi:10.1364/OE.9.000191
- F. Wyrowski and O. Bryngdahl, “Iterative Fourier-Transform Algorithm Applied to Computer Holography,” Journal of Optical Society of America A, Vol. 5, No. 7, 1988, pp. 1058-1065.
- S. H. Xu, Y. M. Li and L. Lou, “Axial Optical Trapping Forces on Two Particles Trapped Simultaneously by Optical Tweezers,” Applied Optics, Vol. 44, No. 13, 2005, pp. 2667-2672. doi:10.1364/AO.44.002667
- M. Li and J. Arlt, “Trapping Multiple Particles in Single Optical Tweezers,” Optics Communications, Vol. 281, No. 1, 2008, pp. 135-140. doi:10.1016/j.optcom.2007.09.032
- M. M. Burns, J. M. Fournier and J. A. Golovchenko, “Optical Binding,” Physical Review Letters, Vol. 63, No. 12, 1989, pp. 1233-1236. doi:10.1103/PhysRevLett.63.1233
- R. M. Simmons, J. T. Finer, S. Chu and J. A. Spudich, “Quantitative Measurements of Force and Displacement Using an Optical Trap,” Biophysical Journal, Vol. 70, No. 4, 1996, pp. 1813-1822. doi:10.1016/S0006-3495(96)79746-1
- A. Ashkin, “Forces of a Single-Beam Gradient Laser Trap on a Dielectric Sphere in the Ray Optics Regime,” Biophysical Journal, Vol. 61, No. 2, 1992, pp. 569-582. doi:10.1016/S0006-3495(92)81860-X
NOTES
*Corresponding author.