American Journal of Operations Research
Vol. 2 No. 3 (2012) , Article ID: 22427 , 9 pages DOI:10.4236/ajor.2012.23039
A DSS for Human Resettlement: Supporting Interactive Optimal Decisions
1Faculty of Management, University of Lethbridge, Lethbridge, Canada
2School of Engineering & IT, UNSW@ADFA, Canberra, Australia
Email: zahir@uleth.ca, ziaul.almahmud@uleth.ca, r.sarker@adfa.edu.au
Received May 16, 2012; revised June 18, 2012; accepted June 30, 2012
Keywords: Decision Support Systems; Environmental Decision; Goal Programming Model; Analytic Hierarchy Process, Integration; Interactive Interface
ABSTRACT
Decisions regarding relocation of people due to environmental requirements can be very complex and may have serious socio-economic implications. We present the design of a Decision Support System to support such decision making processes involving many inputs, human preferences and multiple objectives.
1. Introduction
Historically humans have been relocating from one location to another-sometimes voluntarily, sometimes forced —due to various reasons such as 1) life style (nomads), 2) political (many incidences, a sensitive issue), 3) natural disaster (earthquake, climate change effect), 4) development project (hydroelectric dams) and 5) extraction of natural resources (mining). Relocation of people due to environmental requirements is a very complex one and may even create severe social unrest unless it is planned well considering various social, economic, humanitarian and popular factors. Zahir, Sarker and Al-Mahmud [1] recently presented a decision model to facilitate relocation of people as an adaptation to climate change. McCartney [2] discussed the devastating effects of large dam construction in Africa and described how the appropriate use of decision support systems (DSS) could assist in project planning and mitigating negative effects. Zaman [3] discussed resettlement issues of the poor displaced people due to riverbank erosion in Bangladesh which is now the focus of a new kind of human resettlement problem arising from coal mine development projects.
Coal is extracted from mines using both underground and surface mining techniques (i.e., open pit, strip or mountain top). In surface mining, a larger proportion of deposits can be commercially extracted compared to underground mining. But, surface mining severely alters the landscape and damages the environmental value of the surrounding land, requiring special remedial procedures to follow. In densely populated areas such as the northern part of Bangladesh where coal deposits have been discovered, people have to be relocated in a planned manner. Geographical locations of the coalfields are shown in Figure 1 and the pertinent data are given in Table 1. Currently, coal is being extracted from location (2) by underground mining method. However, there is a plan to extract coal from location (1) by open-pit method which may require more than fifty thousand people to be relocated.
Zahir and Sarker [4] recently extended their previous
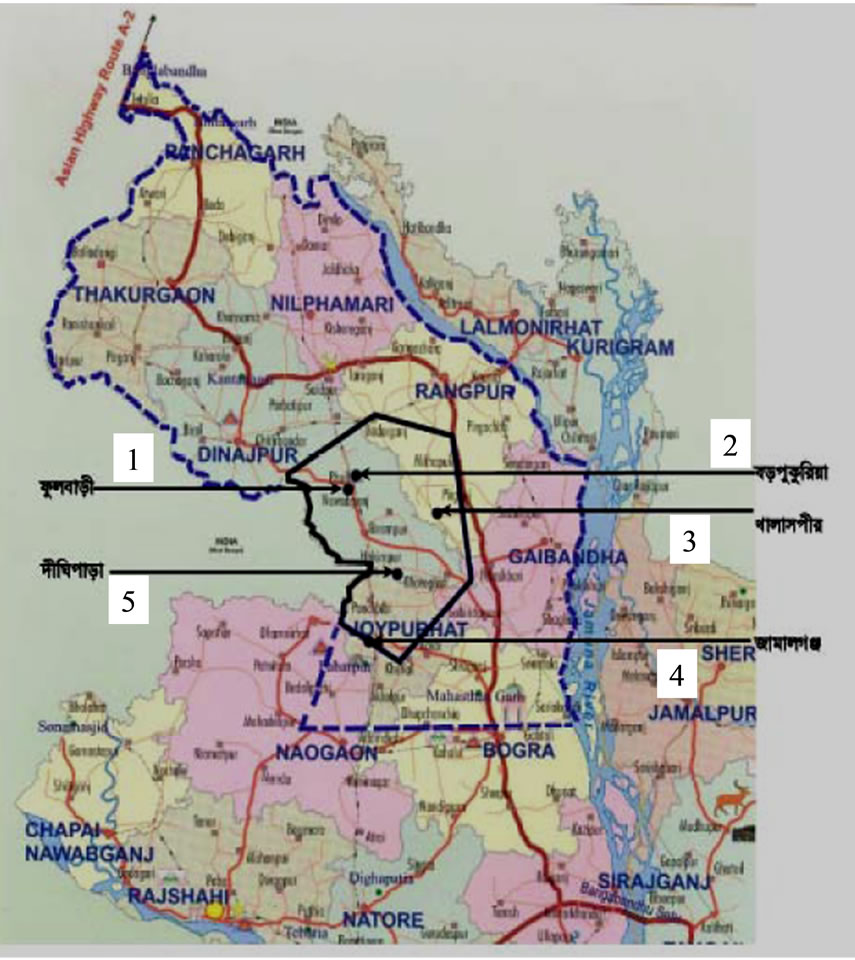
Figure 1. Map of Northern Bangladesh showing location of coal deposits.
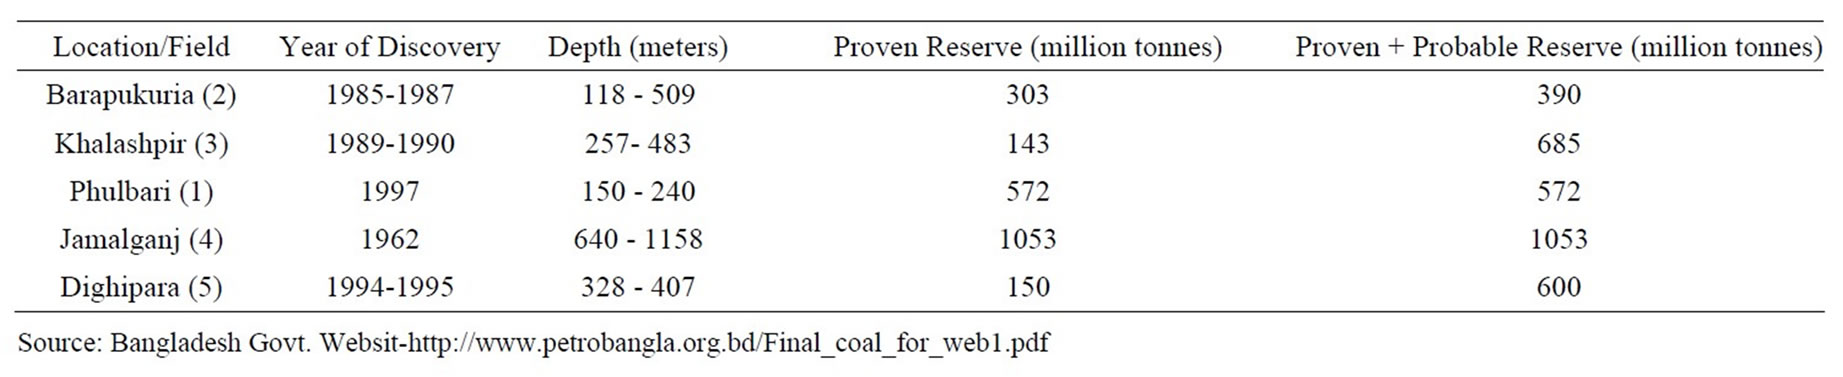
Table 1. Pertinent data of identified coal deposits in Bangladesh.
Goal Programming (GP) model [1] for relocating inhabitants from a location where surface mines can be developed. For a given set of inputs, LINGO 10™ was used to generate optimal solutions in a structured decisionmaking scenario. However, the complex decision scenario is a dynamic one with many inputs that can vary from time to time and from one application to another. Often, more than one decision-maker may be involved and people’s preferences may not be known exactly, leading to a semi-structured situation. The priorities of the objectives are not fixed and thus “what if” type analyses may be needed to get a better insight into the relocation problem. In addition, the generated solutions have to be stored for further analysis. Only an interactive DSS with a user friendly interface can provide a meaningful tool having enhanced computational speed in processing, storage and analysis. In this paper, we present the design of the Surface Mining Decision Support System (SMDSS) embedding the model of Zahir and Sarker [4].
Chen [5] developed an interactive DSS using simulation method for tourism development. Petropoulos et al. [6] discussed the development of a DSS for tourism demand analysis and forecasting. Choi et al. [7] presented a hybrid e-procurement DSS utilizing multi-criteria decision making and optimization models. Zahir and Dobing [8] developed a Web-based multi-criteria group support system for organizational decision making. Matthies, Giupponi and Ostendorf [9] gave an account of recent developments in environmental DSS outlining the rapid progress of the subject.
Rest of the paper is structured as follow: design architecture of SMDSS is presented in the second section; the running system is described in the third section and the conclusion is drawn in the last section.
2. Design of SMDSS
SMDSS was designed using the standard framework of Sprague [10]. Key components are a database, a model base, and an interactive user interface (Figure 2). Each component is described briefly.
2.1. Database
The database typically requires external and internal data. Various costs, preferences, objective target values and
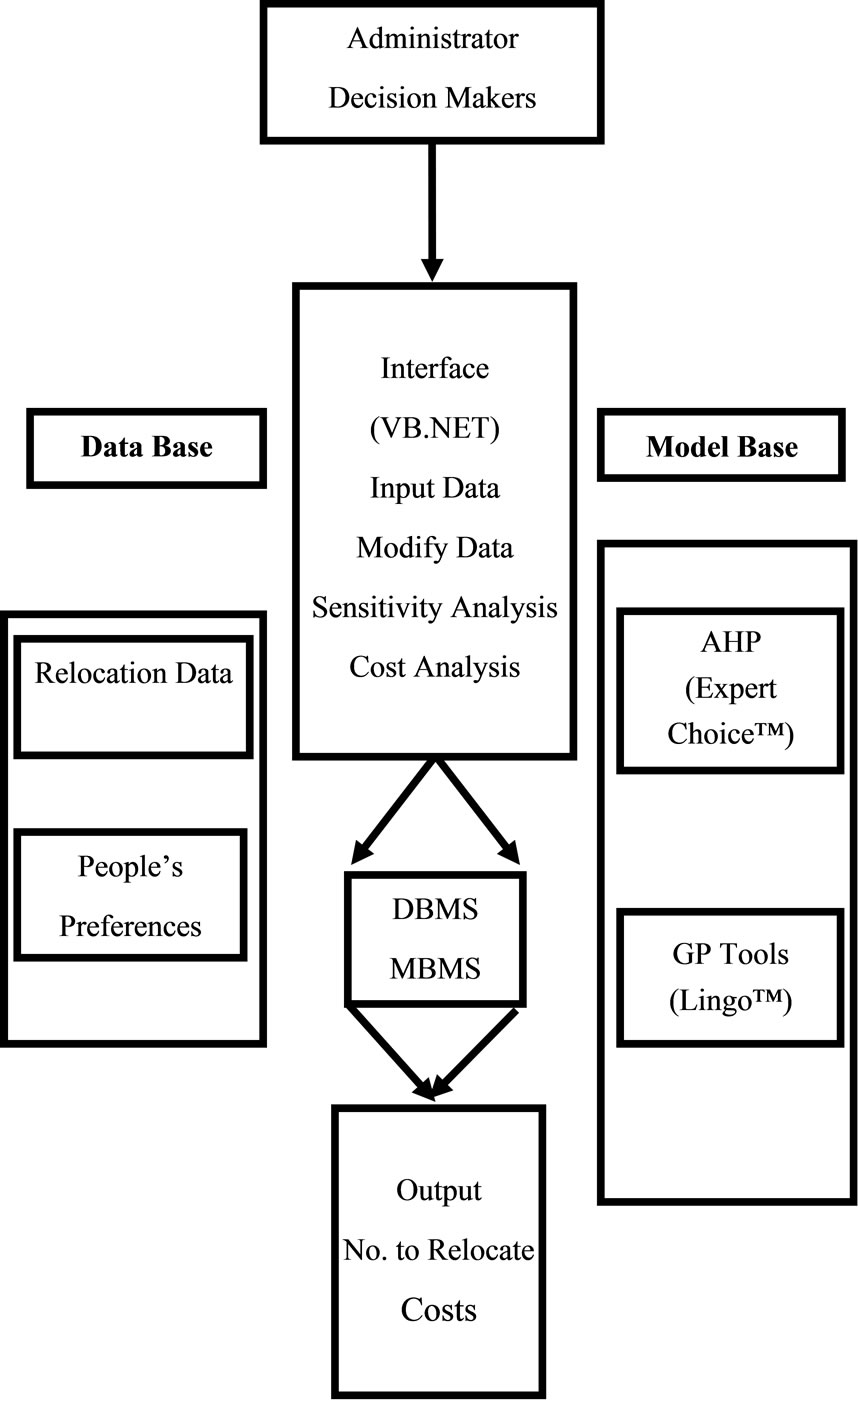
Figure 2. Schematic diagram of SMDSS
demographic data are stored in text-based sequential files. The outputs generated are also stored in additional data files for subsequent analyses.
2.2. Model Base
2.2.1. Multi-Objective Decision Model
Zahir and Sarker [4] combined GP [11,12] with the Analytic Hierarchy Process (AHP) [13-15] for optimal decisions addressing multiple conflicting objectives. They used Expert Choice™ (a well-known AHP-based software package) for computing goal objective weights and then used LINGO 10™ to solve the GP problem. The complete formulation is given in Appendix A and the reader is encouraged to see Zahir and Sarker [4,16] for a complete description of the model.
We emphasize that in many situations an entire affected population may not have to move en masse; rather a selective resettlement of sections of populations may enhance the adaptive capacity of the remaining part of the population as the mine is developed. In addition, with the passage of time, such an approach may even encourage the return of migrants to the affected locations as remedial procedures are implemented. A reduced population load on a community will lighten the pressure on limited resources and enhance manageability of the adaptive capacity of a community. Our objective is to devise an optimal relocation plan to determine the number of families (“who” and “how many”) that have to be resettled at which locations (“to where”). We consider several types of costs and incorporate family preferences (obviously influenced by social and cultural capitals) in the plan in a multi-criteria decision-making approach.
Optimal decisions are reached in two stages. In the first stage, how many families will be resettled to which target areas from which affected locations is decided. Then, in the second stage the plan will determine which particular families will be selected, taking into account various human and social-cultural considerations. In the latter stage, composition of a family in respect of the number of elderly members, health condition of family members and number of children need to be considered in determining the priority for selecting a family for relocation.
2.2.2. Analytic Hierarchy Process
The AHP is a popular multi-criteria decision making tool that is ideally suited for setting priorities for the goal objectives. It is a multi-criteria decision-making technique which permits the inclusion of both quantitative and qualitative criteria. For that reason, a large number of DSS covering many types of products and services has been developed using the AHP [17,18]. It has been used in many applications in environmental research [19] as well. The process requires that the decision maker provide judgments about the relative importance of each criterion and then specify preferences for each decision alternative on each criterion. The output of AHP is a prioritized ranking, indicating the overall preference for each of the decision alternatives. For the relocation problem, Zahir and Sarker [4] considered a two-level hierarchy (Figure 3) with three criteria: human considerations (HC), economic considerations (EC) and technical considerations (TC) and computed the overall priorities of the alternatives (i.e., human preference objective (HP), opportunity objective (OP), and budget objec-
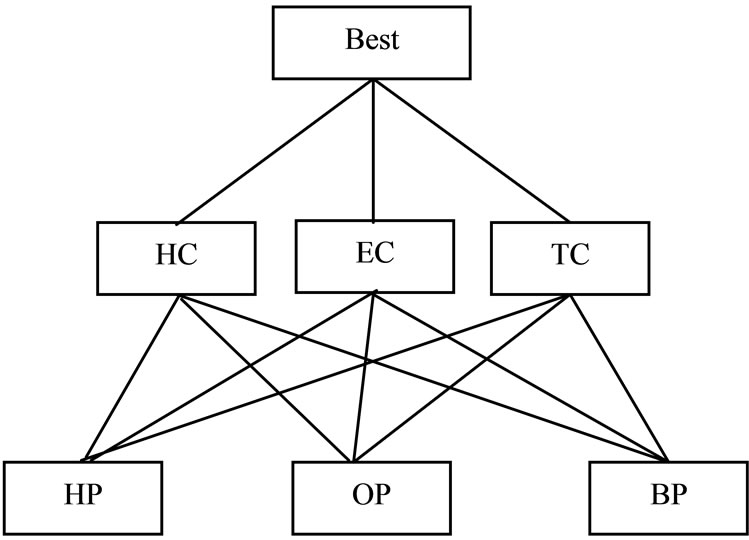
Figure 3. AHP Hierarchy for Computing Priorities of the Goal Objectives (HC: human consideration, EC: economic consideration, TC: technical consideration).
tive (BP)) after inputting ratio judgments via pairwise comparisons. This could be done either by a single decision maker or by a group of decision makers that includes all possible stakeholders.
2.3. Interface: Some Technical Details
The interface was designed using VB.NET with a sequence of form-based screens that facilitated interactivity. It also enabled integration with LINGO. Many parameter values were passed into LINGO code and optimal solution results were returned from LINGO to the VB. NET modules for display, storage and processing. In addition to basic VB controls (e.g., button, textbox, listbox and labels), DataGridview control was used as it was a convenient tool for entering, editing and displaying a set of numeric results and data. Since the interaction with the LINGO module was a major aspect of the system, it is worthwhile to provide some details to explain this technical matter. As is mentioned, the VB project has to include a class called Lingo with prototype declarations of several methods and, users are free to add new ones as needed. These methods are called in the system to transfer data back and forth between the VB modules and the LINGO code via pointers. These pointers are saved on a memory-stack and thus, their access in LINGO code and VB.NET modules must be consistent. For example, if a one-dimensional array POPI (member of a form class modData) of population data at N locations is to be entered into the LINGO code from the VB module, the following lines of code in the VB module are added.
nError = lingo.LSsetPointerLngArray1D (pLINGO, modData.POPI, nPointersNow)
If nError <> 0 Then
MsgBox("POPI!")
End If The corresponding data entries in the LINGO code are DATA:
POPI = @POINTER(3);
Here POPI is a variable in LINGO module and we named it the same as in VB code so as to avoid mistakes. LSsetPointerLngArray1D () is defined in Lingo class. Similary, if total cost obtained in LINGO module has to be transferred back to the VB module for display, the following section of code is added.
nError = lingo.LSsetPointerLng(pLINGO, TCOST, nPointersNow)
If nError <> 0 Then
MsgBox("TCOST!")
End If so that the value is returned in VB variable TCOST. The corresponding code in LINGO is DATA:
@POINTER(30) = TCOST;
. . . .
Here TCOST is a variable in LINGO and, as before, we named it the same as in VB code so as to avoid mistakes. Again, LSsetPointerLng () is defined as a method in the class Lingo. LINGO code is in a separate file (GP-AHP-Mining.lng) and the file is called from VB through a dynamically generated command string as follows during execution.
Dim cScript As String cScript = "SET ECHOIN 1" & Chr(10) cScript = cScript&"Take:\SM_DSS\GP-AHP-Mining.lng" & Chr(10)
cScript = cScript & "Go" & Chr(10)
cScript = cScript & "Quit" & Chr(10)
cScript = cScript & Chr(0)
nError=lingo.LSexecuteScriptLng(pLINGO,cScript)
lingo.LScloseLogFileLng(pLINGO)
3. Running the System
3.1. Selected Screen Shots of the System
Various controls of VB.NET were very useful in designing an effective interface with excellent functionalities.
The introductory screen of the interface is shown in Figure 4. Sub-menu items of the menu tabs display the default data and various model parameters as they are loaded from the database. These screens also allow changing the input data before generating optimal decisions meeting various goal objectives subject to given objective priorities. For example, selecting “Affected area categories” sub-menu item from “Population” menu item will open the screen in Figure 5 where each of the input data values can be changed (and later saved). The weights of the goal objectives can also be changed using the interface screen of Figure 6. SMDSS automatically
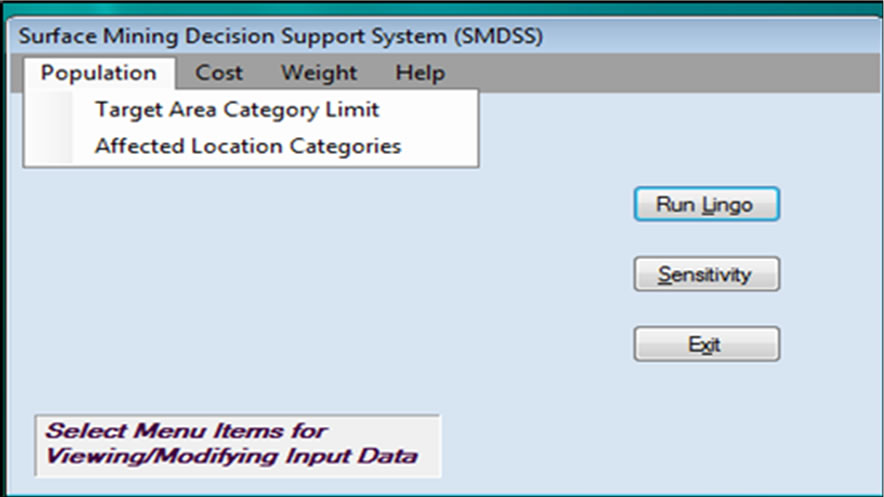
Figure 4. Introductory Screen of SMDSS with menu and sub-menu items and buttons.
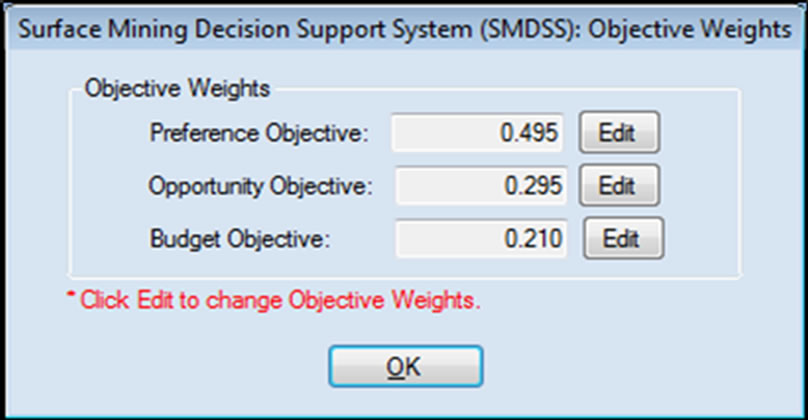
Figure 6. Editable objective priorities obtained via an AHP analysis. Changing one priority automatically changes others keeping total sum remains unity.
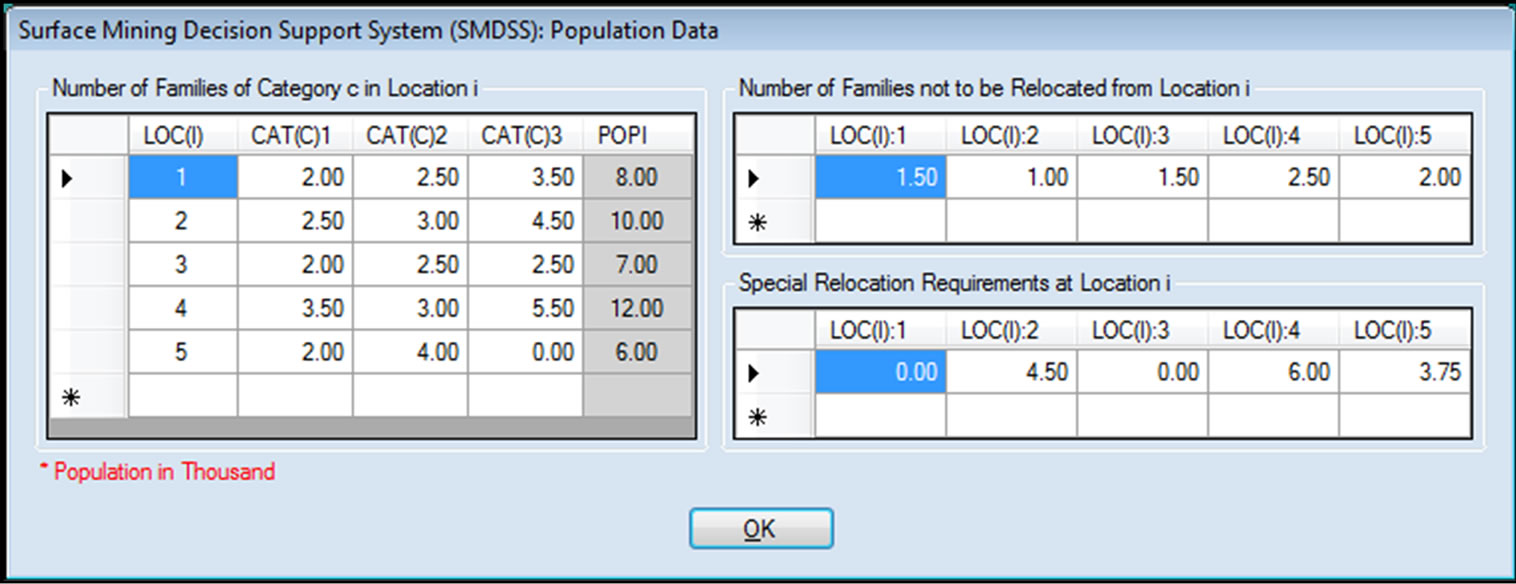
Figure 5. Input Sample Data for SMDSS that can be changed and saved in separate files.
readjusts other weights if one is changed such that sum of all weights remain equal to one.
Selecting the button “Run Lingo” from the mail screen (Figure 4), opens a screen with solution-numbers using he updated input data as in Figure 7. The numbers in Figure 7 correspond to SMDSS using LINGO 10.0 to solve the GP problem assuming B = 200 (million $) and other default datasets as inputs. The GP solutions are as follows. Non-zero deviational variables are: pd− = 0.014, bd+= 277.38, and  = 0.50. Total cost was $477.38 million. Selecting the tab XICJ, opens a screen with detailed optimal decisions of the relocation numbers. Selecting “RIJ” from the screen in Figure 7, opens screen in Figure 8 giving the total number of families (all cate-
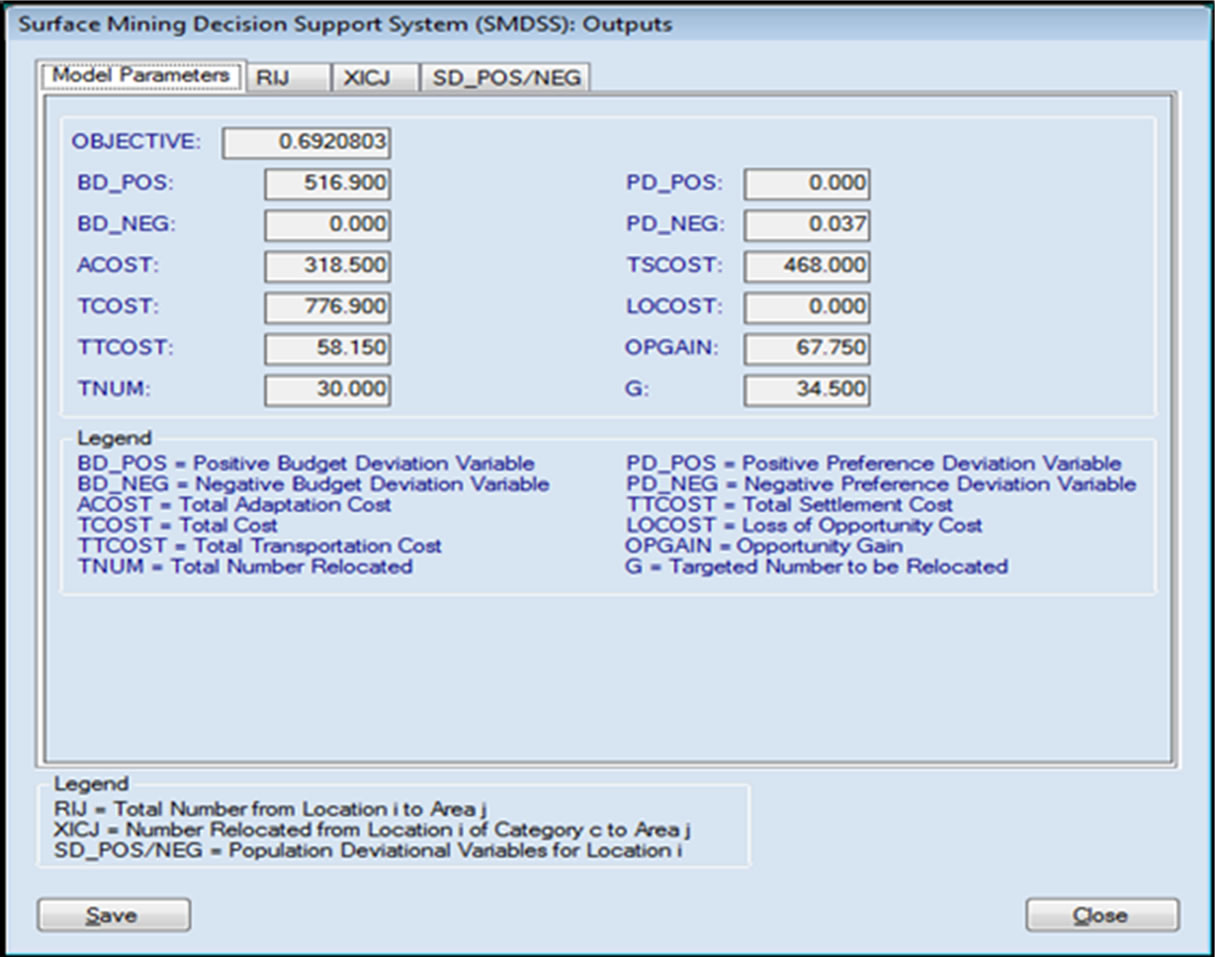
Figure 7. Detailed output from SMDSS after optimization by LINGO 10. Each tab in the top bar opens further outputs.
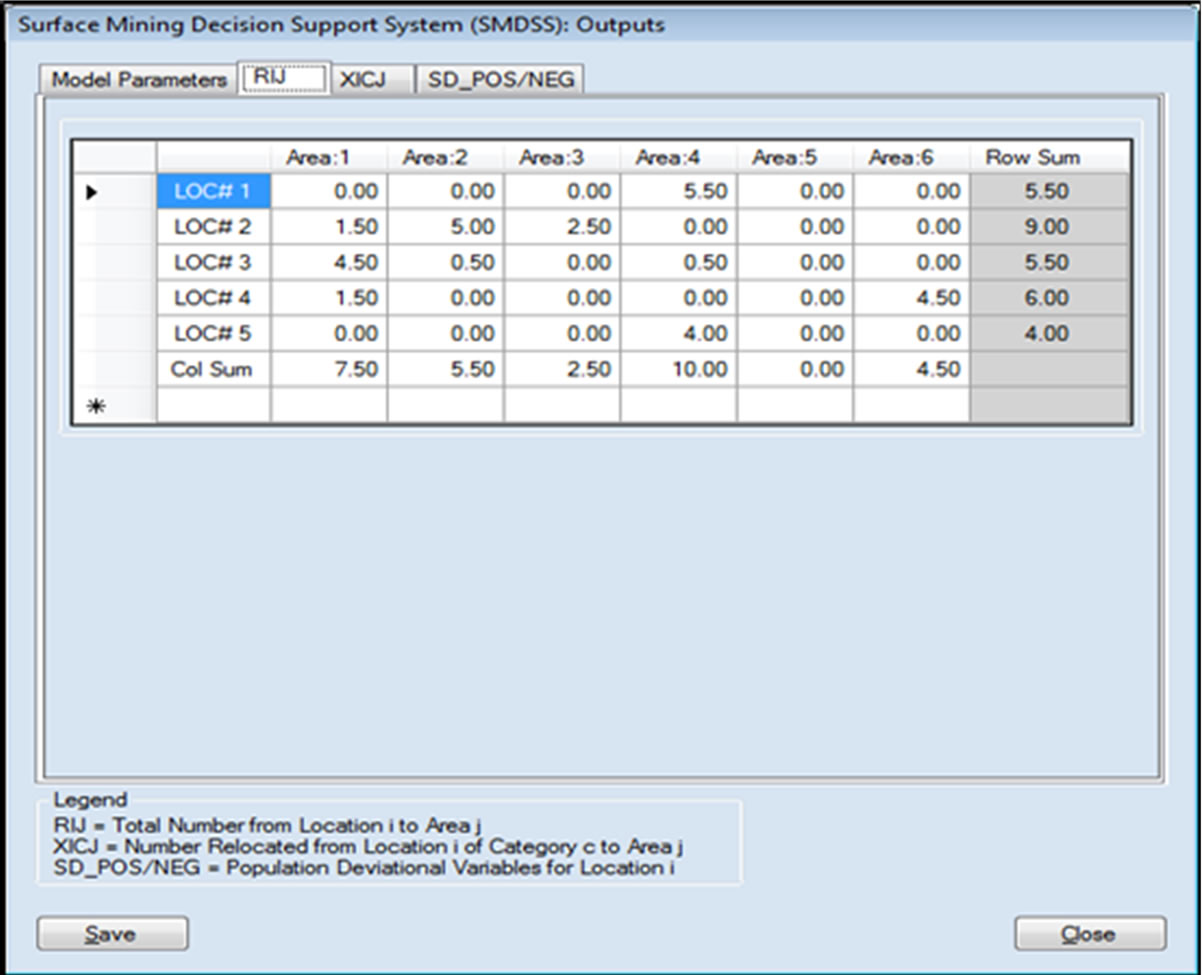
Figure 8. RIJ tab gives summarized results of the number of families relocated for all categories from each location to all target areas.
gories together) relocated with the following breakdown (total number was 25.00 thousand).
3.2. Sensitivity Analysis
Selecting the “Sensitivity” button on the introductory screen (Figure 4) opens the screen in Figure 9. The various tools are for performing sensitivity analysis. The user can adjust various costs incrementally (increasing or decreasing all costs of each type by a common factor, e.g., 10%). Also the goal reference values for the budget (B) and the target collective preference of the group of people (P) can be varied to see how sensitive the solutions are with respect to such changes. All outputs are saved in clearly identified data files and are available for use (e.g., graphical analysis) in other software tools such MS Excel™.
For example, in order to investigate the sensitivity of the solution with respect to various costs, we vary the transportation, adaptation, settlement and loss of opportunity costs one at a time by a common percentage and report the results in Figures 10 and 11 for the number of families relocated and the total cost respectively. The results seem to behave as expected. The given transporttation, adaptation, loss of opportunity and settlement costs in the above example are termed as the base costs of each category. In our sensitivity analysis we vary each category one at a time by changing all costs belonging to a category by a certain factor (say 90%) of the base costs.
In Figure 10, we plot the total number of families transported against the change in base costs. The target (G) line represents the targeted number G (= 25.5 thousand). We see that as the transportation and loss of opportunity costs are increased, number of families relocated is decreased below the target (G) line (i.e., more families (i.e., greater than some si) are retained for adaptation as some of the  s become non-zeroes). But, as the adaptation cost increases, the number of families relocated is increased (as some of the
  s become nonzeroes).
We also note a similar variation of total cost and
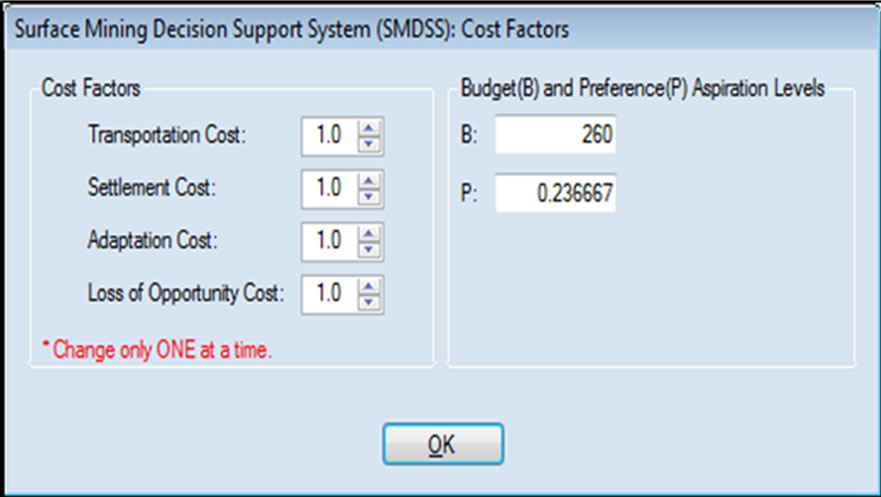
Figure 9. Screen for sensitivity analysis. All the costs of each category can be increased (decreased) by adjusting numbers in the pull-down item-list controls. For example changing 1.0 to 1.25 (0.75) implies increasing (decreasing) the costs by 25%. Similarly, input values for B and P can be changed as well for “what if” analyses.
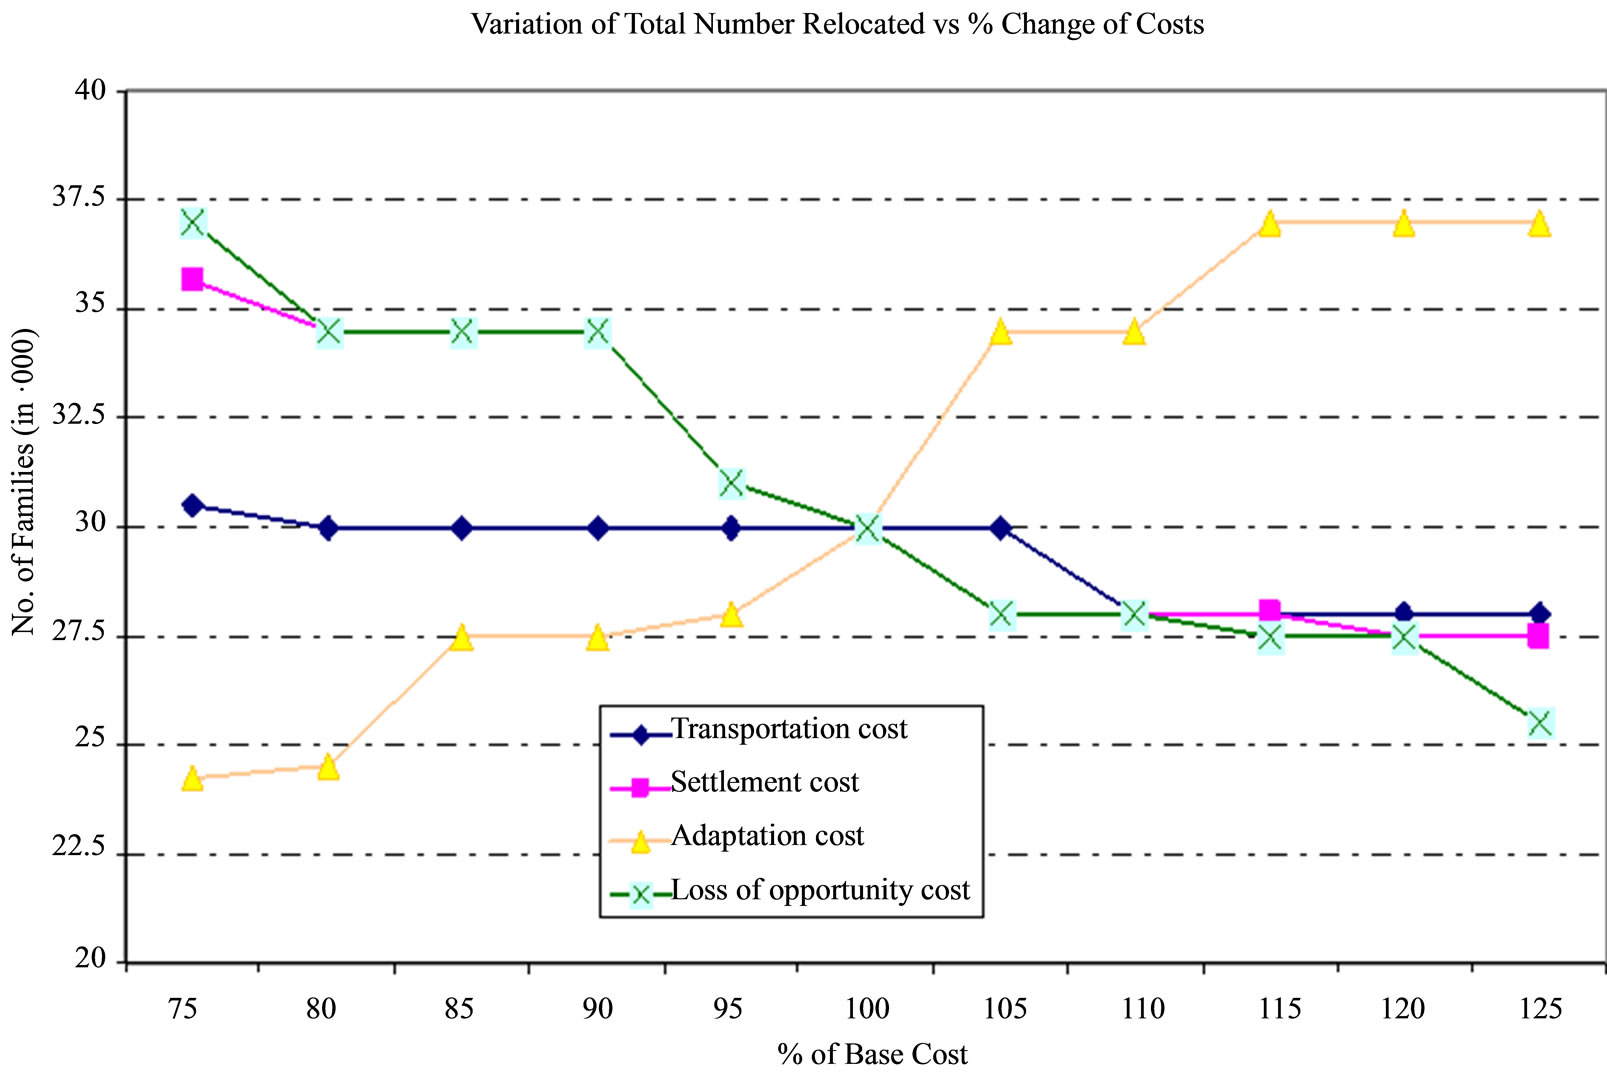
Figure 10. Variation of the total number of families relocated.
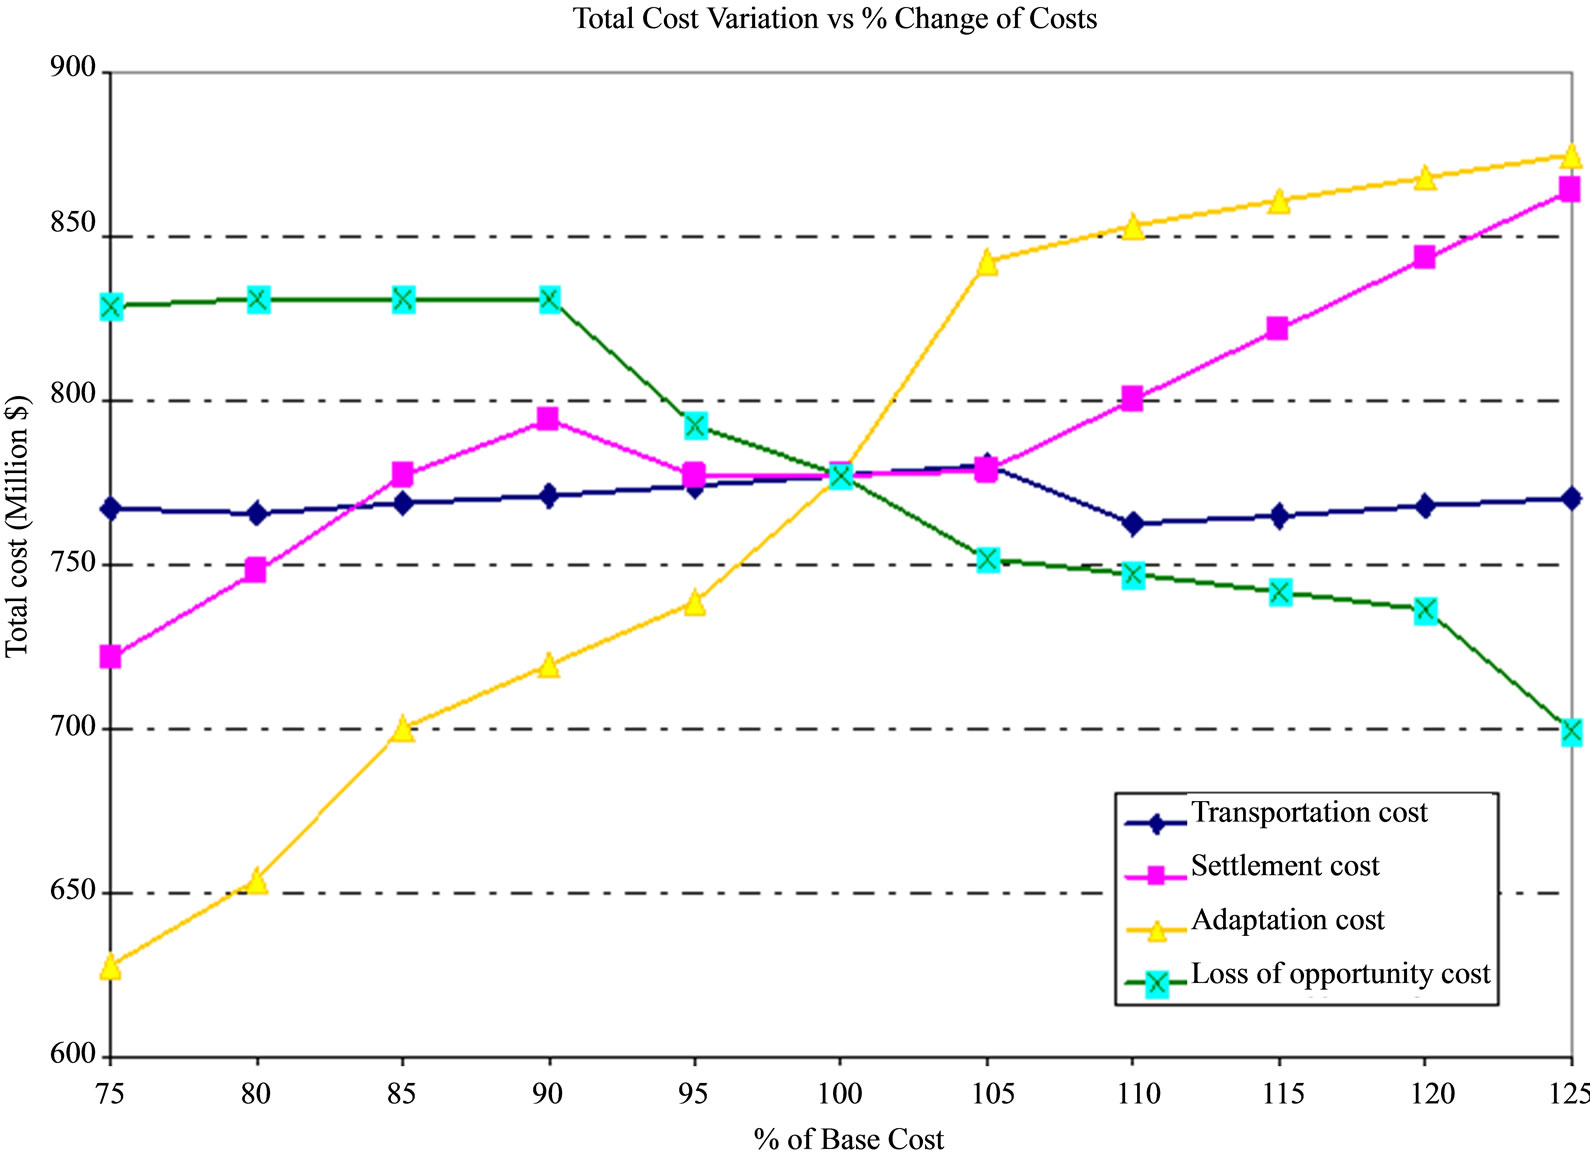
Figure 11. Variation of the total cost.
number relocated with respect to transportation, settlement and adaptation cost changes (Figure 11). For example, we notice that as the settlement cost is increased, more families are relocated and the total cost is increased as well. Similarly, as the transportation cost increases, both the total cost and the number of families relocated go down slowly. However, for the loss of opportunity cost variation, the behaviour is opposite. If the loss of opportunity cost is increased, both the number of families relocated and the total cost decreases (i.e., more families stay back).
4. Conclusions
Zahir and Sarker [4] developed a GP/AHP based methodology to find the optimal number of people who would be relocated and who would stay while developing surface mines. In this paper, we presented the design of SMDSS, an interactive, flexible, dynamic and userfriendly decision support system utilizing the model. The system considers the preference of individual families so as to reduce social costs, preferences of authority for meeting the planning objectives, and accommodation capacities at the present locations and new areas. It also incorporates various costs such as relocation cost, adaptation cost, transportation cost, settlement cost and loss of opportunity costs. Finally, it integrates the functionality of designed interface with database, model-base and optimization package LINGO 10™. We have no knowledge of any other similar system and thus could not make any comparisons. However we can anticipate future extensions of the research in the following context.
Consider a country where nomadic tribes are sparsely distributed over a vast geographic terrain. These people are following their own lifestyles for centuries. However, in order to bring “modern” amenities to them, the government may have a plan to cluster them around a few semi-urban centres. How do you decide about their “relocation”? We have to devise an optimal scheme that respects the culture, preferences and other physical, social, economic constraints. The SMDSS presented here, can be extended to incorporate such new model-features, parameters and objectives leading to the design of a decision support tool that can aid the planning process [20]. Recently Bascetin [21] designed an AHP based DSS for open-pit mining development. Our future work may incorporate details of Bascetin’s [21] work for further improvements.
REFERENCES
- S. Zahir, R. Sarker and Z. Al-Mahmud, “An Interactive DSS for Implementing Sustainable Relocation Strategies for Adaptation to Climate Change: A Multi-Objective Optimization Approach,” International Journal of Mathematics in Operational Research, Vol. 1, 2009, pp. 326- 350. doi:10.1504/IJMOR.2009.024289
- M. P. McCartney, “Decision Support Systems for Large Dam Planning and Operation in Africa,” IWMI Working Paper 119, International Water Management Institute, Colombo, 2007.
- M. Q. Zaman, “The Displaced Poor and Resettlement Policies in Bangladesh,” Disasters, Vol. 15, No. 2, 1991, pp. 117-125. doi:10.1111/j.1467-7717.1991.tb00440.x
- S. Zahir and R. Sarker, “Planning Relocation of People for Developing Surface Mines in Densely Populated Areas: Optimization of Multiple Objectives,” Asia-Pacific Journal of Operational Research, Vol. 28, No. 5, 2011, pp. 563-583. doi:10.1142/S0217595911003442
- K. C. Chen, “Decision Support System for Tourism Development: System Dynamics Approach,” The Journal of Computer Information Systems, Vol. 45, No. 1, 2004, pp. 104-112.
- C. Petropoulos, A. Patelis, K. Metaxiotis, K. Nikolopoulos and V. Assimakopoulos, “SFTIS: A Decision Support System for Tourism Demand Analysis and Forecasting,” The Journal of Computer Information Systems, Vol. 44, No. 1, 2003, pp. 21-32.
- J. H. Choi and J. W. Kim, “A Hybrid Decision Support Model for Selecting Highly Qualified Suppliers,” The Journal of Computer Information Systems, Vol. 49, No. 1, 2008, pp. 90-100.
- S. Zahir and B. Dobing, “Designing a Web-Based MultiCriteria Group Support System (MCGSS),” The Journal of Computer Information Systems, Vol. 42, No. 4, 2002, pp. 50-60.
- M. Matthies, C. Giupponi and B. Ostendorf, “Environmental Decision Support Systems: Current Issues, Methods and Tools,” Environmental Decision Support Systems, Vol. 22, No. 2, 2007, pp. 123-127.
- R. H. Sprague Jr., “A Framework for the Development of Decision Support Systems,” MIS Quarterly, Vol. 4, No. 4, 1980, pp. 1-26. doi:10.2307/248957
- A. Charnes and W. W. Cooper, “Management Models and Industrial Applications of Linear Programming,” John Wiley, New York, 1961.
- M. J. Schniederjans, “Goal Programming: Methodology and Applications,” Kluwer Academic Press, Norwell, 1995.
- T. L. Saaty, “The Analytic Hierarchy Process,” McGrawHill, New York, 1980.
- T. L. Saaty, “Decision Making for Leaders,” RWS Publications, Pittsburgh, 1995.
- T. L. Saaty, “The Analytic Network Process,” 2nd Edition, RWS Publications, Pittsburgh, 2001.
- S. Zahir and R. Sarker, “Multi-Objective Decision Making for Planned Relocation of People while Developing Surface Mines in Densely Populated Areas,” Proceedings of ASAC Annual Conference, Halifax, 24-27 May 2008.
- O. S. Vaidya and S. Kumar, “Analytic Hierarchy Process: An Overview of Applications,” European Journal of Operational Research, Vol. 169, No. 1, 2006, pp. 1-29. doi:10.1016/j.ejor.2004.04.028
- L. G. Vargas, “An Overview of the Analytic Hierarchy Process and Its Applications,” European Journal of Operational Research, Vol. 48, No. 1, 1990, pp. 2-8. doi:10.1016/0377-2217(90)90056-H
- G. A. Kiker, T. S. Bridges, A. Varghese, T. P. Seager and I. Linkov, “Application of Multicriteria Decision Analysis in Environmental Decision Making,” Integrated Environmental Assessment and Management, Vol. 1, No. 2, 2005, pp. 95-108. doi:10.1897/IEAM_2004a-015.1
- S. Zahir, Z. Al-Mahmud and R. Sarker, “Designing an Interactive DSS for Relocating People for Developing Surface Mines in Densely Populated Areas,” Proceedings of First Taibah University International Conference on Computing and Information Technology, Medina, 12-14 March 2012, pp. 403-408.
- A. Bascetin, “A Decision Support System Using Analytical Hierarchy Process (AHP) for the Optimal Environmental Reclamation of an Open-Pit Mine,” Environmental Geology, Vol. 52, 2007, pp. 663-672.
Appendix A
Let us assume that at the mine-site, N locations are affected and people will be relocated to M new target sites at the best possible cost and benefit to the society to the satisfaction of the people affected (Figure A1). Current population (in number of average families) in ith affected location is popi. jth target location will be able to accommodate up to rcj new families. ith affected location will be able to sustain si average families where presumably si < popi. Population is divided into C categories having common job, business or trade interests. xicj ise the number of families of category c relocated from location i to area j. tcij = transportation cost per average family from location i to target area j, scij = settlement cost for settling each average family from location i to target area j, aci = adaptation cost for enabling each family staying back at location i for adaptation and lci = loss of opportunity cost at location i per family is inflicted if any family is relocated from location i in excess of (popi – si). See references [18] for complete definition of variables.
Complete Formulation of the Relocation Model
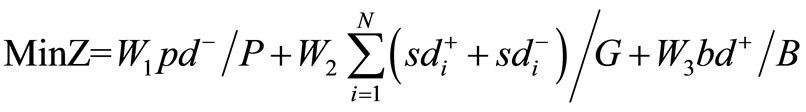 (F1)
(F1)
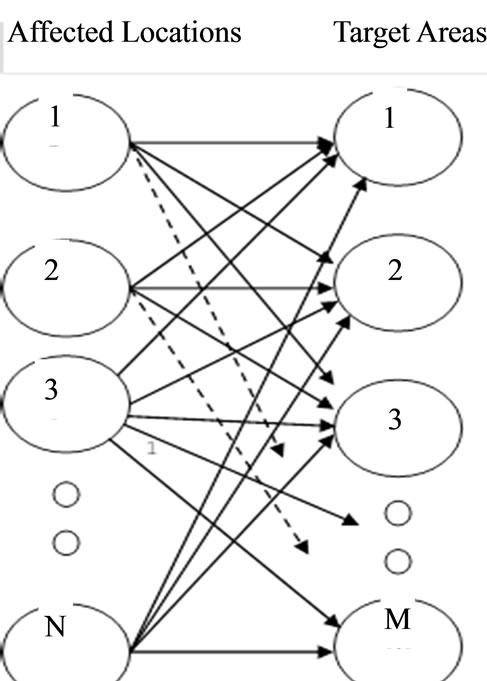
Figure A1. Schematic diagram of the relocation problem.
Costs:
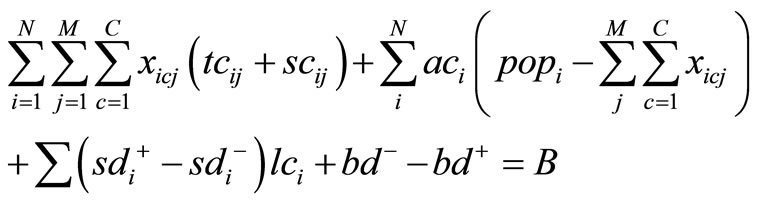 (F2)
(F2)
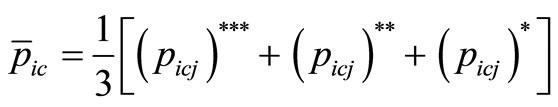
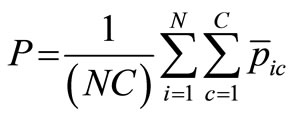
Preferences:
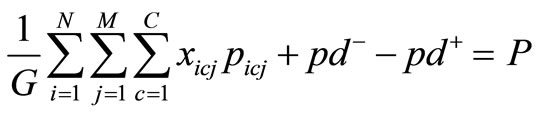 (F3)
(F3)
where,
 ,
,
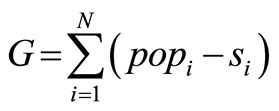
Limit on Number Relocated:
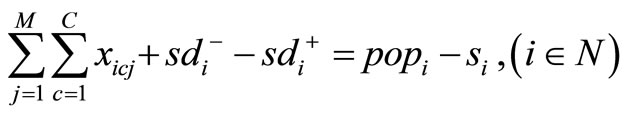 (F4)
(F4)
Minimum Requirements:
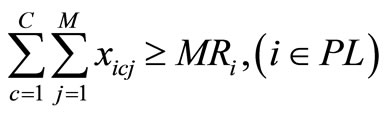 (F5)
(F5)
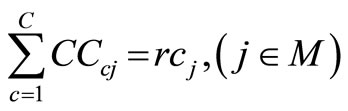
Capacity Limit at the Target Areas:
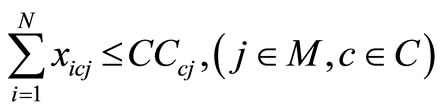 (F6)
(F6)
Limit on the Number of Available Families:
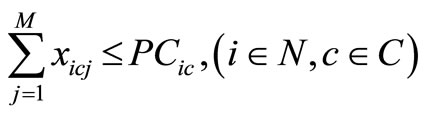 (F7)
(F7)
W1, W2, W3 are the relative priorities for human preference objective (HP), opportunity objective (OP) and budget objective (BP).