Journal of Analytical Sciences, Methods and Instrumentation
Vol. 3 No. 2 (2013) , Article ID: 32860 , 9 pages DOI:10.4236/jasmi.2013.32014
Application of Optical Methods in Blood Studies upon Evaluation of Severity Rate of Diffuse Liver Pathology
![]()
1Institute of Internal Medicine, SB RAMS, Novosibirsk, Russia; 2Institute of Cytology and Genetics, SB RAS, Novosibirsk, Russia; 3Rzhanov Institute of Semiconductor Physics, SB RAS, Novosibirsk, Russia; 4State Research Center of Virology and Biotechnology, Ministry of Public Health and Social Development of the Russian Federation, Koltsovo, Russia.
Email: *kruchmargo@yandex.ru
Copyright © 2013 Margarita Kruchinina et al. This is an open access article distributed under the Creative Commons Attribution License, which permits unrestricted use, distribution, and reproduction in any medium, provided the original work is properly cited.
Received February 28th, 2013; revised March 29th, 2013; accepted April 26th, 2013
Keywords: Optical Methods; Blood Serum Studies; Erythrocytes; Diffuse Liver Disease; Degree of Fibrosis; Dielectrophoresis; Ellipsometry; Raman Spectroscopy; IR Fourier Spectroscopy
ABSTRACT
Possible early diagnostic application of optical methods (dielectrophoresis, spectral and imaging ellipsometry, Fouriertransform infrared spectroscopy, Raman spectroscopy) in studies of red blood cells and serum of patients with diffuse liver disease with varying degrees of fibrosis has been evaluated. Application of combined optical methods was confirmed to significantly improve the performance of sensitivity, specificity, and accuracy index as well as to achieve the reliable results in diagnosis of both severe fibrosis and slight ulterior liver fibrosis. Identified diagnostic potential of optical methods can be effectively utilized in noninvasive screening evaluation of stages of diffuse liver disease of various geneses.
1. Introduction
Evaluation of the stage of the disease and the severity rate of liver fibrosis remains to be one of the key issues in verification of the diagnosis in patients with diffuse liver pathology as this evaluation predetermines prognosis and administration of adequate therapy. The issue of diagnosis of early stages of the liver fibrosis remains to be critical as they are known to be reversible [1]. Numerous methods of determining stages of liver fibrosis have been proposed, i.e. biochemical, macro-morphological, semiquantitative ones etc. [1,2]. Along with obvious advantages they also have some significant defects, i.e. a complicated sample preparation procedure, high cost of chemical agents and equipment, their specificity and insufficient sensitivity rate. Liver biopsy remains to be the “gold standard” in resolution of this issue. Even liver biopsy raises some issues of a subjective nature of the results obtained, the necessity to study several biopsy materials and frequent objections on the part of patients under study.
The optical methods applied in evaluation of the formed elements and blood serum are known to have some advantages that are significant for studies of biological objects. First of all, their high sensitivity rate when measuring low concentrations of bioorganic compounds in solutions or when applying these solutions to hard substrates is very crucial. Second of all, they do not destroy biological objects, numerous of which being of a complicated structure. Third of all, these methods enjoy high operational efficiency of measurements which do not require any special conditions (i.e. high vacuum, heating or cooling of a sample under study, special ionizing radiation, and the use of fluorescent tags).
The findings of previous studies of electrical and visco-elastic parameters of erythrocytes, ellipsometric indices of blood serum in patients with diffuse liver disease enabled to obtain the encouraging pilot results concerning successful diagnosis of the stage of the disease [3, 4].
This research aims to evaluate the potential value of application of optical methods in studies of erythrocytes and blood serum in early diagnosis of patients with diffuse liver disease with various degrees of fibrosis.
2. Material and Methods
2.1. Study Groups
Total 62 males aged 38 - 69 with diffuse liver pathology who gave their written consent for involvement in the clinical trials were included into the study. Control comprised 21 patients aged 35 - 60 in whom biochemical and instrumental studies revealed no clinically manifested chronical diseases of inner organs and whose biochemical and hematological blood findings were normal.
The severity rate of fibrosis was confirmed by liver biopsy performed in 21 patients with diffuse liver diseases. In 41 patients this index was determined by visual macromorphologic studies (ultrasonography, computed tomography, nuclear magnetic resonance tomography). For ethical principles patients in control were not performed liver biopsy. All the patients under study were performed biochemical and instrumental examinations, ultrasonography of liver, spleen, and portal vessels. The viral aetiology of the disease was determined based on the presence/absence of serological markers by method of enzyme multiplied immunoassay (EME) and/or DNA and RNA of viruses by method of polymerase chain reaction (PCR); and the alcoholic one was diagnosed based on negative results of EME of viral hepatitis serological markers and confirmed by extensive alcohol consumption.
Liver biopsy was used to separately define the histological index of activity of chronic viral hepatitis and the degree of severity of liver fibrosis. The majority of the patients (14 subjects) were diagnosed to have a moderate degree of histological activity (from 9 to 12 points); in 5 patients histological activity was light (from 4 to 8 points) and in 2 males it was severe (from 13 to 18 points).
Based on the results of cumulative analysis three groups have been formed depending upon the degree of severity of liver fibrosis. Group 1 comprised control subjects (21) with no traces of liver fibrosis (F0). Group 2 included 39 patients with the first or second degree of fibrosis (slightly pronounced fibrosis; F1-F2). Group 3 comprised 23 patients with the third or fourth degree of fibrosis (severe fibrosis; F3-F4).
The patients with F1-F2 fibrosis were diagnosed to have chronic viral hepatitis (hepatitis C in 9 patients, hepatitis B in 15 patients, hepatitis of B + C genesis in 4 patients) with minimal (16 subjects) and moderate (12 subjects) degree of biochemical activity. 12 patients of this group would consume alcohol on the regular basis, i.e. they had a combined viral and alcohol-related etiology. The liver pathology genesis of 11 patients was determined as the alcoholic one; no markers of viral infection have been revealed in them. The histological activity of the process in this group ranged from 4 to 8 points (А1) that would speak in favor of fibrosis.
9 patients with an F3-F4 degree of fibrosis were diagnosed to have chronic viral C hepatitis; chronic viral B hepatitis was confirmed in 14 subjects. In 10 of the above 23 patients the chronical viral infection was associated with a long-term alcohol abuse. In the majority of patients with liver cirrhosis (i.e. hepatitis of the fourth degree) the compensation factor by Child-Pugh corresponded to 8 - 10 points (class В), and in 3 individuals it ranged from 12 to 14 points (class С). Biopsy studies of 11 patients revealed a moderate degree of histological activity that ranged from 9 to 12 points (A2) and in 3 patients it was strongly pronounced and ranged from 13 to 18 points (A3).
The trial was performed in compliance with the approval granted by the Committee of Biomedical Ethics with the Institute of Internal Medicine of the Siberian Branch of the Russian Academy of Medical Sciences. All the subjects under study would fill out a standard form, i.e. the Informed Written Patient’s Consent for participation in the trial and the standard form about the history of alcohol consumption.
2.2. Dielectrophoresis Researches
The patients with verified diagnosis and males of control were examined their electric as well as viscoelastic parameters of erythrocytes by method of dielectrophoresis (DEPh) in nonhomogeneous alternating electric field (UAEF) with the help of an automated specialized plant applying an electro-optical system of cells detection [5]. The following parameters were evaluated: conductivity of membranes, indices of aggregation and destruction of erythrocytes, cellular membrane capacity, velocity of erythrocyte motion to electrodes, position of synchronous frequency, amplitude of deformation of erythrocytes, polarizability of cells, summarized rigidity and viscosity, values of induced dipole moment and charge.
The CELLFIND original software package was applied in computer processing of the data obtained.
2.3. Processing of Thin Films from Blood Serum
The centrifugation method was applied in this study to obtain thin films from blood serum [6,7]. Techniques of films processing and evaluation of their quality have been thoroughly described before [3]. The samples of fresh blood serum (~0.1 ml) were applied onto the central part of silicon wafers Si(111) KDB-10 of 76 mm in diameter preliminary washed in ammonia-peroxide etching solution at room temperature. The rotation velocity was 2500 r/min; the spin time equalled to 10 seconds. Prior to the ellipsometric characterization the films had been dried in the open air at room temperature within 2 hours. All the patients under study underwent the ellipsometric characterization of blood serum by methods of spectral and scanning ellipsometry.
2.4. Ellipsometric Study of Blood Serum Films
Ellipsometric spectra Ψ(λ) and Δ(λ) were measured by means of “ELLIPS-1771” spectral ellipsometric complex (SB RAS Institute of Semiconductor Physics) [8] within the range of wave length of λ = 250 - 1000 nm, the spectral resolution of apparatus being 2 nm, the recording time of one spectrum did not exceed 20 seconds; the angle of incidence of a light beam onto the sample was 70˚. A four-zone measuring was applied, with further averaging for all the four zones. Computation of dispersion response of retraction index n(λ) and the values of film thicknesses have been achieved by solving the inverse problem of ellipsometry applying the optical model, i.e. substrate-film-medium. The below experimental parameters of films have been estimated: the value of net thickness (d) and dispersion of n(λ) retraction index [3].
To study the homogeneity degree of coating the silicon wafers with serum films on the surface have been measured with the “Microscan” high resolution scanning ellipsometer (ISP SB RAS). Reading of ellipsometric Ψ and Δ angles was done in the central zones of the wafers (Ø76 mm) of 15 × 15 mm2 in size, the pitch on “x” and “y” axes being 0.1 mm. The angle of incidence of light beam on the sample equaled to 60˚.
2.5. IR Spectroscopy
Registration of the IR spectra was performed using the Bruker Vector 22 IR-Fourier-spectrometer at the wave length ranging from 400 to 7000 cm−1 with resolution of 2 cm−1. The OPUS 6.0 software was used to remove the oscillations connected to multiple-beam interference and the lines of water vapor and carbon dioxide absorption.
2.6. Raman Spectroscopy
Raman scattering of light of patients blood liquid serum was registered at room temperature by means of the T64000 spectrometer (Horiba Jobin Yvon) with the triple monochromator. The Ar+ line of a laser with the wave length of 514.5 nm was used for excitation, the spectral resolution being 1.5 cm−1. A silicon photosensor array cooled by liquid nitrogen was used as a detector. An additional attachment was used for microscopic studies of Raman scattering of light. The power of laser beam reaching the sample comprised 2 - 3 mW, the spot size equalling 5 - 6 µm.
2.7. Statistical Treatement of Data Obtained
The statistical treatment of data obtained was performed using the SPSS, ver.10 software. Significance of indices difference was computed using the Student and Pearson criteria (in case of normal distribution); in cases of deviation of distribution from the normal values the nonparametric criteria were used (U-criterion of MannWhitney, Kholmogorova-Smirnova).
3. Results and Discussion
Evaluation of parameters of erythrocytes by means of electrooptic systems revealed that at high frequencies (5 × 10⁵ Hz and 5 × 10⁶ Hz) erythrocytes of healthy subjects were moving to the closest electrode with high forward velocity (positive dielectrophoresis) and displayed a clearly marked ability to deform under the influence of non-uniform alternating electric field (NUAEF). No deformation of cells was registered at low frequencies (5 × 10⁴ Hz, 5 × 10⁵ Hz). Erythrocytes would push off the electrodes (negative dielectrophoresis), some single cells being destroyed by the field.
Interaction of erythrocytes with NUAEF in patients with diffuse liver pathology (DLP) tended to differ greatly, i.e. at high frequencies the amplitude of deformation (at the background of summarized indices of viscosity and rigidity), the value of dipole moment, velocity of the forward motion of cells against the electrodes tended to be significantly lower as compared to control (p < 0.001 - 0.03) (Figure 1).
Excessive hemolysis of cells was observed at all frequencies of the range under study (5 × 10⁴ - 5 × 10⁶ Hz). It
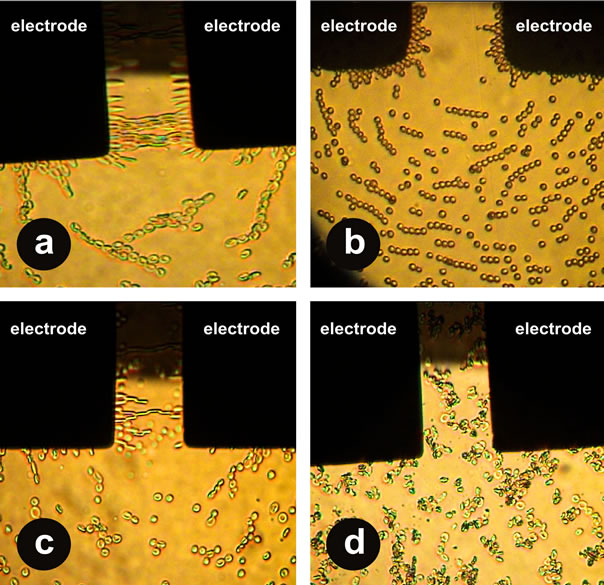
Figure 1. Division and deformation of erythrocytes influenced by nonhomogeneous alternating electric field at frequency of 1 MHz: (a) High deformation amplitude in control; (b) Low deformation amplitude in patients with severe liver fibrosis F3-F4; (c) Increased hemolysis of erythrocytes in patients with severe liver fibrosis F3-F4; (d) Increased development of aggregation in patients with severe liver fibrosis F3-F4.
matched the enhanced capability of erythrocytes to form large and medium size aggregates after transferring of erythrocytes into the 0.3 М sucrose solution (p < 0.001) (Figure 2).
Along with aggravation of fibrosis (from F1-F2 to F3- F4) erythrocytes of the patients with DLP tended to become more rigid with lower capacity of deformation, tending to form aggregates. These erythrocytes had lower resistance to stress factors of various intensity, and therefore they would easily get destroyed by NUAEF both at low and high frequencies. Reduced biological activity of red blood cells correlated with the reduced levels of polarization of cells at all frequencies (r = 0.57; p < 0.02). The membranes of erythrocytes would thicken (that displayed significant decrease of the level of electric capacity; p < 0.03. They conducted electrical current well (i.e. they possessed high electrical conductivity), although the walls of red blood cells would normally be dielectric. The reduced superficial negative charge of erythrocytes in cases of severe F3-F4 fibrosis demonstrated significantly lower indices of velocity of cells motion to the electrodes and the ones of the dipole moment (p < 0.01 - 0.05) (Table 1).
Thus, it has been determined that the presence of diffuse liver pathology causes depolarization of erythrocytes. In this case the amplitude-and-frequency-related characteristics of cells in NUAEF serve as a good marker of physical and chemical properties of its membrane and cytoplasm as well as display the condition of its biological activity.
Summarized evaluation of the findings of analysis of viscoelastic and electrical parameters of erythrocytes by method of dielectrophoresis demonstrated a 71.4% sensitivity rate and a 6% specificity of the method as compared to the biopsy findings in diagnosis of various stages of liver cirrhosis.
Special attention was paid to the significance of a positive (“+”) prognostic value of the result of the method, i.e. F3-F4 fibrosis was successfully diagnosed in 83.3% of cases, and the accuracy index equaled to 68.4%. Nevertheless, the negative (“−”) prognostic value of the result of the method aimed to diagnose the absence of
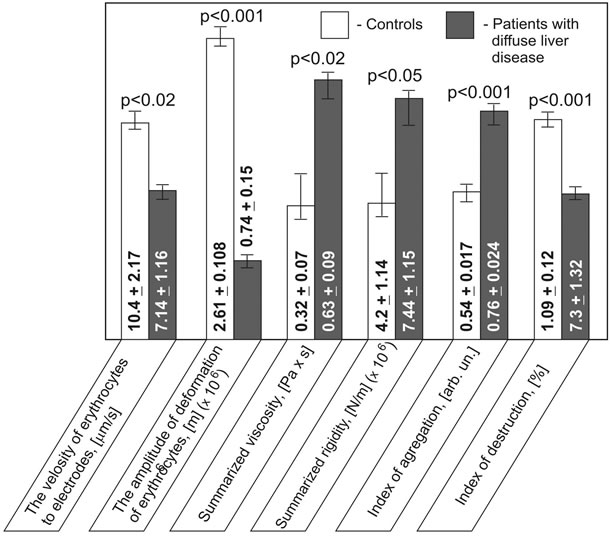
Figure 2. Electric and visco-elastic parameters of erythrocytes in patients with diffuse liver disease and control.
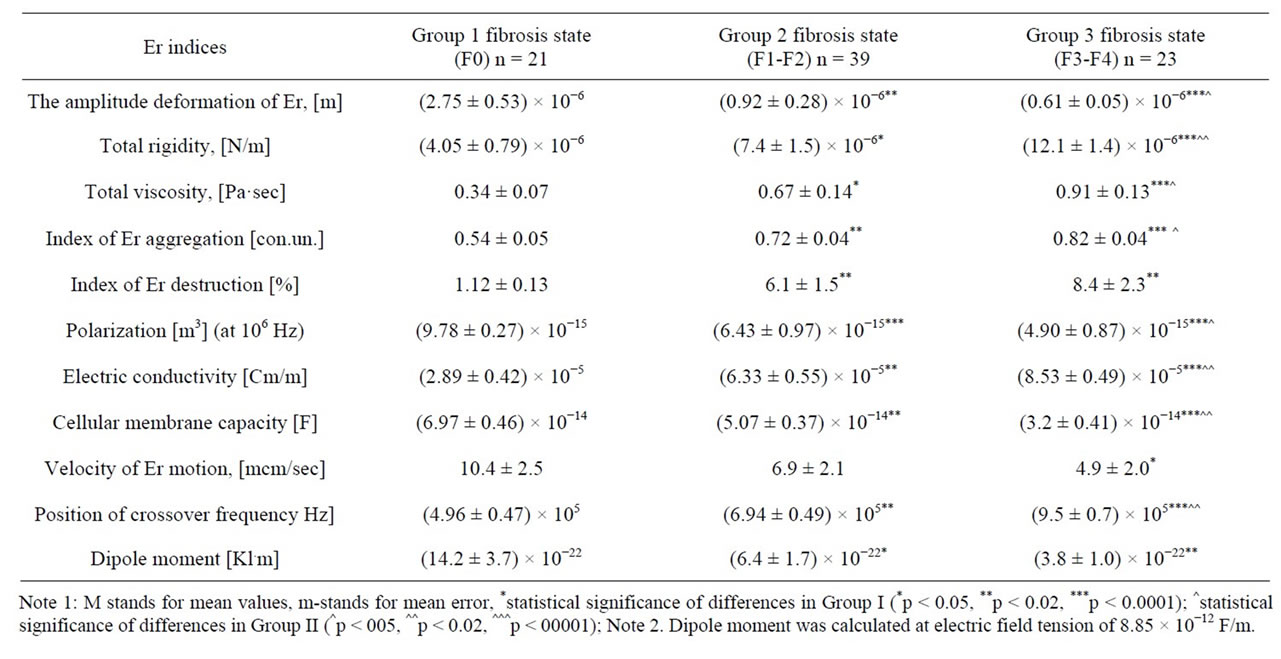
Table 1. Viscoelastic and electrical properties of red blood cells (Er) in patients with diffuse liver disease with various degree of fibrosis (M ± m).
fibrosis, and potentially its early stages turned out to be rather low, i.e. 42.9%.
The need to increase the levels of specificity and sensitivity tfor diagnosis of the degree of liver fibrosis predetermined the necessity to apply such optical methods as ellipsometry, IR-spectroscopy and Raman spectroscopy of blood serum of the patients under study.
Along with aggravation of the liver disease more pronounced changes in blood serum occur. They are due to dysfunction of hepatic protein synthesizing function, aggravation of syndromes of cytolysis, cholestasis, and the immune inflammatory one. Similar disturbances cannot but affect the optical characteristics of blood serum that was demonstrated in our previous pilot studies [3].
Evaluation of ellipsometric indices of thin film findings obtained from blood serum of patients with various degrees of severity of liver fibrosis enabled to reveal significant increase of retraction index in combination with decrease of film thickness along with fibrosis increase (p < 0.001 - 0.002) (Figure 3).
In cases of severe fibrosis similar changes can be attributed to reduction of synthesis of the number of compounds in the liver (i.e. blood serum protein, coagulation factors, cholesterol, triglycerides and others) and they become crucial for the film thickness (correlation for the levels of total cholesterol r = 0.56, p < 0.001; triglycerides r = 0.44, p < 0.01; total protein r = 0.57, p < 0.02). Prevailance of nonhomogeneous films in cases of severe fibrosis can be obviously attributed to the degree of biochemical disbalance in blood serum induced by liver cirrhosis. The index of refraction is to a great degree determined by the components of cytlolytic syndromes (for ALT r = 0.46, p < 0.03, for AST r = 0.41, p < 0.05) and the ones of cholestasis (for total bilirubin r = 0.52, p < 0.01, for GGT r = 0.48, p < 0.033); the degree of intensity of the components tends to increase in severe fibrosis [2].
Evaluation of homogeneity of the surface of blood serum films by means of the “Microscan” high resolution scanning elipsometer revealed that the films obtained from the patients with F3-F4 liver fibrosis tended to be extremely nonhomogeneous in their thickness and had large breaks as compared to the ones of patients with F1-F2 fibrosis (p < 0.05) (Figure 4).
Such changes were determined based on significant dislocations on the IR-spectra, where the peak areas and intensity determining the secondary structure of proteins are registered. Special attention was paid to evaluation of the Amide I, Amide II, Amide III amide groups which are connected with absorption of IR-radiation by the O=C-N-H fragments, the latter being sensible to the secondary structure of protein molecules (α-helix, β-sheet, random coil). Changes of the secondary structure of pro-
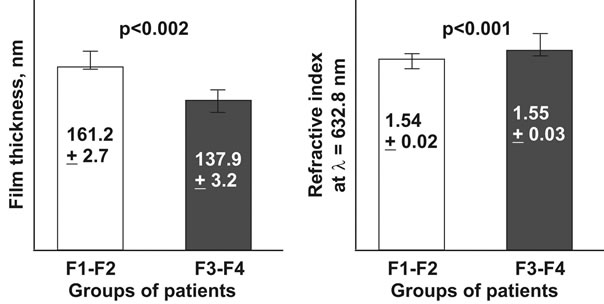
Figure 3. Ellipsometric indices in patients with different degree of liver fibrosis.
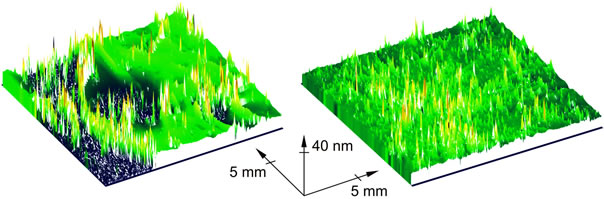 (a) (b)
Figure 4. Thickness distribution of three-dimensional thin films on the surface of plates processed from blood serum of patients with severe F3-F4 liver fibrosis (а) and light F1-F2 liver fibrosis (b).
tein molecules, in their turn, are judged by the presence of pathological process in the organism, including the diffuse liver pathology with various degree of fibrosis.
IR-spectra of patients with severe F3-F4 liver fibrosis demonstrated significantly higher peaks of amide III at 1280 cm−1 in spectrum range of essential amide absorption bands and the peak at 3190 cm−1 reflecting the N-H structures as compared to the ones in patients with F1-F2 fibrosis. Also, the above spectra revealed a significantly more frequent presence of protein molecules with secondary spiral-shaped structure (α-helix) (р < 0.001 - 0.05) (Figure 5).
The patients with F3-F4 fibrosis in contrast to the ones with F1-F2 fibrosis demonstrated significantly lower peaks at 776, 818, 889 cm−1 and 966 cm−1 characteristic for the С-С, С-О bond stretches of deoxyribose and the  fragment of molecules of nucleic acids [9] (р < 0.02 - 0.05). Significant decrease in cases of pronounced fibrosis was demonstrated by some peaks at 1399 cm−1 reflecting symmetrical valent vibrations of CH3 groups of skeletal fragments of protein molecules; peaks at 1450 cm−1 reflected deformed oscillations of CH3 groups of lipids and proteins; peaks at 1570 cm−1 (amide II); 1581, 1620 cm−1 (carbonile structures) (р < 0.01 - 0.05). A significant decrease of the component at 1635 cm−1 revealed upon breakdown of complex amide peaks in patients with F3-F4 liver fibrosis is attributed to the reduction of the amount of protein molecules possessing a structure in the form of a folded sheet (β-sheet) (р < 0.05).
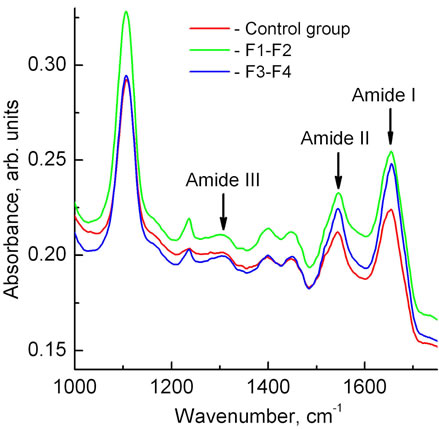
Figure 5. IR-spectra of patients blood serums with different degree of liver fibrosis and of experimental groups (fragments of IR-spectra with various degree of liver fibrosis.
In spectra of the combined light dispersion belonging to samples of liquid blood serum in the range of 750 - 1750 cm−1 one could observe the three typical absorption peaks, i.e. at 1005, 1157 and 1520 cm−1. Their intensity rate tended to be significantly lower in cases of F3-F4 fibrosis as compared to the ones of F1-F2 (р < 0.0058 - 0.02) (Table 2, Figure 6).
No shared opinion has been expressed yet in modern literature on the origin of these peaks; however the majority of authors attribute them to carotins. For example, the authors of [10,11] reported that in oncological patients reduction of content of carotin in blood serum was registered that results in rapid fall of signal intensity at 1005, 1157 and 1520 cm−1 in Raman-spectrum. In case of diffuse liver pathology evaluated in this we can assume that reduction of areas of the above specified peaks in cases of pronounced finbrosis is connected with significant changes in carotin metabolism, their transition into the A vitamin, that is closely connected with the liver function [1,2].
An interesting experimental fact, observed in this study, was associated with the effect of the laser beam on blood serum of patients with various degree of fibrosis when conducting the spectroscopy of combined light dispersion. The patients with light form of fibrosis or without it demonstrated a nonhomogenous surface of their serum. Optic miscroscopic study revealed separate clearly defined areas of less than 0.5 μm.
Laser irradiation caused the interflowing and consolidation of areas up to 10 μm and more (Figures 7(а) and (b)). In case of severe fibrosis the areas under study remained practically unchanged (Figures 7(c) and (d)).
Local heating of blood serum by a laser beam can cause some changes associated with conformational changes. A more decisive influence associated with denaturation of blood serum protein molecules and fusion
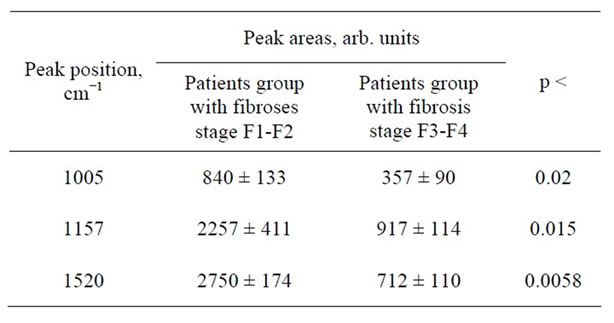
Table 2. Peak areas of the Raman spectra in patients with diffuse liver disease of various degree of fibrosis (M ± m), pstatistical significance.

Figure 6. Raman spectra of the samples of liquid blood serum in patients with light F1-F2 fibrosis (1), severe F3-F4 fibrosis (3) and in patients of control F0 (2).
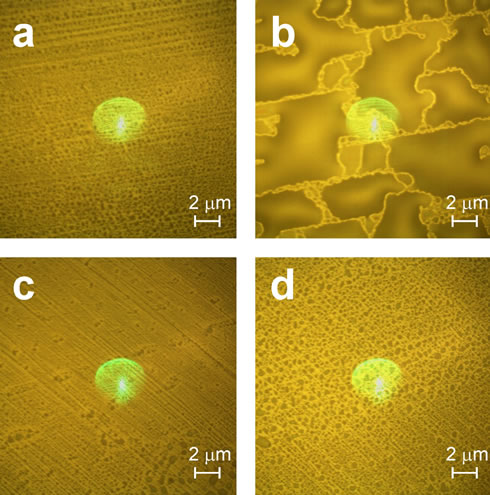
Figure 7. Raman microphotos of surfaces of liquid blood serum of patients with light (F1-F2) fibrosis (а), (b) and severe (F3-F4) fibrosis (c), (d) before (a, c) and after (b), (d) effect of Ar+ 2 - 3 mW laser beam with wave length of 514.5 nm within 3 min.
of breakdown products into larger areas can result in temperature-influenced interflowing of lipoproteins into the larger clusters. Such changes are obviously of adaptational nature and occur due to the influence of some severe pathologic factors upon the human organism.
In this respect the role of the thermotropic phase transfers presents the greatest interest, i.e. stepwise changes in the degree of membrane proteins and lipids ordering under the influence of such factors as temperature, bioactive substances, ultraviolet irradiation and others [12]. It is quite possible that in case of light (medium) fibrosis the state of thermotropic phase transfers in the molecules of proteins and lipids (which composition does not undergo any significant changes) is close to the normal physiological one, that predetermines the possibility of changes within the adaptional limits. As it has been specified in our previous publications [13] a progressing liver pathology is associated with the appearance of abnormal thermotropic phase transfers in proteins and lipids, where the high temperature phase transfer is recognized to be the most stable one and to reflect the degree of the liver damage. Upon the presence of external pathological factor this circumstance tends to significantly limit the interaction of blood serum components. Probably such changes result in a “frozen” image of serum in patients with severe fibrosis following laser radiation affect.
The attempt of further combined application of optical differences in parameters of erythrocytes and blood serum used to determine the degree of fibrosis is based on the well known facts about strong interrelation between red blood cells and blood serum components. There is a constant interchange of lipid components between them. Viscosity level and erythrocytes aggregation at diffuse liver disease (DLD) are known to be influenced to a definite degree by thrombocyte aggregation, hypercholesterolemia, hypertriglyceridemia, fatty acids, and ionic composition. Increase in blood viscosity upon hyperlipidemia is predetermined by the capacity of high density lipoproteids to affect the functional state of regular blood elements, to reduce their electro-kinetic potential and as the result to increase the aggregation capacity and rigidity of membranes.
For example, one can observe inhibition of anticoagulating activity with strong depression of fibrinolysis and activation of blood coagulation service, degradation of rheological blood indexes [9,14] under the influence of alimentary hyperlipidemia. T. Y. Leonova and co-authors [15] have determined that erythrocytes can absorb on their surface lipoproteins of blood plasma charged by cholesterol (in the form of VLDL, HDL and LDL). This capability is attributed to the presence of lipoproteins in blood serum and the need of erythrocytes in cholesterol. Constant cholesterol metabolism is known to happen between erythrocytes and lipoproteins adsorbed on their surface. The most intensive metabolism of cholesterol is observed between red blood cells and HDL. In this case a blood serum enzyme, i.e. lecithin-cholesterol-acyltransferase (LCAT) is known to play a significant role. Its synthesis takes place in the liver and is to a great extent predetermined by its state. One can conclude that diffuse liver pathology is accompanied by decrease of LCAT level with further increase of free cholesterol in blood serum and later on in erythrocytes. This is secured by cholesterol reducing capacity of erythrocytes that, on the one hand, influences upon the intensity rate of cholesterol metabolism between the lipoproteins of blood serum and blood cells, and, on the other hand, it supports a physiological level of cholesterol in erythrocytes. Disturbances in this biologically important mechanism of cholesterol metabolism can result in hypercholeterolemia, the latter being an important risk factor in development of atherosclerosis, IHD and a potential cause of pathologic condition of optical parameters of blood serum [16].
It has been established that large-molecule proteins of blood serum tend to settle on erythrocyte membranes. This results in “screening” of the charge of erythrocytes as well as reduction of its dipole moment and the surface negative charge. Streiff et al. established [17] that zeta potential of erythrocytes correlated with changes in concentration of protein fractions. Stoltz et al., in their turn, revealed that the globulin fraction favored rapid decrease of electrophoretic mobility of erythrocytes while the albumin one would practically not influence upon their mobility in the electrical field. Other researchers [9,18] proved that changes in the electrical charge would mainly depend upon the ratio of protein fractions, i.e. the greater the shift from the normal physsiological state is, the lower the electrical charge becomes. The decrease of electrical charge of erythrocytes and increase of blood serum globulin level are attributed to the absorption of globulin molecules on the cells surface, the latter traditionally possessing the lower electrical charge. The idea that globulins can be adsorbed on the surface of erythrocytes irrespective of their antigenic structure has been confirmed by numerous researchers, including the results of Pirofsky B., Cordowa M., Imel T. (1962). Dysproteinemia associated with the increased γ-globulins has been observed in cases of DLD upon the pronounced immuno-inflammatory syndrome [2]. It can be assumed that decrease of electrical charge of erythrocytes in patients with DLD can be predetermined by changes in ratio of protein fractions.
On the other hand, it has been established that in cases of diffuse liver damages increase of high-molecular weight protein (fibrinogen) in blood plasma is observed, which reduces the negative charge of erythrocyte and hampers their approach [19]. According to V. A. Levtova and the co-authors [20], the fibrogen molecules serve as bridges connecting the cells. Adsorption on the surface of erythrocytes of plasma proteins (fibrin, fibrinogen) tends to favor aggregation and adhesion of erythrocytes. It can serve as one of the reasons of the increase of erythrocytes aggregation index in patients with DLD revealed in this study upon examination by method of dielectrophoresis.
In our previous study [3] we have established the correlation of the optical indices of blood serum, intensity of IR-spectra resonances with lipid and protein components. Consequently, the relations discovered between electrical and visco-elastic parameters of erythrocytes and the optical indices of blood serum seem to be logic. We have also determined the direct correlation between thickness of films with the amplitude of erythrocytes deformation (r = 0.49, p < 0.02), between polarization at high frequencies (r = 0.57, p < 0.033 for 1 MHz; r = 0.41, p < 0.05 for 0.5 MHz) as well as the reverse one related to the total indices of viscosity (r = −0.44, p < 0.048), rigidity (r = 0.40, p < 0.05), electroconductivity (r = −0.60, p < 0.015). The index of refraction would correlate directly with the electrical conductivity (r = 0.53, p < 0.05), the indices of destruction (r = 0.36, p < 0.03), aggregation (r = 0.39, p < 0.05) and would be reversely related to the capacity of erythrocyte membranes (r = 0.46, p < 0.05), the value of dipole moment (r = 0.39, p < 0.04), amplitude of cells deformation (r = 0.41, p < 0.05).
Areas of the peaks of the amide III zone at 1280 cm−1, 3190 cm-1 on IR-spectra of blood serum tended to correlate directly and significantly with amplitude of deformation of erythrocytes (r = 0.62, p < 0.03 for 1280 cm−1; r = 0.58, p < 0.014 for 3190 cm−1) and polarization at all frequencies (at frequency of 1 MHz – r = 0.57, p < 0.02 for 1280 cm−1; r = 0.48, p < 0.01 for 3190 cm−1). The same peaks of the IR-spectra showed the feedbacks with the total indices of viscosity (r = −0.42, p < 0.05 for 1280 cm−1; r = −0.49, p < 0.048 for 3190 cm−1), rigidity (r = −0.35, p < 0.033 for 1280 cm−1; r = −0.50, p < 0.05 for 3190 cm−1), the index of destruction (r = −0.60, p < 0.027 for 1280 cm−1; r = −0.45, p < 0.018 for 3190 cm−1) and electroconductivity of erythrocytes (r = −0.40, p < 0.033 for 1280 cm−1; r = −0.37, p < 0.05 for 3190 cm−1).
The results of comperative evaluation of the set of optical methods for assessment of erythrocytes and blood serum in patients with diffuse liver pathology aimed to diagnose the degree of fibrosis and the results of liver biopsy (“gold standard” for estimation of the degree of fibrosis) are specified in Table 3.
These findings demonstrate sufficiently high values of sensitivity (78.6%) and specificity (87.7%), prognostic value of positive (91.7%) and negative result (66.7%) as well as the index of accuracy (81%) [21]. The increased levels of these values as compared to the isolated study
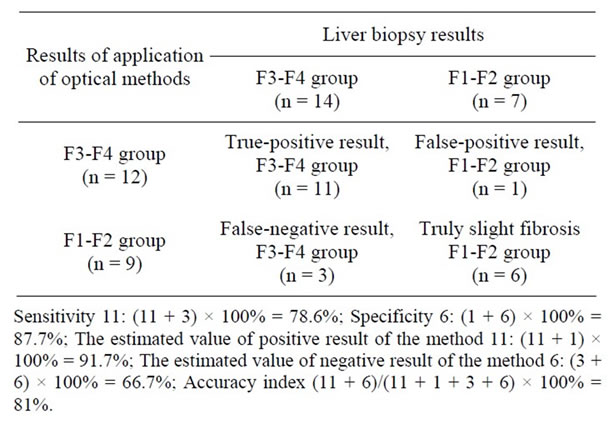
Table 3. Results of evaluation of the set of optical methods aimed to determine the degree of liver fibrosis vs the ones of liver biopsies.
of erythrocytes enable to assume the necessity of application of the “set of optical methods” for blood studies in cases of non-invasive diagnosis of the degree of liver fibrosis. The most important are the perspectives of diagnosis of the early stages of liver fibrosis (according to the data of prognostic value of the negative result).
4. Conclusions
Thus, application of the combination of the “set of optical methods” for studies of erythrocytes and blood serum of patients with diffuse liver pathology enables to significantly increase the indices of sensitivity, specificity, the index of precision as well as to achieve some real results in diagnosis of not only severe cases of fibrosis but to also gain the possibility to diagnose slightly pronounced forms of liver fibrosis.
The discovered diagnostic potential of optical methods can become promising in noninvasive screening diagnosis of stages of diffuse liver pathology of various geneses.
5. Acknowledgements
The study was supported by The Ministry of Education and Science of the Russian Federation, Project # 8041 of 24.08.2012 (Application # 2012-1.1-12-000-1001-004 filed in the Information Computerized System).
REFERENCES
- V. T. Ivashkin and T. L. Lapina, “Gastroenterologiya. Natsionalnoyerukovodstvo (Gastroenterology. National Guide),” GEOTAR-Media, Moscow, 2008.
- S. D. Podymova, “Liver Diseases,” Meditsina, Moscow, 1993.
- M. I. Voevoda, S. E. Peltek, M. V. Kruchinina, S. A. Kurilovich, V. N. Kruchinin, K. P. Mogilnikov and S. V. Rykhlitskii, “Studying Thin Films Obtained through Centrifugation of the Human Blood Serum by Methods of Spectral Ellipsometry and Infrared Spectroscopy,” Optoelectronics, Instrumentation and Data Processing, Vol. 46, No. 4, 2010, pp. 382-393.
- M. V. Kruchinina, S. A. Kurilovich, M. V. Parulikova, A. A. Gromov, T. S. Bakirov, V. M. Generalov and A. V. Pak, “Viscoelastic and Electrical Properties of Red Blood Cells in Patients with Various Degrees of Liver Fibrosis,” Vestnik NGU, Vol. 4, 2005, pp. 43-52.
- V. M. Generalov, M. V. Kruchinina, A. G. Durymanov, A. A. Medvedev, A. S. Safatov, A. N. Sergeev, G. A. Buryk, S. A. Kurilovich and A. A. Gromov, “Dielectrophoresis in Diagnosis of Infectious and Noninfectious Diseases,” ZERIS, Novosibirsk, 2011.
- Y. Dimitriev, Y. Ivanova and R. Iordanova, “History of Sol-Gel Science and Technology (Review),” Journal of the University of Chemical technology and Metallurgy, Vol. 43, No. 2, 2008, pp. 181-192.
- K. Vorotilov, V. Petrovsky and V. Vasiljev, “Spin Coating Process of Sol-Gel Silicate Films Deposition: Affect of Spin Speed and Processing Temperature,” Journal of Sol-Gel Science and Technology, Vol. 5, No. 3, 1995, pp. 173-183. doi:10.1007/BF00487014
- S. V. Ryhlitsky, E. V. Spesivtsev, V. A. Shvets and V. Yu. Prokopiev, “Spectral Ellipsometric Complex Ellipse, 1771,” Pribory I Tekhnika Eksperimenta, Vol. 2, 2007, pp. 160-161.
- G. I. Kozinets and V. A. Makarov, “Issledovaniyesistemykrovi v Klinicheskoypraktike (Studies of Blood System in Clinical Practice),” Triada-X, Moscow, 1997.
- R. Manoharan, Y. Wang and M. S. Feld, “Histochemical Analysis of Biological Tissues Using Raman Spectroscopy,” Spectrochimica Acta Part A, Vol. 52, No. 2, 1996, pp. 215-249. doi:10.1016/0584-8539(95)01573-6
- T. C. B. Schut, G. J. Puppels, Y. M. Kraan, J. Greve, L. van der Maas and C. G. Figdor, “Intracellular Carotenoid Levels Measured by Raman Microspectroscopy: Comparison of Lymphocytes from Lung Cancer Patients and Healthy Individuals,” International Journal of Cancer, Predictive Oncology, Vol. 74, No. 1, 1997, pp. 20-25.
- E. A. Chernitsky and A. V. Vorobey, “Structure and Function of Erythrocyte Membranes,” Nauka I Takhnika, Minsk, 1981.
- M. V. Kruchinina, “Structural and Functional Properties of Red Blood Cells in Somatic Pathology of Alcoholic Genesis,” Avtoref. dis. kand. Med. Nauk, Novosibirsk, 1994.
- V. V. Novitsky, N. V. Ryazantseva and E. A. Stepovaya, “Physiology and Pathophysiology of the Erythrocyte,” Izdatelstvo TGU, Tomsk, 2004.
- T. J. Leonova, “On the Issue of Erythrocytic Mechanism of Control of Cholesteremia in Cases of Experimental Hypercholesteremia and Ischemic Heart Disease,” Avtoref.diss.kand. Med. Nauk, Novosibirsk, 1982.
- F. J. Schiffman, “Pathophysiology of Blood,” Edition Group “BINOM”, Moscow and “Nevsky Dialogue”, Saint-Petersburg, 2000.
- L. Strayer, “Biochemistry,” Mir, Moscow, 1984.
- A. I. Miroshnikov, V. M. Fomchenkov and A. Yu. Ivanov, “Electrophysical Analysis and Separation of Cells,” Nauka, Moscow, 1986.
- A. L. Chizhevsky, “Biophysical Mechanisms of Erythrocyte Sedimentation Rate,” Nauka, Novosibirsk, 1980.
- V. A. Levtov, R. S. A. Egirer and N. H. Shadrina, “Blood Rheology,” Meditsina, Moscow, 1982.
- T. Grinhald, “Evidence-Based Medicine,” GEO-TARGMedia, Moscow, 2004.
NOTES
*Corresponding author.